Forex analysis review
Forex analysis review |
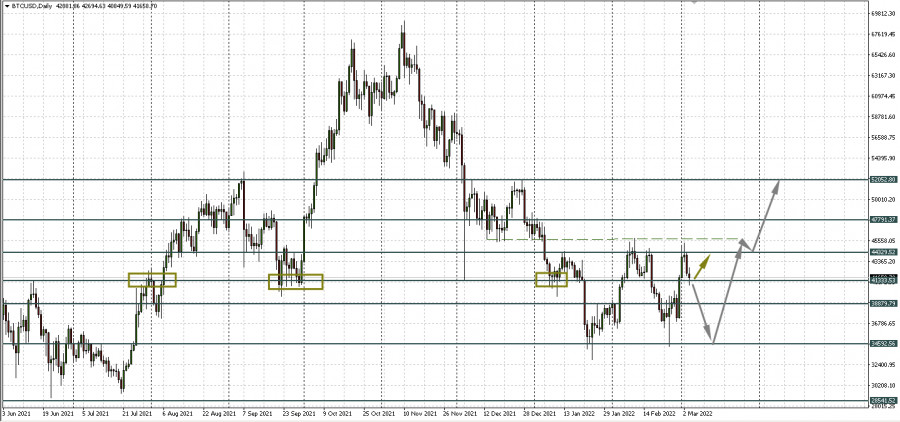
- Bitcoin rally fueled by whales and expectations. BTC risks sliding to 34,000
- March 4, 2021 : GBP/USD Intraday technical analysis and significant key-levels.
- March 4, 2021 : EUR/USD daily technical review and trading opportunities.
- March 4, 2021 : EUR/USD Intraday technical analysis and trading plan.
- March 4, 2021 : EUR/USD Intraday technical analysis and trading plan.
- Technical analysis of ETH/USD for March 04, 2022
- Technical analysis of BTC/USD for March 04, 2022
- XAU/USD Analysis and Trading Plan
- Trading signals for Nasdaq-100 (#NDX) on March 4-7, 2022: sell below 14,150 points (21 SMA)
- Video market update for March 04,,2022
- Trading signals for GBP/USD on March 4-7, 2022: buy in case of rebound at 1.3187 (0/8 Murray)
- EURUSD: Fed draws clear plan on monetary policy, ECB still to decide
- EUR/USD Analysis on 4th March, 2022
- GOLD Hot Forecast on 4th March, 2022
- Trading signals for EUR/USD on March 4-7, 2022: buy in case of rebound 1.0920 (-1/8 Murray)
- GBP/USD on March 4, 2022
- The euro is falling rapidly on March 4
- Technical analysis of AUD/USD for March 04, 2022
- EUR/USD on March 4. Euro continues to decline
- Short-term Gold analysis.
- Technical analysis of GBP/USD for March 04, 2022
- New highs for the Dollar index.
- EURUSD under pressure.
- Ethereum rejected at trend line resistnace.
- EUR/USD analysis for March 04, 2022 - Strong downside momentum
| Bitcoin rally fueled by whales and expectations. BTC risks sliding to 34,000 Posted: 04 Mar 2022 09:26 PM PST According to many, the main cryptocurrency had gained this week thanks to US sanctions against Russia. However, recent data shows that Russians do not use cryptocurrencies to circumvent sanctions. Blockchain company Chainalysis reported that the value of ruble-denominated crypto activity as of March 3 amounted to $34.1 million. This indicates a 50% decline from $70.1 million in activity seen a week ago on February 24. In May 2021, the amount of ruble-denominated crypto activity reached a record $158 million. Citigroup data also shows that actual bitcoin purchases from Russia averaged only 210 BTC per day. Against this background, it can be concluded that Russia's purchasing power appears to have little effect on the cryptocurrency market. Who Actually Buys Bitcoin?This week's rise in the value of bitcoin can be attributed to the fact that crypto whales resumed purchases. "Russian volumes have been relatively small so far, suggesting that the price action is more due to investors positioning for an expected uptick in demand from Russia, rather than Russian demand itself," Citigroup analysts note. "It will take meaningful capital flight to move the needle." Reaction of cryptocurrencies to global threatsOn Thursday, the Zaporizhzhia nuclear power plant, the largest in Europe, was seized by Russian forces. Against this background, the first cryptocurrency has dropped in value by over 5% in the last 24 hours as Russia escalates its attack on Ukraine. Other top altcoins have plunged by 5-10%. "Continued volatility could be a result of ongoing geopolitical strife and macro uncertainty," Fundstrat analysts said. If prices extend losses, "recent precedent gives us some confidence that purchasers will step up" in the range from $33,000 to $35,000, they added. Local correction or third bottomAs noted in yesterday's review, if the main cryptocurrency fails to overcome the resistance level of 44,329.52, the triple bottom reversal pattern may form a third bottom. Meanwhile, the asset's downward movement has been limited by the support level of 41,333.53. However, it is difficult to say whether this mark will be able to prevent the digital currency from sliding further or not. If the price breaks through and fixes below this boundary, bitcoin will most likely return to 34,000 - 37,000, the area where bitcoin has already been bought back twice since January by crypto whales.
|
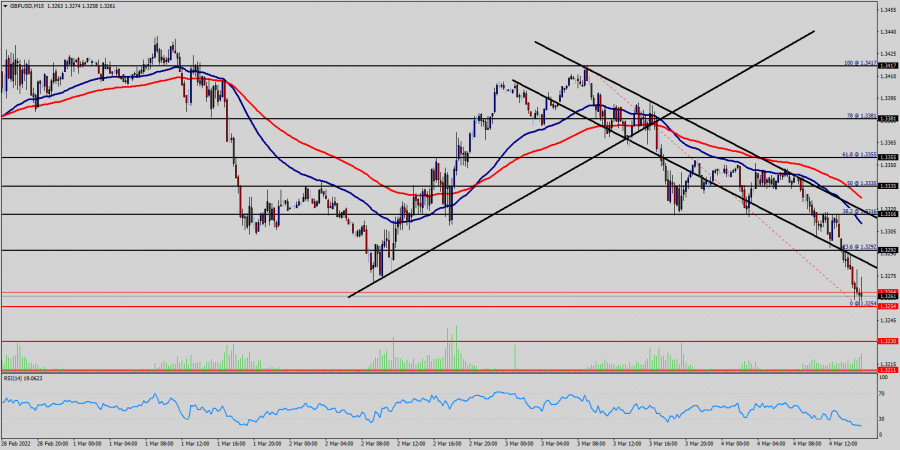
| March 4, 2021 : GBP/USD Intraday technical analysis and significant key-levels. Posted: 04 Mar 2022 12:08 PM PST
Bearish extension took place towards 1.3220 where the lower limit of the current movement channel came to meet with Fibonacci level. Conservative traders should have taken BUY trades around 1.3200 price levels as suggested in previous articles. Shortly after, BUYERS were watching the price levels of 1.3730 to have some profits off their trades as it stood as a key-resistance which offered significant bearish rejection recently. The short-term outlook turned bearish when the market went below 1.3600. This enhanced the bearish side of the market towards 1.3400 which brought the pair back towards 1.3600 for another re-test. Hence, the recent bullish pullback towards 1.3600 should have been considered for SELL trades as it corresponded to the upper limit of the ongoing bearish channel. It's already running in profits. Bearish persistence below 1.3400 is needed for further downside continuation while initial bearish target is located around 1.3200 then 1.3000 where the lower limit of the movement channel is located. On the other hand, please note that any bullish breakout above 1.3400 should be considered as exit signal. The material has been provided by InstaForex Company - www.instaforex.com |
| March 4, 2021 : EUR/USD daily technical review and trading opportunities. Posted: 04 Mar 2022 12:08 PM PST
In late September, Re-closure below the price level of 1.1700 has initiated another downside movement towards 1.1540. Price levels around 1.1700 managed to hold prices for a short period of time before another price decline towards 1.1200. Since then, the EURUSD has been moving-up within the depicted movement channel until bearish breakout occurred by the end of last week's consolidations. Few weeks ago, the price zone of 1.1350 failed to offer sufficient bearish rejection that's why it was bypassed until 1.1500 which applied significant bearish pressure on the pair. A possible SELL Entry was offered upon the previous ascending movement towards 1.1500. Any upside movement towards 1.1150 should be considered for another SELL trade. On the other hand, the EURUSD is currently oversold. Thus, any bearish trades should be discarded until considerable upside movement is demonstrated. The material has been provided by InstaForex Company - www.instaforex.com |
| March 4, 2021 : EUR/USD Intraday technical analysis and trading plan. Posted: 04 Mar 2022 12:08 PM PST
The bullish swing that originated around 1.1650 in August, failed to push higher than the price level of 1.1900. That's why, another bearish pullback towards 1.1650 was executed. However, extensive bearish decline has pushed the EURUSD pair towards 1.1600 and lower levels was reached. Shortly after, significant bullish recovery has originated upon testing the price level of 1.1570. The recent bullish pullback towards 1.1650-1.1680 was expected to offer bearish rejection and a valid SELL Entry. Significant bearish decline brought the EURUSD pair again towards 1.1550 levels which stood as an Intraday Support zone. Hence, sideway movement was demonstrated until quick bearish decline occurred towards 1.1200 where the current sideway channel was established. On the other hand, the price levels around 1.1520 stands as a reference zone that provides a valid SELL Entry when bullish momentum fades away. Bearish decline below 1.1300 should be considered as a bearish continuation sign. If so, downside movement should be expected to proceed towards 1.1000 then 1.0920 if sufficient bearish momentum is maintained. The material has been provided by InstaForex Company - www.instaforex.com |
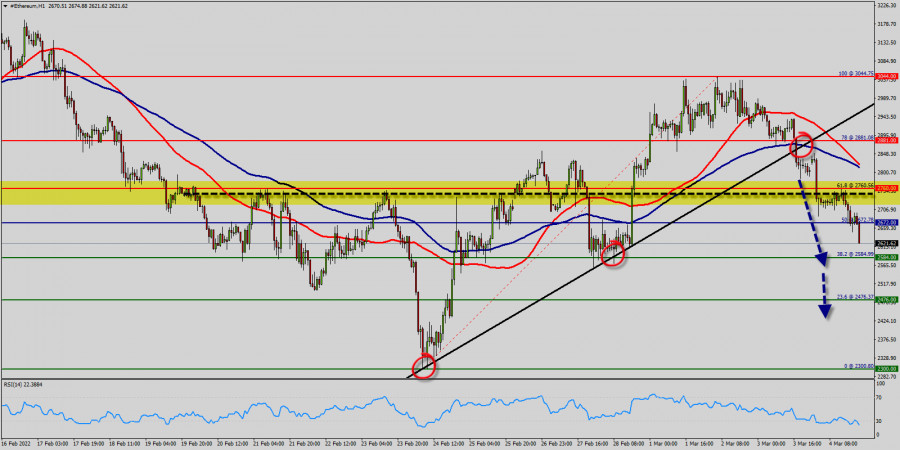
| Technical analysis of ETH/USD for March 04, 2022 Posted: 04 Mar 2022 12:01 PM PST
Technical market outlook (Ethereum) : The bears should break through $ 2,584 in order to resume the downtrend. Closing below the first support ($ 2,584) could assure that ETH/USD will move lower towards stimulating new lows. The volatility is very high for that the ETH/USD is still moving between $ 2,672 and $ 2,476 in coming hours. Consequently, the market is likely to show signs of a bearish trend again. Moreover, in larger time frames the trend is still bearish as long as the level of $ 2,672 is not breached The trend is still calling for a strong bearish market from the spot of $ 2,672 - $ 2,476. Remember that sellers are asking for a high price. So, it will be good to sell below the level of $ 2,672 with the first target at $ 2,584 and further to 2,476 in order to test the daily support . Please check out the market volatility before investing, because the sight price may have already been reached and scenarios might have become invalidated. However, if the ETH/USD is able to break out the daily resistance at $ 2,760 - stop loss has always been in consideration thus it will be useful to set it above the last double top at the level of 3,044 (notice that the major resistance today has set at 3,044). The material has been provided by InstaForex Company - www.instaforex.com |
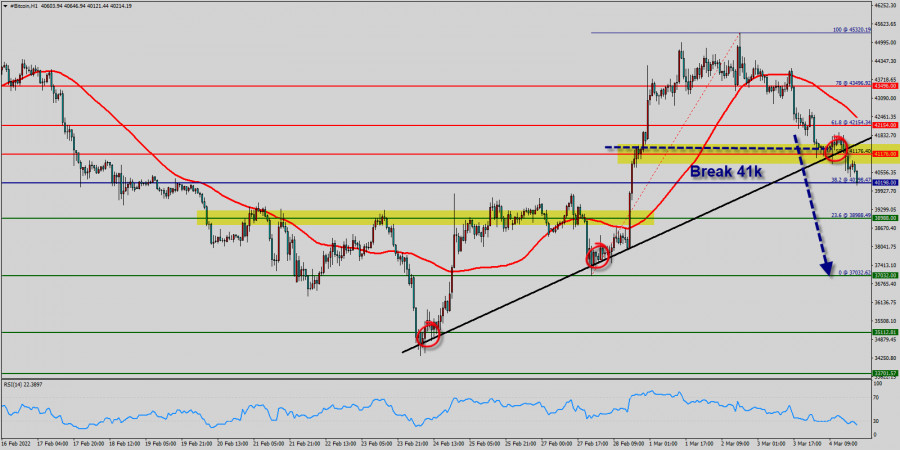
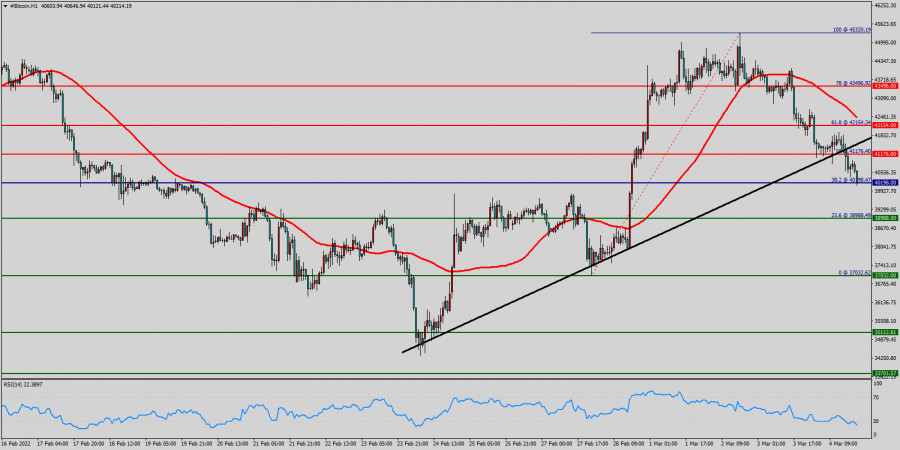
| Technical analysis of BTC/USD for March 04, 2022 Posted: 04 Mar 2022 11:41 AM PST
Technical market outlook (Bitcoin) : After finding asks reach to $ 40,198, bitcoin price recovered below the prices of $ 41k and $ 42k. Initial Bitcoin resistance lies near the $ 41,176 level (50% of Fibonacci retracement levels). A decent breakout and follow-up move below the price of $ 41k and $ 42k could open the gate for a push towards the $ 38,988 level. The main resistance remains near the area of $ 41k and $ 42k. Also it should be noted that Bitcoin and cryptocurrencies unite as the bulls lose their momentum. The market is indicating a bearish opportunity below the above-mentioned support levels, for that the bearish outlook remains the same as long as the 100 EMA is headed to the downside. The volatility is very low for that the BTC/USD is still moving between $ 41,176 and $ 37,032 in coming days. On the downside, the $ 38,988 level represents support. The next major support is located near the $ 37,032, which the price may drift below towards the $ 37,032 support region. Bitcoin is at lowest against the dollar around the spot of $ 40k - Bitcoin is inside in downward channel. Closing below the major resistance ($ 42k) could assure that BTC/USD will move lower towards cooling new lows. Bitcoin is continuing dropping by market cap at 2% in a day, 15% in a week, and 75% in a month, and is trading at $ 40k after it reached $ $ 39k earlier Bitcoin has been set below the strong resistance at the price of $ 42k, which coincides with the 61.8% Fibonacci retracement level. This resistance has been rejected three times confirming the veracity of a downtrend. The market is likely to show signs of a bearish trend around the area of $ 42k and/or $ 41k. Sell orders are recommended below the zone of $ 41k with the first target at the price of $ 38,988; and continue towards 37,032 in order to test the last bearish wave. On the other hand , if the BTC/USD succeeds to break through the resistance price of $ 42k, the market will rise further to $ 45,320.
|
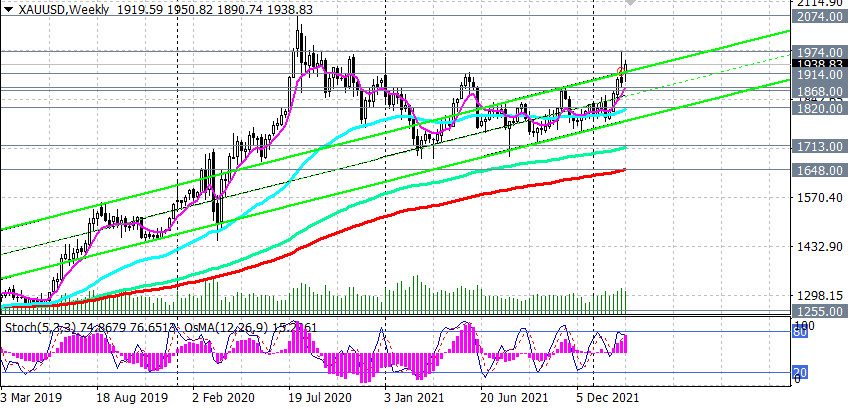
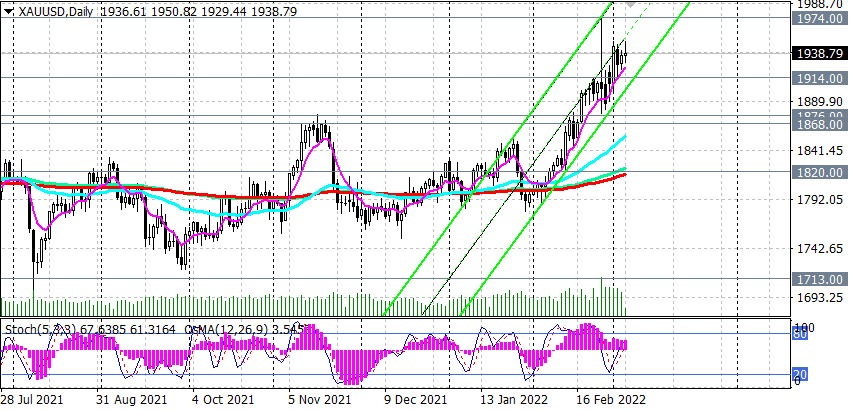
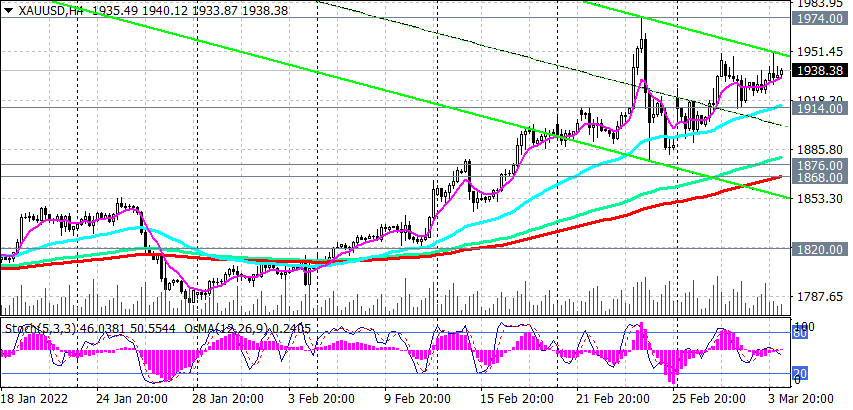
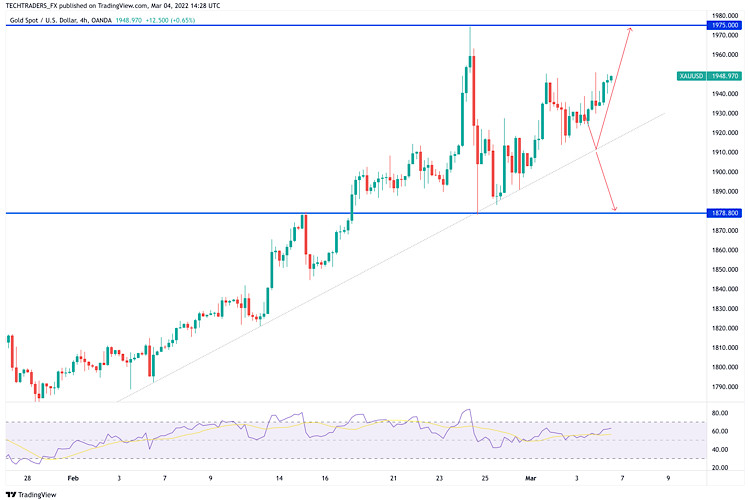
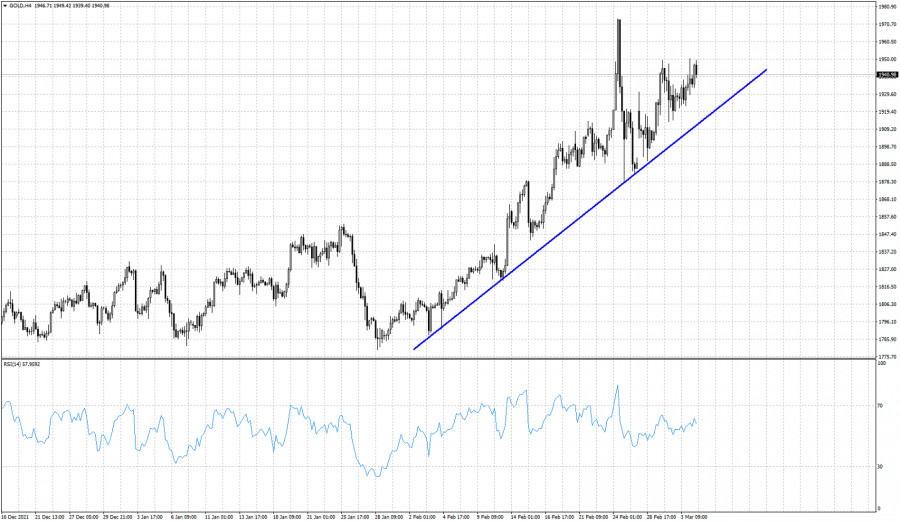
| XAU/USD Analysis and Trading Plan Posted: 04 Mar 2022 08:17 AM PST Initial jobless claims fell by 18,000 to 215,000 in the week of Feb. 20-26, the U.S. Department of Labor said on Thursday, against a revised value of 233,000 in the previous week. Thus, the number of initial claims for unemployment benefits in the U.S. last week remained near historical lows, which indicates a shortage of resources in the country's labor market. This report was another confirming signal after the publication on Wednesday of ADP data on private sector employment on the stability of the American labor market after its collapse in early 2020 due to the coronavirus pandemic. Now market participants are waiting for the publication today at 13:30 (GMT) of the official monthly report of the U.S. Department of Labor with employment data in February. Economists expect an increase in wages, an increase in the number of jobs by 440,000, and a decrease in unemployment to 3.9%. These are very strong indicators that should strengthen the market's opinion that the Fed is determined to tighten its monetary policy. In his speech before the U.S. Congress on Thursday, Fed Chairman Jerome Powell said that he does not exclude that the agency will take a wait-and-see attitude during the meeting at the end of March, given the situation around Ukraine. Although personally, he is determined to raise the interest rate. Meanwhile, market participants prefer to take a wait-and-see position on the eve of the publication of the official report of the U.S. Department of Labor, hoping to receive additional confirmation of the possibility of raising interest rates during the March meeting of the Fed. Moderate pressure on the position of the dollar is exerted by macroeconomic statistics published yesterday from the U.S. Thus, the PMI index in the services sector from ISM fell to 56.5 in February (against 59.9 in January and the forecast of 61.0). The employment index in the services sector from the ISM for the same period also fell sharply (to 48.5 from 52.3 and against the forecast of 53.5). Uncertainty around the military conflict in Ukraine has a negative impact on investor sentiment, supporting the traditional defensive asset gold. It is not known to bring investment income, but is a popular defensive asset, especially in the face of rising inflation and geopolitical tensions. Its quotes are extremely sensitive to changes in the monetary policy of the world's leading central banks, especially the Fed. When it tightens, the quotes of the national currency (under normal conditions) tend to grow, while the price of gold falls. However, as we can see from the long-term charts, its price is not going to fall. At the time of writing this article, the XAU/USD pair is near 1938.00, preparing to end this week higher. According to analysts of the gold market, the dynamics of its prices will depend on "whether investors' fears about inflation will intensify and whether interest rates will rise faster than expected." At the same time, we can assume that gold has room for growth, given the military conflict between Russia and Ukraine. Technical analysis and trading recommendations As noted above, at the time of writing, the XAU/USD pair is trading near 1938.00, remaining in a long-term bull market and moving within an ascending channel on the daily chart. Its upper border passes near the mark of 1990.00, above the local 17-month high of 1974.00 reached last week. The mark of 1990.00 will be a reference point in case of further growth of XAU/USD and after the breakdown of the local resistance level of 1974.00. A more distant target, which so far looks theoretical, is 2074.00, reached in August 2020. Data from the U.S. points to a rapid acceleration in inflation, which the Fed may simply not be able to keep up with if it takes a less aggressive stance on monetary policy than markets expect. And the closer the March meeting of the Fed, the stronger the volatility in dollar and gold quotes will grow. In the meantime, long positions look preferable in the XAU/USD pair.
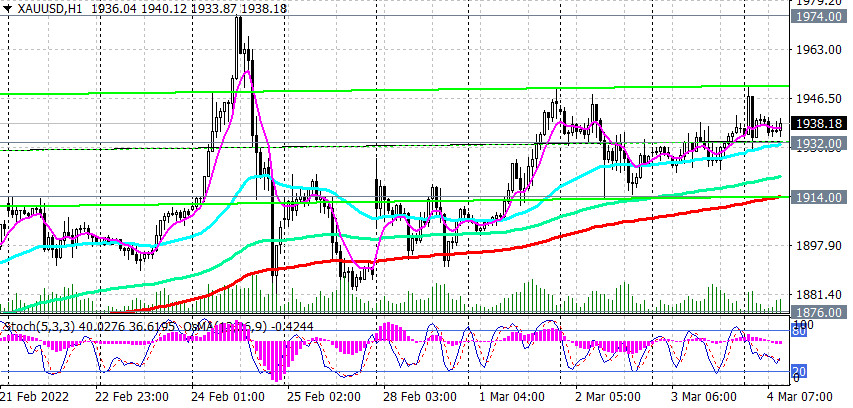
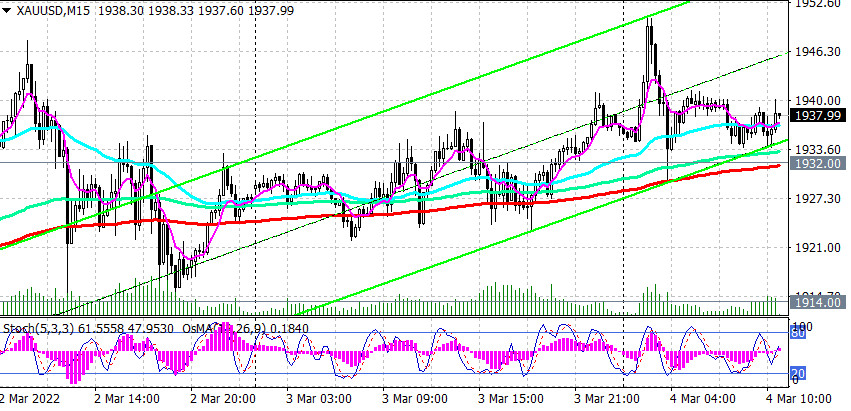
In an alternative scenario, XAU/USD will return to the key long-term and psychologically important support level of 1800.00. The first signal for the implementation of this scenario will be a breakdown of the short-term support level of 1932.00 (200 EMA on the 15-minute chart), and a breakdown of the support level of 1914.00 (200 EMA on the 1-hour chart) will strengthen the corrective downward dynamics, sending XAU/USD to the support levels of 1876.00, 1868.00 (200 EMA on the 4-hour chart). However, only a breakdown of the support levels of 1713.00 (144 EMA on the weekly chart), 1648.00 (200 EMA on the weekly chart) will increase the risks of breaking the long-term bullish trend of XAU/USD.
Support levels: 1932.00, 1914.00, 1876.00, 1868.00, 1820.00, 1800.00, 1713.00, 1700.00, 1648.00 Resistance levels: 1974.00, 2000.00, 2010.00, 2074.00
Trading recommendations XAU/USD: Sell Stop 1928.00. Stop-Loss 1951.00. Take-Profit 1914.00, 1876.00, 1868.00, 1820.00, 1800.00, 1713.00, 1700.00, 1648.00 Buy Stop 1951.00. Stop-Loss 1928.00. Take-Profit 1960.00, 1970.00, 1995.00, 2000.00, 2070.00 The material has been provided by InstaForex Company - www.instaforex.com |
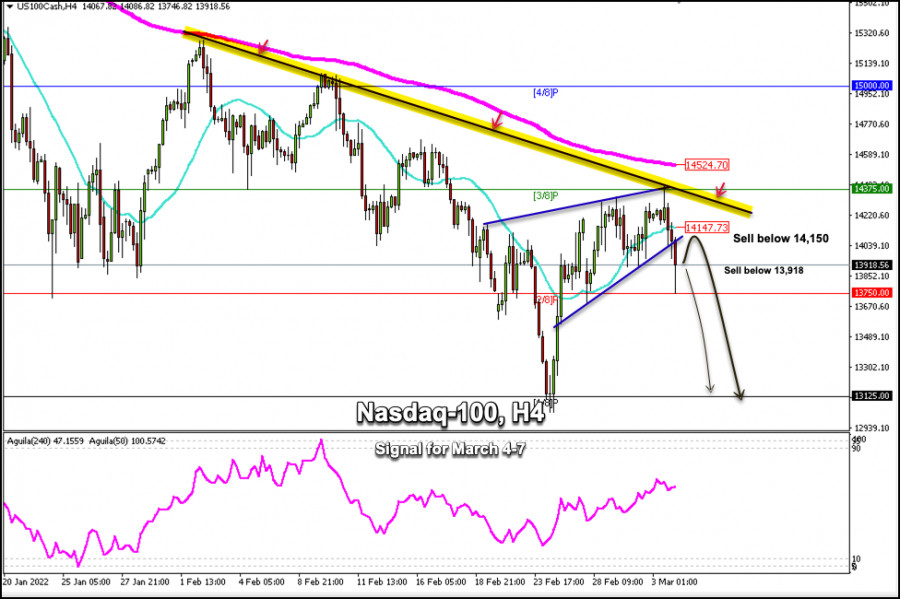
| Trading signals for Nasdaq-100 (#NDX) on March 4-7, 2022: sell below 14,150 points (21 SMA) Posted: 04 Mar 2022 07:56 AM PST
Stock markets in Europe have extended losses in the last hours and Wall Street futures follow the same path. The negative climate due to the intensification of the crisis in Ukraine is affecting the top 100 technology stocks that comprise the Nasdaq-100 index (#NDX). According to the 4-hour chart, we can see that the Nasdaq-100 has broken the 21 SMA and is trading below 14,150. We can also see the rising wedge pattern's break which means there could be a technical correction in the next few days towards the support area at 13,750 and up to 13,125. Yesterday, early in the American session, the Nasdaq attempted to break out of the downtrend channel formed since February 27th. The index failed to exit it due to the fact that EMA 200 is located above this channel, which exerts strong downward pressure. As the Nasdaq-100 is below the 200 EMA and below the 21 SMA any bounce towards these zones will be seen as an opportunity to continue selling with targets at 13,125. On the contrary, a daily close above 14.375 (3/8) and a sharp break of the downtrend channel will be a clear signal to buy. This price action could be the beginning of a new upward move so that the price could reach 4/8 Murray at the level psychological of 15,000 points. The eagle indicator is approaching the overbought zone and it is likely that in the coming hours the NASDAQ will continue its downward trend and could fall below 13,750. Support and Resistance Levels for March 04 - 07, 2022 Resistance (3) 14,586 Resistance (2) 14,317 Resistance (1) 14,139 ---------------------------- Support (1) 13,750 Support (2) 13,414 Support (3) 13,125 *********************************************************** Scenario Timeframe H4 Recommendation: sell below Entry Point 14,150 Take Profit 13,750, 13,125 Stop Loss 14,300 *************************************************************************** The material has been provided by InstaForex Company - www.instaforex.com |
| Video market update for March 04,,2022 Posted: 04 Mar 2022 07:42 AM PST Watch for upside continuation on the Gold... The material has been provided by InstaForex Company - www.instaforex.com |
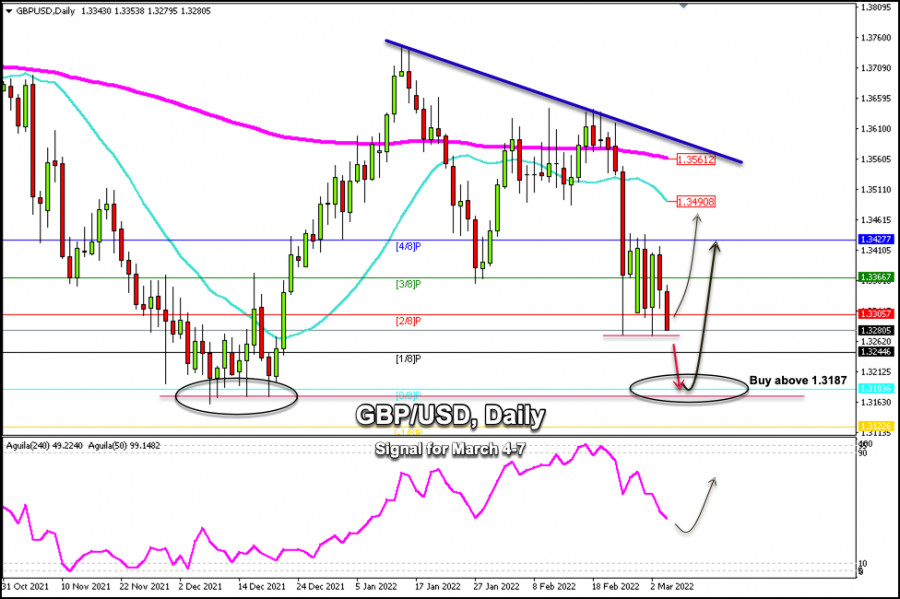
| Trading signals for GBP/USD on March 4-7, 2022: buy in case of rebound at 1.3187 (0/8 Murray) Posted: 04 Mar 2022 07:28 AM PST
GBP/USD is extending its decline ahead of US employment data. At time of writing, it is trading at 1.3280 with a very bearish bias. The dollar index (USDX) has been rising sharply above 98.60 aheda of the NFPs release. The pair remains under pressure in the context of risk-off mood the financial markets due to the situation in Ukraine. According to the daily chart, a downtrend channel can be seen formed since January 11, from the high at 1.3747. In the next few hours, the price of the British pound is likely to bounce off the bottom of the 0/8 Murray support around 1.3188 if selling pressure prevails. Following the second round of the peace talks on Thursday, the military aggression in Ukraine continues. According to the news, Russia has attacked and taken control of the Zaporiozhzhia nuclear power plant. If the situation continues to worsen between Russia and Ukraine, it is likely that the US dollar will be a safer option to invest in, just like gold. Therefore, any bounce towards the zone resistance 4/8 Murray or towards the 21 SMA will be considered an opportunity to continue selling the British pound. In the next few hours, we expect a technical rebound because the eagle indicator is showing an oversold signal. We could take advantage of buying above 0/8 Murray (1.3188) or above support of Dec 2. We will have the opportunity to buy only if the pound remains traded above 1.3180. On the contrary, if GBP/USD breaks this zone, the downward acceleration is likely to continue and the price could reach the psychological level of 1.3000. Support and Resistance Levels for March 04 - 07, 2022 Resistance (3) 1.3427 Resistance (2) 1.3366 Resistance (1) 1.3305 ---------------------------- Support (1) 1.3241 Support (2) 1.3202 Support (3) 1.3183 *********************************************************** Scenario Timeframe H4 Recommendation: buy if rebound Entry Point 1.3187 or 1.3220 Take Profit 1.3305; 1.3427 Stop Loss 1.3130 Murray Levels 1.3427(4/8), 1.3366(3/8) 1.3505(2/8), 1.3244(1/8) *************************************************************************** The material has been provided by InstaForex Company - www.instaforex.com |
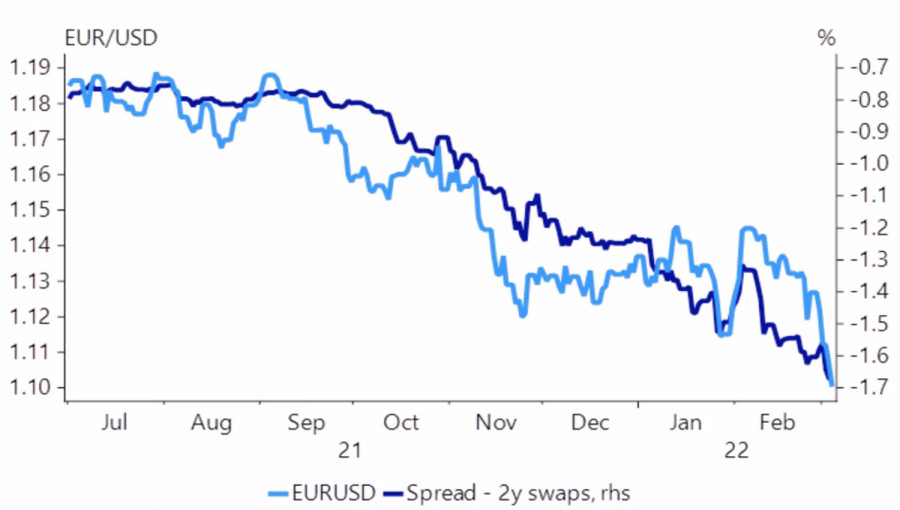
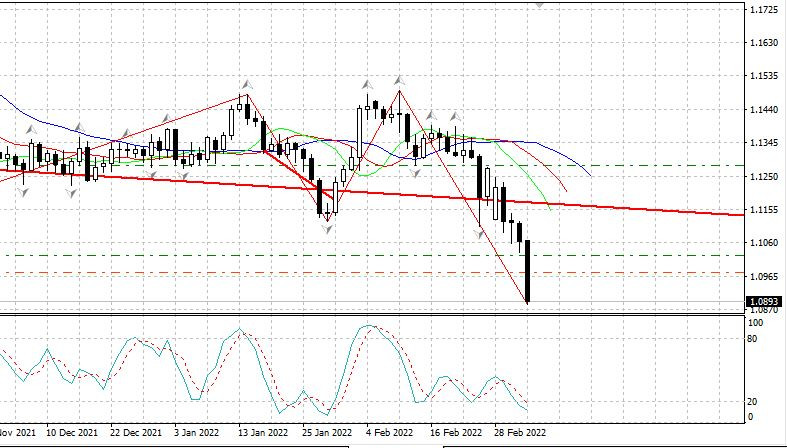
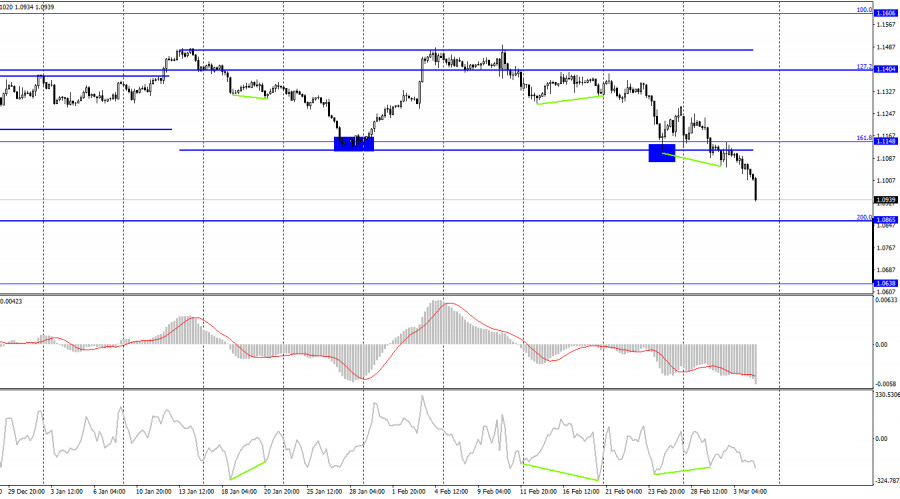
| EURUSD: Fed draws clear plan on monetary policy, ECB still to decide Posted: 04 Mar 2022 07:18 AM PST While the Fed has made its decisions, the ECB has an important choice to make at its March 10 meeting. Dependent on energy supplies from Russia, the Eurozone economy is suffering more losses than its American counterpart. And the fact that the war in Ukraine is unlikely to end quickly will continue to faithfully serve safe-haven assets. The "bears" on EURUSD have plenty of trump cards to push quotes down. Which they do. U.S. Federal Reserve Chairman Jerome Powell painted a rather transparent picture during his testimony before the U.S. Congress. He will propose to raise the federal funds rate in March, after which the rate of monetary restriction may be increased in the event of a further acceleration of inflation or its being at high levels for longer than the Central Bank expects. The latter scenario looks very likely in light of the impact of events in Eastern Europe on the commodity market. The ECB has not yet made its choice, and it will not be easy to do so. Even financial markets have difficulty making decisions. Eurozone bond yields have fallen, signaling a bleak outlook for the currency bloc's economy. At the same time, inflation expectations jumped well above the 2% target. If ECB President Christine Lagarde and her colleagues turn a blind eye to this, a self-fulfilling prognosis awaits them: when consumers expect high prices in the future, consumers buy goods, which leads to a further acceleration of inflation. Something needs to be done. As an option, taper QE earlier than currently expected. Thus, the Fed has outlined the trajectory of tightening monetary policy, the ECB has yet to do this, but it is obvious that we will talk about different speeds. As a result, rate-sensitive derivatives are signaling that the EURUSD pair may fall to 1.08. Dynamics of EURUSD and currency swap spreads
The close dependence of Europe on Russian gas supplies leads to the fact that, in the conditions of their limitation, the prices for blue fuel in the euro area grow much faster than in the Americas. Europeans spend more money on electricity bills than Americans. That is, they have less for consumption, which determines the rate of GDP growth. For sure, because of the war in Ukraine, the eurozone economy will expand more slowly than its U.S. counterpart. If we add to the divergence in monetary policy and in economic growth the high demand for safe-haven assets in the face of uncertainty due to the military conflict in Eastern Europe and the overwhelming interest in dollar financing, then the picture will definitely develop in favor of the "bears" on EURUSD. A strong report on the U.S. labor market may add fuel to the fire, however, I personally would not be surprised by some pullback of the pair due to partial profit-taking by short speculators. Technically, on the daily chart, EURUSD continues to work out the Broadening Wedge pattern. Short positions formed from levels 1.126, 1.117, and 1.111 turned out to be a good decision. Now traders should use pullbacks to build them up. Pivot points 1.092 and 1.088 act as targets for the downward movement. EURUSD, Daily chart
|
| EUR/USD Analysis on 4th March, 2022 Posted: 04 Mar 2022 06:46 AM PST
EUR/USD extended its daily slide and touched its weakest level in 22 months below 1.0900. The broad-based dollar strength continues to weigh heavily on the pair after the February jobs report showed that Nonfarm Payrolls rose by 678,000, beating the market forecast of 400,000 by a wide margin. The Relative Strength Index (RSI) on the four-hour chart is now slightly below 30, showing that the pair is technically oversold. Hence, 1.1000 (psychological level) support could hold in the short term and the pair could stage a correction before the next attempt. In case buyers fail to defend that support, the next bearish target is located at 1.0960 (static level). On the upside, former support of 1.1060 now aligns as initial resistance. The descending trend line coming from Monday reinforces that resistance as well. As long as this level stays intact, sellers should continue to dominate the pair's action. Above 1.1060, 1.1100 (psychological level, 20-period SMA) could be seen as the next resistance before 1.1150 (static level). The material has been provided by InstaForex Company - www.instaforex.com |
| GOLD Hot Forecast on 4th March, 2022 Posted: 04 Mar 2022 06:44 AM PST
Gold edges slightly lower after testing $1,950 on Friday but manages to stay afloat in positive territory above $1,940. The impressive February jobs report from the US allowed Treasury bond yields to recover modestly, limiting XAU/USD's upside. Apart from the encouraging fundamentals favoring gold price, the metal's technical setup on the four-hour chart also points to more upside. That said, the yellow metal has confirmed an upside breakout from a symmetrical triangle formation after yielding a four-hourly candlestick closing above the falling trendline resistance at $1,936. With the bullish breakout, gold price is positioned to retest the 13-month highs of $1,975 if it finds acceptance above the $1,950 psychological barrier. The Relative Strength Index (RSI) is holding firmer above the midline, adding credence to a potential move higher. On the downside, the immediate cushion is seen at the triangle resistance turned support at $1,935, below which a sharp sell-off could be triggered towards the powerful cap of $1,928. At that point, the triangle support and bullish 21-Simple Moving Average (SMA) coincide. A firm break below the latter could lead to the pattern failure, fuelling a fresh downswing towards the ascending 50-SMA at $1,916. The material has been provided by InstaForex Company - www.instaforex.com |
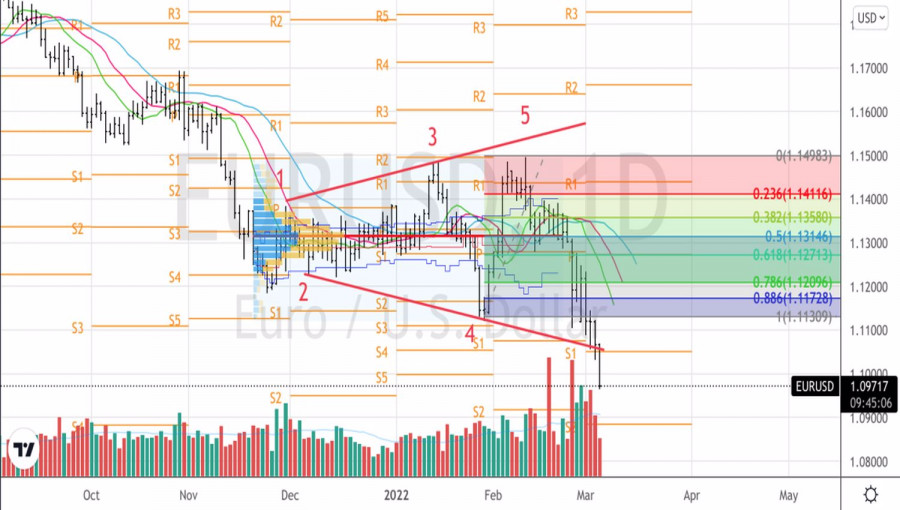
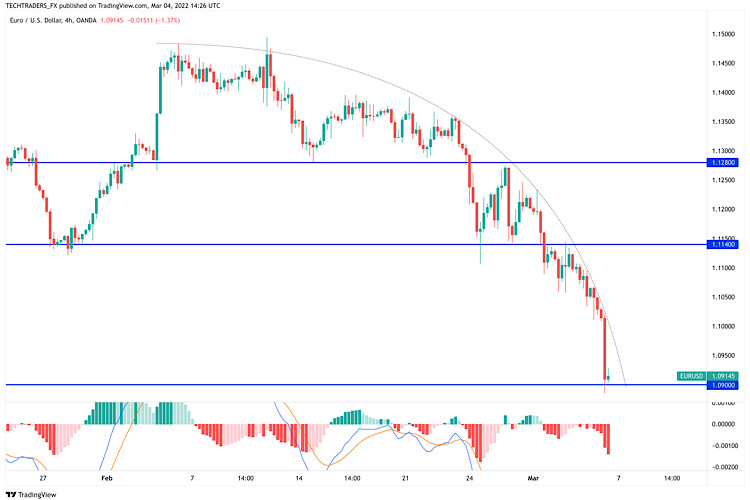
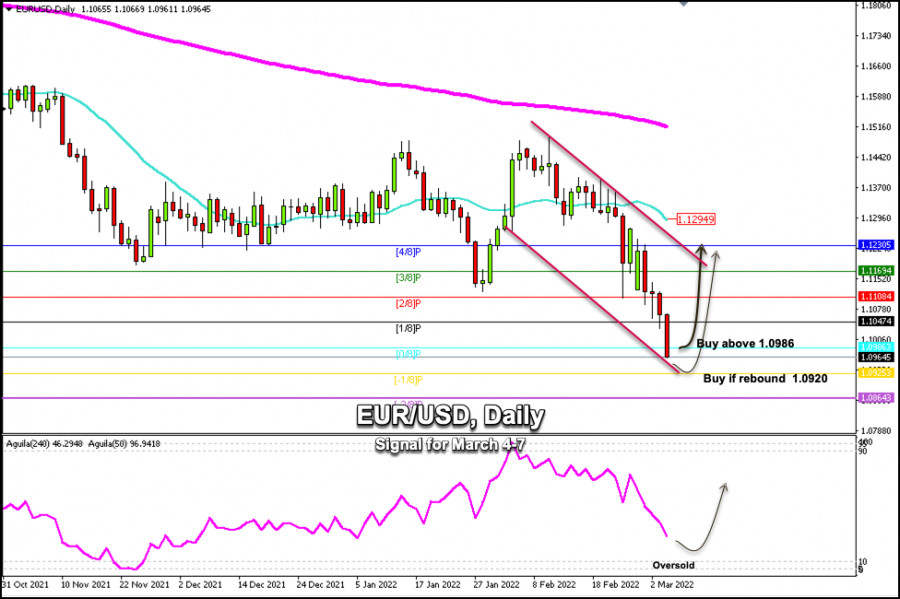
| Trading signals for EUR/USD on March 4-7, 2022: buy in case of rebound 1.0920 (-1/8 Murray) Posted: 04 Mar 2022 06:23 AM PST
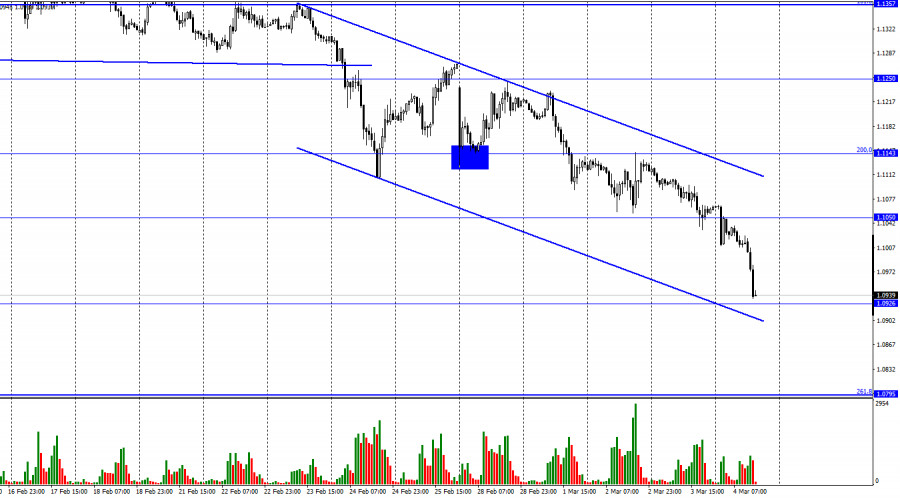
EUR/USD has been falling non-stop to the levels last seen in June 2020 in the area of 1.0964. The fall of EUR/USD below the psychological mark of 1.1000, today on Friday, is due to the concerns about the Russian invasion of Ukraine. This is the centerpiece of the political debate. In an increasingly deteriorated geopolitical scenario, the Euro could tumble towards the 1.0864 zone of -2/8 Murray in the short term, but first we expect a technical rebound. On the other hand, the dollar index (USDX) reached new highs above 98.50, always supported by growing risk aversion in a framework where tensions due to the military conflict in Ukraine continue to increase. US NonFarm Payrolls will be released in the next few hours. EUR is likely to reach the key level of 1.0925 -1.0900, the zone of -1/8 Murray. The nonfarm payrolls are expected to increase by 400,000 and the unemployment rate to drop to 3.9%. If this data is worse than expected, it would be negative for the US dollar, but the euro could recover part of its losses and reach the psychological level of 1.1000. According to the daily chart, the Euro is trading below 0/8 Murray and approaching -1/8 Murray at around 1.0925. We can also see a downtrend channel that has formed since February 10th. The euro could find strong support at 1.0920 or 1.0864 and it will be an opportunity to buy during a technical bounce, with targets at 1.0986 and continue buying over the next few days to 1.1230. Support and Resistance Levels for March 04- 07, 2022 Resistance (3) 1.1073 Resistance (2) 1.1025 Resistance (1) 1.0970 ---------------------------- Support (1) 1.0925 Support (2) 1.0864 Support (3) 1.0836 *********************************************************** Scenario Timeframe H4 Recommendation: buy above Entry Point 1.0920 Take Profit 1.0985; 1.1084 Stop Loss 1.0860 Murray Levels 1.0925(-1/8), 1.0985(0/8) 1.1047(1/8), 1.1108(2/8) *************************************************************************** The material has been provided by InstaForex Company - www.instaforex.com |
| Posted: 04 Mar 2022 06:19 AM PST
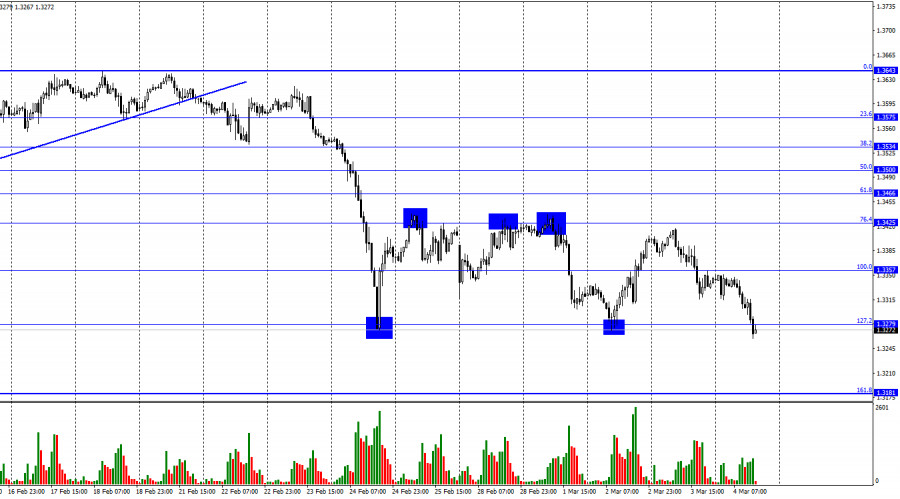
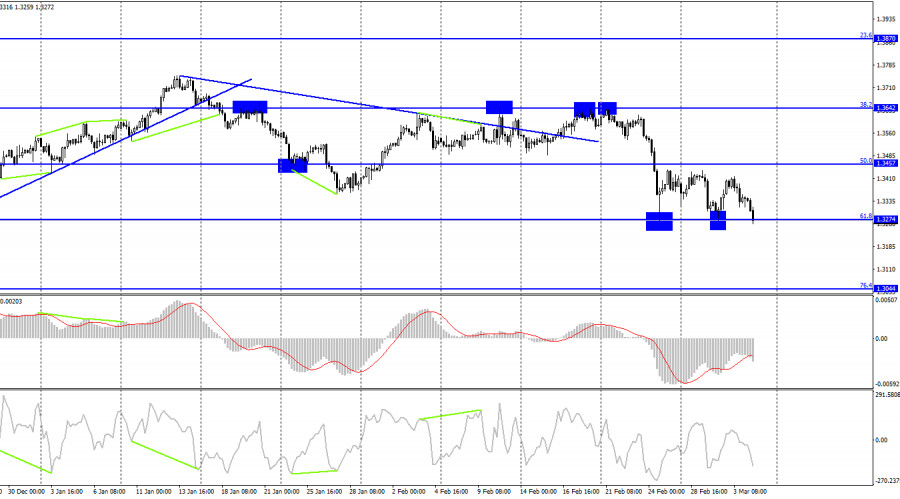
Hi, dear traders! According to the H1 chart, GBP/USD continued to go down on Thursday without any upward corrections. The pair closed below the retracement levels of 100.0% (1.3357) and 127.2% (1.3279). At this point, it could decline toward the Fibonacci level of 161.8% (1.3181). Today, US non-farm payrolls were released. The data greatly exceeded market expectations – the US economy added 678,000 new jobs in February. Economists expected that only 350,000-400,000 new jobs would be created. The previous month's data was revised upwards to 481,000. Unemployment fell to 3.8% from 4%. Average hourly earnings did not match expectations, but they are not as important as non-farm payrolls. These strong data releases can send the pair into a slump and boost the US dollar. However, the initial reaction of traders to this batch of data was muted, as GBP was already sliding down throughout the day, while USD was going up. The pair's further downward movement may be not as significant as it could have been before. The US dollar also found strong support in the ongoing international situation. The war between Russia and Ukraine shows no signs of stopping. The second round of negotiations between the two sides has failed to produce any results, just like the first one. The third round of negotiations is set to begin next week, with both Russia and Ukraine have drastically different positions. Some progress has been made – there are hopes that it would help stop the war and sanctions against Russia, as well as reverse the nosediving world markets upwards. However, de-escalation seems very unlikely, as new sanctions are being imposed on Moscow. Furthermore, the Kremlin could declare martial law in Russia in the near future.
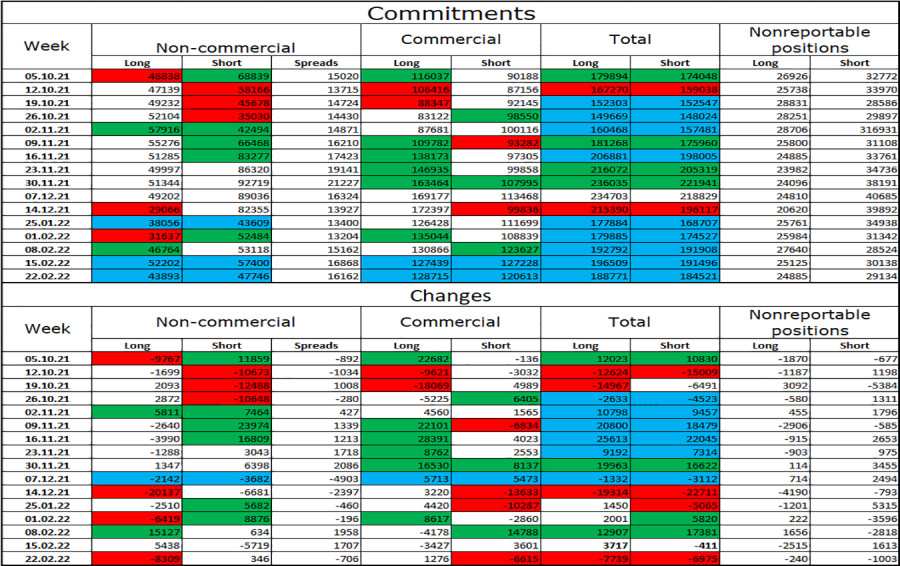
According to the H4 chart, the pair dived below the retracement level of 61.8% (1.3274). It could close below it tonight, which would open the way towards the next Fibo level of 76.4% (1.3044). There are no emerging divergences today. However, at this point, they are not as important to traders as geopolitical factors. If GBP/USD bounces off 1.3274, it would rise up slightly. Commitments of Traders (COT) report:
The mood of "Non-commercial" traders changed sharply once again during the week covered by the report. 8,309 Long positions were closed, and 346 Short positions were opened, indicating an increasingly bearish sentiment among traders. However, the mood of traders could be called "neutral" – the total number of open Long and Short contracts is roughly the same among most categories of traders. At this point, the sentiment of traders can fluctuate rapidly due to geopolitical factors. US and UK economic calendar: UK – construction PMI (09-30 UTC). US – unemployment data (13-30 UTC). US – non-farm payrolls (13-30 UTC). US - average hourly earnings (13-30 UTC). Traders have ignored UK's construction PMI data. Strong data releases in the US are giving support to USD. However, the US dollar's upsurge could continue even without it. Outlook for GBP/USD: Traders are recommended to open short positions targeting 1.3181 – the pair has closed below 1.3279. Most factors favor the dollar – opening long positions is not recommended today. The material has been provided by InstaForex Company - www.instaforex.com |
| The euro is falling rapidly on March 4 Posted: 04 Mar 2022 06:09 AM PST
EURUSD daily chart. This is a fairly strong drop in terms of the daily chart. This fall is visible on the weekly chart. Reasons? There are two of them. First, the euro is falling on the continuation of the military conflict in Ukraine, initiated by Russia. Second, the Nonfarm came out +678K. Employment in the US grew much higher than forecasts in February. And this, in turn, is a strong argument for a sharp increase in the Fed rate on March 16. The purpose of the fall? The first target is 1.0800. The material has been provided by InstaForex Company - www.instaforex.com |
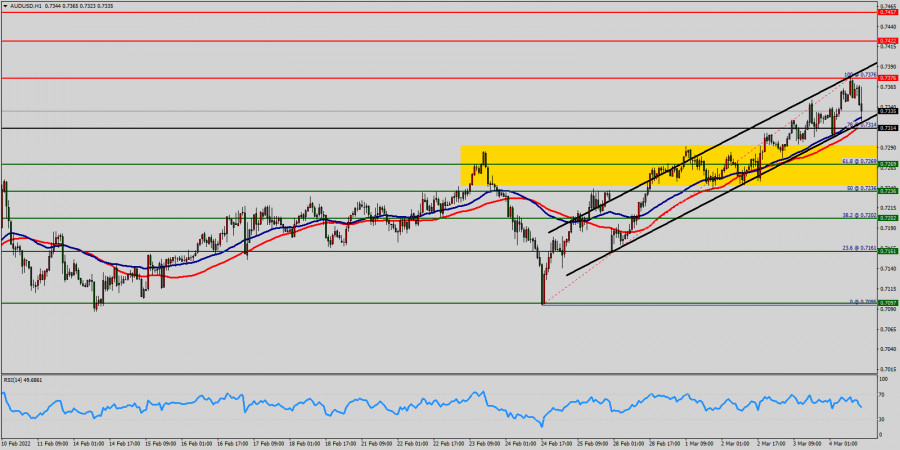
| Technical analysis of AUD/USD for March 04, 2022 Posted: 04 Mar 2022 06:00 AM PST
The AUD/USD pair fell from the level of 0.7376 to bottom at 0.7314. Today, theAUD/USD pair has faced strong support at the level of 0.7300. So, the strong support has been already faced at the level of 0.7300 and the pair is likely to try to approach it in order to test it again and form a double bottom. Hence, the AUD/USD pair is continuing to trade in a bullish trend from the new support level of 0.7300; to form a bullish channel. According to the previous events, we expect the pair to move between 0.7300 and 0.7422. Also, it should be noted major resistance is seen at 0.7422, while immediate resistance is found at 0.7376. Then, we may anticipate potential testing of 0.7376 to take place soon. Moreover, if the pair succeeds in passing through the level of 0.7376, the market will indicate a bullish opportunity above the level of 0.7376. A breakout of that target will move the pair further upwards to 0.7422. Buy orders are recommended above the area of 0.7314 with the first target at the level of 0.7376; and continue towards 0.7422. On the other hand, if the AUD/USD pair fails to break out through the resistance level of 0.7376; the market will decline further to the level of 0.7269 (daily support 2). The material has been provided by InstaForex Company - www.instaforex.com |
| EUR/USD on March 4. Euro continues to decline Posted: 04 Mar 2022 05:55 AM PST
Hello, dear traders! On Thursday, the EUR/USD pair continued its decline, which started several days ago. No significant statistics were released tonight and this morning. Besides, despite the lack of strong geopolitical factors (Ukraine's issue is still complicated), traders continued selling the euro. Consequently, the pair fell to 1.0926. Moreover, the US Nonfarm payrolls report will be released today. This report may have a strong impact on traders' sentiment. However, I do not know the actual figures yet. The rebound of the quotes from 1.0926 may support the European currency and stimulate its growth towards 1.1050. If the US Nonfarm payrolls report is weak, two factors may favour the euro's growth on Friday afternoon. Moreover, Jerome Powell's speech was not significant for the dollar. The Fed president said twice that his office would not rush to raise the interest rate despite the fact that US inflation continues to accelerate. Therefore, his tone was not as hawkish as traders might have expected. However, the dollar continues to rise. Powell also noted that Ukraine's issue posed additional risks for both the global and the US economies. Therefore, the Fed will have to calculate these risks when formulating monetary policy. Thus, while addressing the subject of the Fed and Jerome Powell, Ukraine's geopolitical tensions are indicated. Taking these facts into account, I believe that geopolitics will continue to significantly affect traders' sentiment for the next few weeks or even longer. On the 4-hour chart, the pair consolidated below the sideways corridor. Therefore, a new decline towards the next correction level of 200.0% at 1.0865 is likely. The bullish divergence, formed yesterday, was cancelled. There are no emerging divergences on the current chart. So far, I cannot give any reasons for the pair's growth except the payrolls report. COT report:
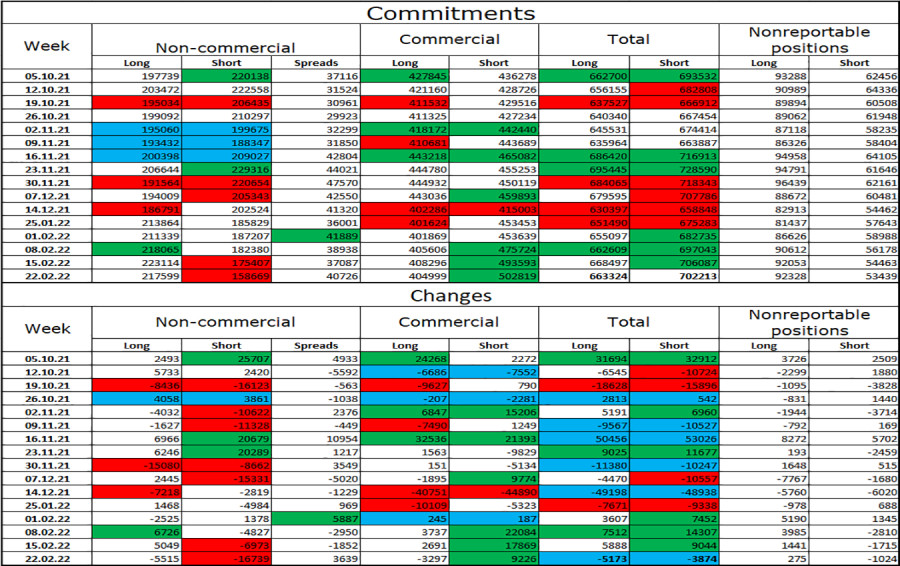
Speculators closed 5,515 long contracts and 1,739 short contracts during last reporting week. This fact indicates that the bullish sentiment has increased. The total number of long contracts held by speculators currently is 217,000, while the number of short contracts amounts to 158,000. Thus, non-commercial traders' sentiment is also considered bullish. This aspect provides a chance for the European currency to grow. However, the current news background is more favourable to the US currency. I think that the COT report data is insignificant now as the global geopolitical situation is tense and the sentiment of major players can change drastically. US and the EU economic news calendar: EU - Change in volume of retail sales(10-00 UTC). US - Unemployment rate (13-30 UTC). US - Changes in Nonfarm payrolls (13-30 UTC). US - Changes in average hourly earnings (13-30 UTC). On March 4, the EU economic calendar contains one report released in the morning. Retail sales for January were stronger. However, they did not increase as much as traders had expected. Moreover, the most significant US reports will be released today. They may have a profound impact on traders' sentiment. EUR/USD outlook and recommendations to traders: I recommended selling the pair with the targets of 1.0926 and 1.0850 if the closing below the sideways corridor is performed on the 4-hour chart. It was possible to achieve the first target. Currently, the US Nonfarm payrolls report may affect traders's sentiment. I recommend buying the pair if the rebound from 1.0926 with the target 1.1050 is carried out on the hourly chart . The material has been provided by InstaForex Company - www.instaforex.com |
| Posted: 04 Mar 2022 05:50 AM PST Gold price is trading around $1,945. Short-term trend remains bullish. Gold price continues to trade above key support trend lines making higher highs and higher lows. However despite Dollar strength, Gold price does not move to new higher highs.
After the huge spike at $1,973, Gold price pulled back towards the support trend line and is now slowly but steadily moving higher. Short-term trend remains bullish and as long as price holds above support at $1,920, bulls will remain in control of the trend. If Gold price fails to hold above the support, we should see a test of $1,900-$1,880 area at least. The material has been provided by InstaForex Company - www.instaforex.com |
| Technical analysis of GBP/USD for March 04, 2022 Posted: 04 Mar 2022 05:47 AM PST
Pair : GBP/USD : The past 4 days had been a blast for US dollar against pound, after dropping to the bottom of the trading range between 1.3292 and 1.3254. The Relative Strength Index (RSI) is considered oversold because it is below 30. There is an apparent divergence between the price and the RSI on the 15M time frame. Additionally, the RSI is still calling for a strong bearish market as well as the current price is also below the moving average 100 and 50. The GBP/USD pair has broken support at the level of 1.3292 which acts as resistance now. Thus, the pair has already formed minor resistance at 1.3292.The strong resistance is seen at the level of 1.3316 because it represents the weekly support 1. However, if the pair fails to pass through the level of 1.3292, the market will indicate a bearish opportunity below the new strong resistance level of 1.3292 (the level of 1.3292 coincides with a ratio of 23.6.8% Fibonacci). Thus, the market is indicating a bearish opportunity below 1.3292 so it will be good to sell at 1.3292 or/and 1.3255 with the first target of 1.3230. It will also call for a downtrend in order to continue towards 1.3211. The daily strong support is seen at 1.3211. The GBP/USD pair breaks through the support level of 1.3211, a further decline to 1.3150 can occur which would indicate a bearish market. We don't think that the trend will know a reversal today, in overall, we still prefer the bearish scenario. The material has been provided by InstaForex Company - www.instaforex.com |
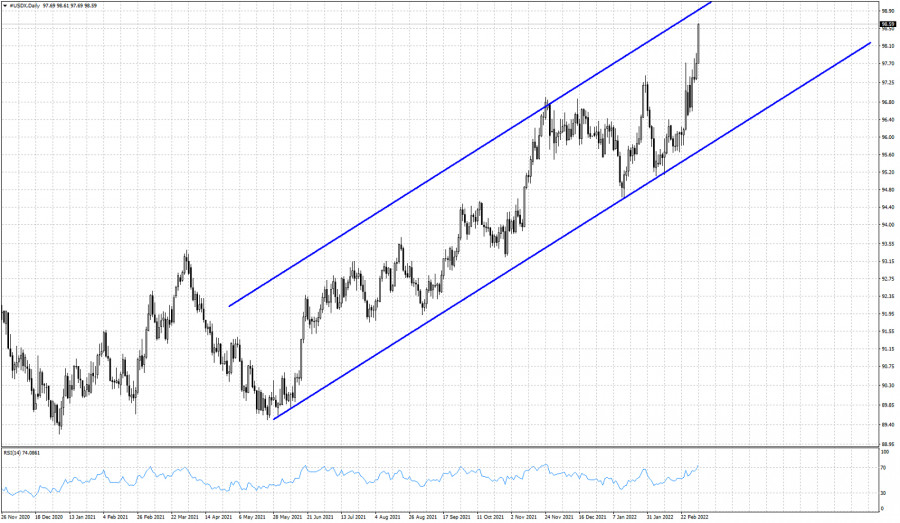
| New highs for the Dollar index. Posted: 04 Mar 2022 05:47 AM PST The Dollar index is making new weekly highs. Price remains inside the medium-term bullish channel and is now approaching the upper channel boundary. On a weekly basis the RSI is not making new highs providing a bearish divergence. Traders need to be very cautious.
The last time price was challenging the lower channel boundary, we mentioned that as long as price respects the channel boundaries, bulls remain in control of the trend. Price has now exploded to new weekly highs and although there is no sign of a reversal, at current levels we prefer to take partial profits in open long Dollar positions. Current market conditions justify a reversal if not a major top to be seen in the Dollar index chart. Traders need to be very cautious and bulls must protect their gains. The material has been provided by InstaForex Company - www.instaforex.com |
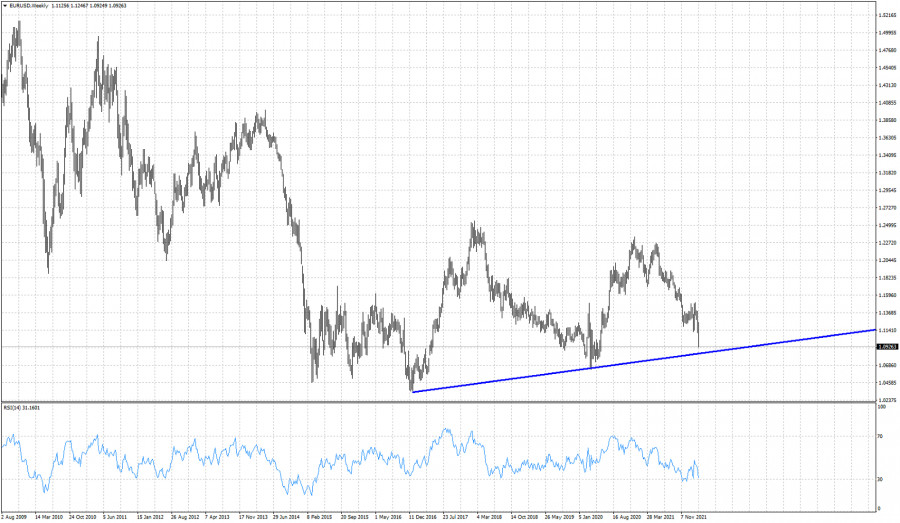
| Posted: 04 Mar 2022 05:43 AM PST EURUSD is trading close to 1.09. Price has broken below our latest target at 1.10 where the 78.6% Fibonacci retracement was found. EURUSD is in a capitulation phase now. Price is approaching the 2017-2021 trend line.
EURUSD is making new weekly lows. Price is under pressure and approaches the major support trend line. This support is at 1.0850. The weekly RSI is not making new lows yet. Will we see another bullish divergence? Most probably, but until price shows a reversal signal, traders need to be patient. EURUSD capitulation phase could complete over the next couple of sessions. The material has been provided by InstaForex Company - www.instaforex.com |
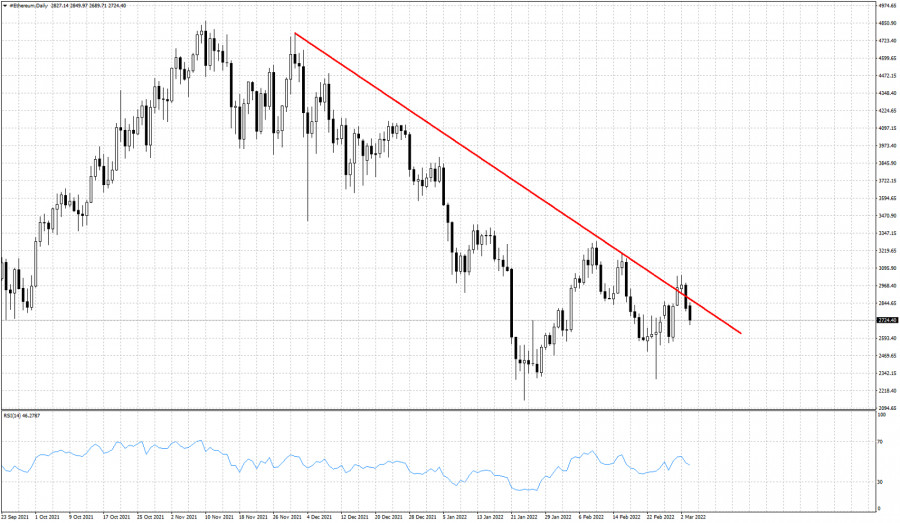
| Ethereum rejected at trend line resistnace. Posted: 04 Mar 2022 05:38 AM PST Ethereum is trading below $2,800 again after reaching as high as $3,044. Bulls were unable to hold price above $3,000. Holding above $3,000 was key for bulls, but they were unable to do it. The rejection at the resistance trend line was a bearish sign.
Ethereum continues to trade below the resistance trend line. As long as this is the case, bears remain in control of the trend. The red downward sloping resistance trend line is key for the short-term trend. This resistance is at $2,900. Bulls need to recapture this level and stay above it. A move above $3,050 would be a bullish sign and the start of a formation of higher highs and higher lows. Until then bulls need to be patient. The material has been provided by InstaForex Company - www.instaforex.com |
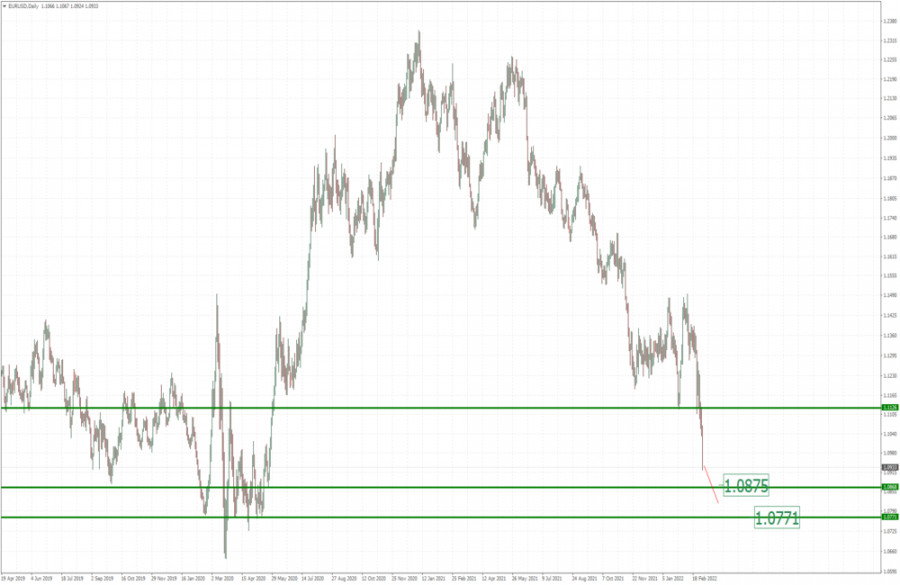
| EUR/USD analysis for March 04, 2022 - Strong downside momentum Posted: 04 Mar 2022 05:34 AM PST Technical analysis:
EUR/USD has been trading strongly downside, I see potential for the downside continuation with potential for test of 1,0780. Trading recommendation: Due to strong momentum and down cycle, I see potential for the downside continuation. Watch for selling opportunities on the rallies using the intraday time-frames. Watch for continuation al patterns... Downside objectives are set at the price of 1,0875 and 1,0770 The material has been provided by InstaForex Company - www.instaforex.com |
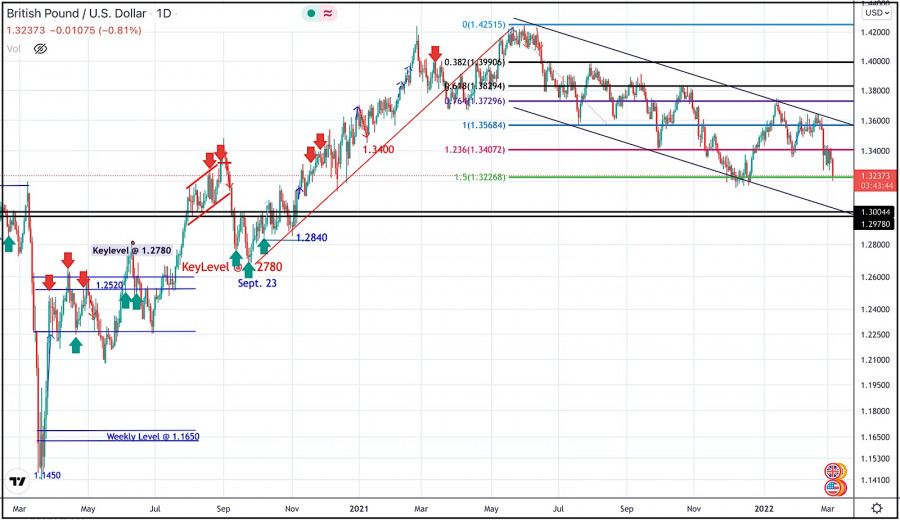
 The GBPUSD pair has been moving within the depicted bearish channel since July.
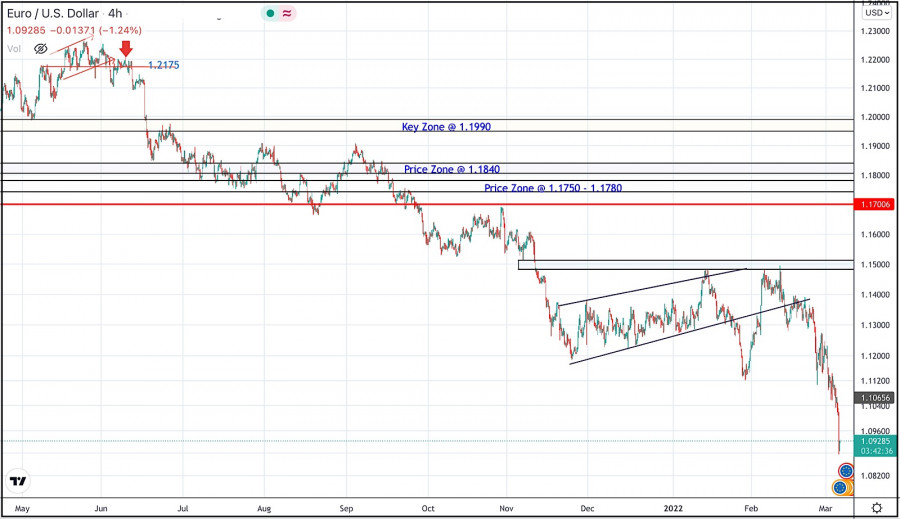 During the past few weeks, the EURUSD pair has been trapped within a consolidation range between the price levels of 1.1700 and 1.1900.
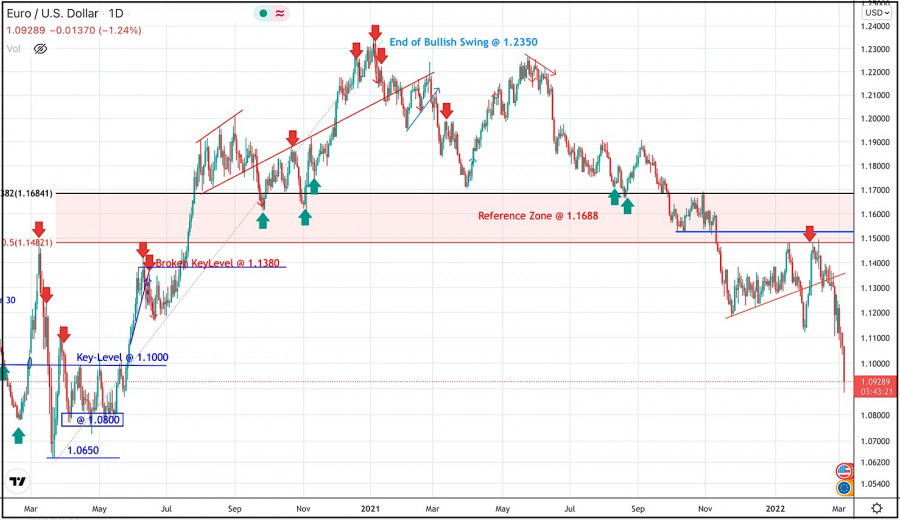
| You are subscribed to email updates from Forex analysis review. To stop receiving these emails, you may unsubscribe now. | Email delivery powered by Google |
| Google, 1600 Amphitheatre Parkway, Mountain View, CA 94043, United States | |


Comments