Forex analysis review
Forex analysis review |
- EUR/USD. Trading in conditions of geopolitical uncertainty: the pair has formed a price range
- Stock Europe closed lower in yesterday's trading
- A looming supply shock for crude oil drives crude prices up
- Technical analysis of GBP/USD for March 24, 2022
- Technical analysis of EUR/USD for March 24, 2022
- March 24, 2021 : EUR/USD daily technical review and trading opportunities.
- March 24, 2021 : EUR/USD Intraday technical analysis and trading plan.
- March 24, 2021 : GBP/USD Intraday technical analysis and significant key-levels.
- How to trade the EUR/USD currency pair on March 25? Simple tips and analysis of deals for beginners.
- Analysis of GBP/USD on March 24. British and American statistics: neither positive nor negative
- The UK FCA has a tough policy against cryptocurrency companies
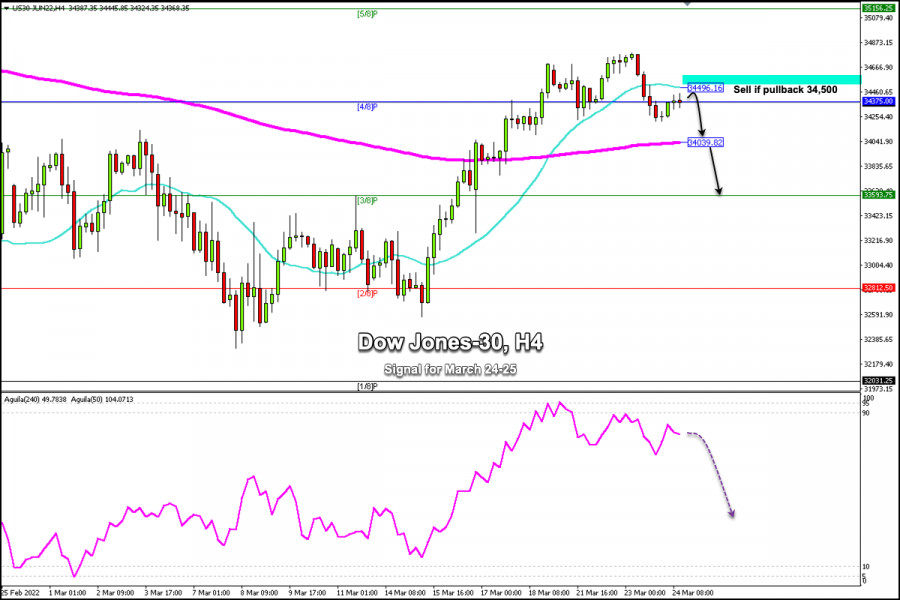
- Trading signal for Dow Jones-30 for March 24 - 25, 2022: sell in case of pullback at 34,500 (4/8 Murray - SMA 21)
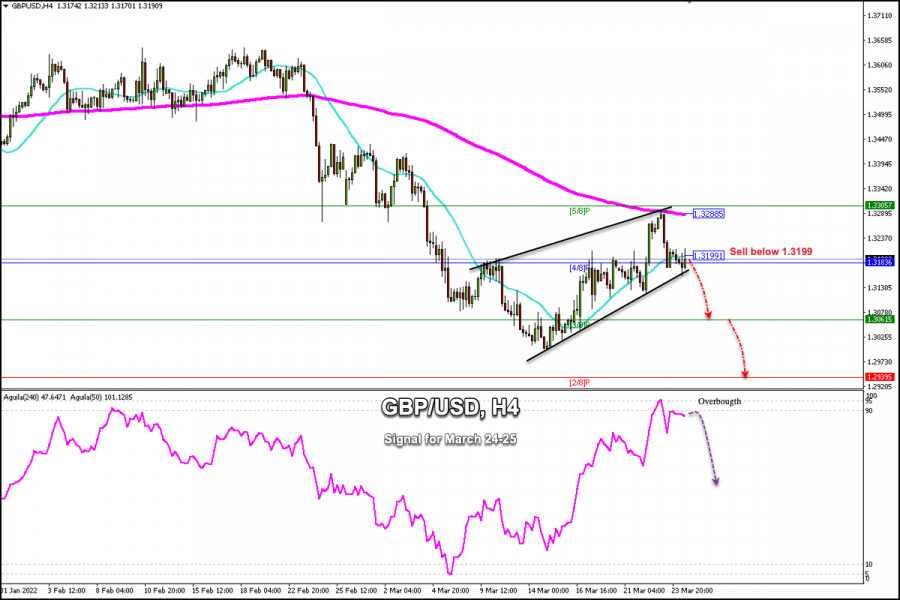
- Trading signal for GBP/USD for March 24 - 25, 2022: sell below 1.3199 (4/8 Murray - SMA 21)
- GBP/USD forecast on 24 March, 2022
- EUR/USD forecast on 24 March, 2022
- Trading signal for Gold (XAU/USD) for March 24 - 25, 2022: buy above $1,945 (7/8 Murray - symmetrical triangle)
- Trading plan for Gold for March 24, 2022
- NZDUSD: Overbought and vulnerable to a pull back.
- Short-term technical analysis on Gold for March 24, 2022.
- EURUSD under pressure below 1.10.
- Trading plan for USDJPY for March 24, 2022
- Trading plan for Ethereum for March 24, 2022
- Solana breaks out of wedge pattern providing bullish signal.
- Bitcoin's correlation with S&P sets new record, BlackRock predicts massive BTC adoption
- Video market update for March 24,,2022
| EUR/USD. Trading in conditions of geopolitical uncertainty: the pair has formed a price range Posted: 24 Mar 2022 02:26 PM PDT The euro-dollar pair, apparently, has formed a price range within which it is trading, demonstrating wave-like movements. The upper limit of this echelon corresponds to the 1.1050 mark (the middle line of the Bollinger Bands indicator on the daily chart), and the lower one corresponds to the 1.0960 mark. Over the past few days, the pair has been "walking" within this almost 100-point range, reacting primarily to the external fundamental background. Macroeconomic fundamentals are secondary, as are the comments of the Federal Reserve and European Central Bank representatives. On the one hand, traders do not ignore the most important reports or statements of central bank officials, but on the other hand, geopolitics always takes priority. Therefore, price movements within the day are unpredictable - the dollar responds impulsively to the rapidly changing news flow. At the same time, neither bears nor bulls of EUR/USD risk opening large positions, given the general uncertainty. Therefore, intraday volatility "fits" within the above-mentioned almost 100-point price range. Of course, price impulses may go beyond this echelon, but while the market is under the yoke of geopolitical uncertainty, traders are unlikely to risk organizing a large-scale offensive - both to the upside and to the downside.
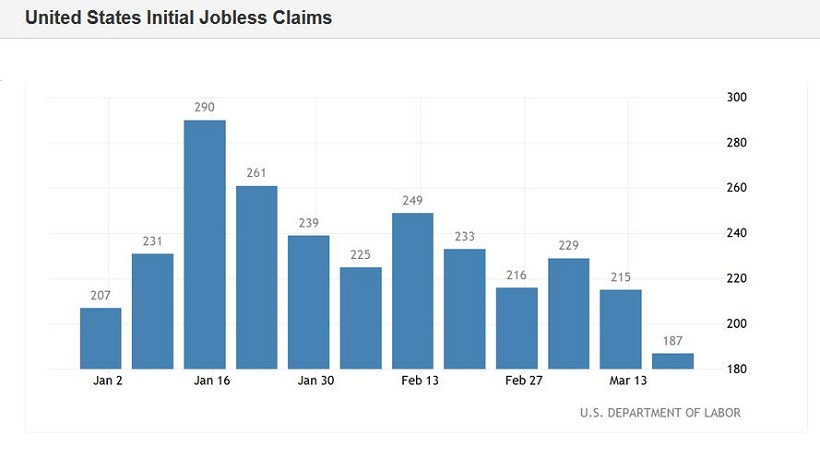
In general, traders have to put up with the information vacuum that has formed around the negotiation process between Russia and Ukraine. The details of the negotiations are not disclosed for obvious reasons, and the comments voiced by the representatives of the delegations are sketchy and uninformative. The very fact of negotiations allows EUR/USD bulls to "stay afloat", since in the vast majority of cases such dialogues end with the conclusion of a compromise agreement. But on the other side of the scale is the lack of any information about the dynamics of the negotiation process, and, in fact, its prolonged duration. This is already an argument in favor of the US currency, which continues to be in high demand as a protective tool. It should also be noted that in recent days the market has focused its attention on several other fundamental factors - also of a geopolitical nature. We are talking about the visit of US President Joe Biden to Europe and Poland's proposal to organize a "NATO peacekeeping contingent." These information flows have strengthened the anti-risk sentiment in the market, as they have increased the risks of escalation of the situation in Eastern Europe. The euro-dollar pair reacted accordingly, dropping to the lower limit of the above price range (intraday low - 1.0966). However, subsequent statements lowered the heat, allowing EUR/USD bulls to go on the counterattack again. In particular, NATO Secretary General Jens Stoltenberg said today that the Alliance will not deploy troops on the territory of Ukraine to avoid further escalation. This is how he commented to journalists on Poland's proposal to send a NATO peacekeeping mission. After these words, the EUR/USD pair once again turned 180 degrees and returned to the borders of the 10th figure. However, the upward momentum also did not continue. This suggests that traders are not ready for large-scale offensive actions, both towards the downside and towards the upside. Price impulses fade away as soon as they begin. As for the release of macroeconomic reports, there is complete apathy here. For example, today EUR/USD traders ignored the March PMI indices. Almost all of them came out (surprisingly) in the green zone, although they reflected a slight decrease relative to February. However, most experts expected a deeper decline - both in the service sector and in the manufacturing sector (and especially in the manufacturing sector). For example, the German index of business activity in the manufacturing sector in March came out at 57.6 points (in February it was at 58.4), while analysts predicted a decline to 55 points. A similar trend was demonstrated by the pan-European index of business activity in the manufacturing sector. By the way, US macroeconomic reports also came out in the green zone today, which did not prevent the dollar from weakening throughout the market in the afternoon. For example, the growth rate of initial applications for unemployment benefits today came out at around 187,000. This is the least weekly increase in this indicator. In turn, the index of business activity in the US manufacturing sector jumped to 58.5 points in March. This is the best result since September 2021.
However, all the above reports were ignored by the market. The pair reacts only to geopolitical fundamental factors, which are difficult to predict a priori. The hawkish comments of the Fed representatives (Powell, Waller, Barkin, Bullard) are also of secondary importance now: almost all Fed officials admit the option of a more aggressive tightening of monetary policy, but only when the geopolitical situation stabilizes. All this suggests that in the medium term, the EUR/USD pair will continue to fluctuate within the 1.1050-1.0960 price range, reacting impulsively to the external fundamental background. In such conditions, it is most expedient to take a wait-and-see position, or to open trading orders from the borders of the above echelon - in the event that, when approaching its borders, the momentum will show signs of fading. The material has been provided by InstaForex Company - www.instaforex.com |
| Stock Europe closed lower in yesterday's trading Posted: 24 Mar 2022 02:26 PM PDT
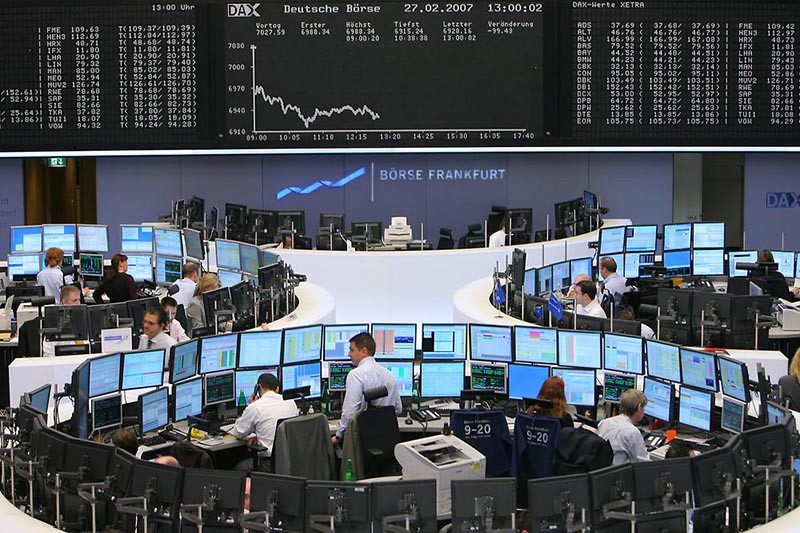
Stock Europe closed lower in yesterday's trading. Thus, the composite indicator of the STOXX Europe 600 region lost 1%, although it had previously shown growth for five consecutive trading sessions. The German DAX indicator fell by 1.3%, the French CAC 40 – by 1.2%, the Italian FTSE MIB – by 1%, and the Spanish IBEX 35 - by 2%. The FTSE 100 indicator in the UK lost less than others, falling by only 0.2%. The main reasons for investors' concern remain global rising inflation, as well as a significant rise in the price of energy resources, and the second is the reason for the first. The reason for this is the unstable geopolitical situation and the excess of demand over supply. To combat accelerating inflation, the central banks of European countries are forced to resort to tougher monetary regulation measures. At the same time, such a sharp transition from a stimulating to a more stringent policy may lead to a slowdown in economic growth. Investors are waiting for the results of the US president's visit to Europe to participate in the G7 and NATO summits, as well as a speech at a meeting of the European Council. As a result of the above-mentioned measures, a decision may be made to introduce a new package of sanctions against Russia. In the UK, consumer price growth last month was 6.2% year-on-year, compared with the January figure of 5.5%. This is a record figure for the last 30 years. According to experts' expectations, its growth should have been 5.9%. On a monthly basis, inflation increased by 0.8% compared to the January figure of -0.1%. Among the components of the STOXX 600 indicator, the largest decrease in the value of securities was shown by Auto1 Group SE (-12.1%), Zur Rose Group AG, (-9%), Verbund AG (-6.6%), as well as Delivery Hero SE (-6.3%). Car manufacturer Stellantis has announced an upcoming major deal to create a joint venture with LG Energy Solution and build a battery plant in Canada with a total value of $4.1 billion. Also, an agreement has already been concluded with Termoli for the supply of batteries. However, even such good news could not positively affect the stock prices of Stellantis, which declined by 1.5%. Thanks to Leonardo's announcement of the planned sale of the Global Enterprise Solutions division in the amount of $450 million, the value of the company's securities increased by 2.7%. Despite the successful placement of bonds by L'Oreal with a total value of 3 billion euros, the stock prices fell by 1.7%. Due to the rapid increase in the cost of oil, the securities of BP and Shell companies rose by 4.5% and 4%. The material has been provided by InstaForex Company - www.instaforex.com |
| A looming supply shock for crude oil drives crude prices up Posted: 24 Mar 2022 02:26 PM PDT
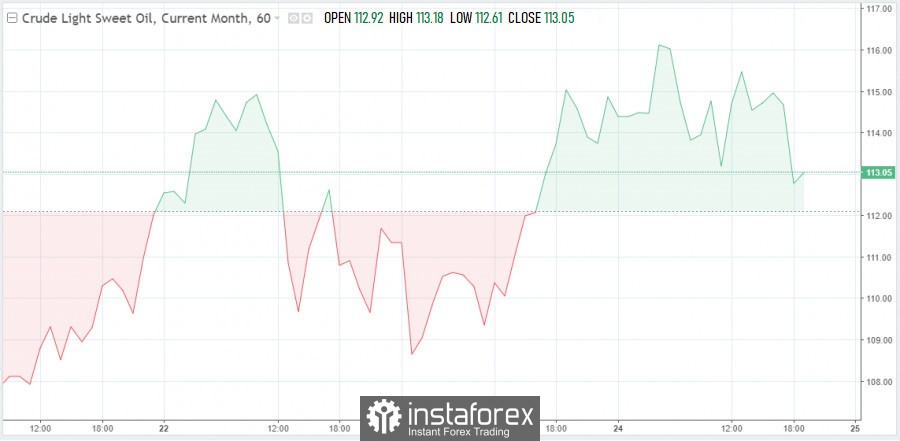
Oil is getting more expensive on Thursday afternoon after a slight morning decline in value. Thus, the price of May futures for Brent crude oil at the time of preparation of the material rose by 0.3% to $121.95 per barrel. The price of May WTI futures rose by 0.04% to $113.05. The price of oil is rising on fears of a supply shortage. The latest data of the US Department of Energy on oil reserves in the country unpleasantly surprised the market. It turned out that commercial stocks for the past week unexpectedly decreased by as much as 2.5 million barrels, despite the fact that analysts had predicted an increase in stocks by 0.1 million barrels. The oil market has been going through a real shock in recent weeks, as the EU countries have spoken out against the purchase of Russian energy carriers, including oil. US President Joe Biden announced a ban on the import of oil, gas and coal from Russia to the country. Following him, the UK government announced that it intends to gradually replace imports of Russian oil and petroleum products by the end of this year. The EU countries have also announced their intention to abandon Russian oil and have already provided a plan to reduce their dependence on all Russian energy carriers. In response to these unprecedented measures, Russia warned that if such a ban is implemented by the above-mentioned countries, any Russian gas supplies to Europe will stop. For Europe, this could be a real failure in the confrontation with Russia in the energy sphere, because it is too dependent on gas supplies from Russia and it will not be able to replace this raw material in the near future, no matter how much it wants to. Russia currently ranks third in the world in oil production, the first place belongs to the United States, the second – to Saudi Arabia. On average, Russia exports a little more than 4.5 million barrels of oil per day, and more than half of this volume goes to Europe. The United States can well afford to challenge Russia, because they are much less dependent on its oil. So, in 2020, Russia imported only 3% of the total volume of oil supplied to other countries to the United States. It's the same story with Russian gas. Gazprom exported at least 185 billion cubic meters of gas abroad in 2021. In the European Union, Russia accounts for about 40% of the total volume of imported natural gas. If Russia suddenly stops gas supplies, Italy and Germany will suffer enormous damage, since today they have almost no alternatives to Russian blue fuel. It is worth noting that the United Kingdom is still less dependent on Russian energy carriers than many European countries. But it is worth recognizing that this dependence, although small, is there. So, in Britain, Russian supplies account for 8% of the total volume, and Russian diesel fuel – all 18%. Due to the intentions of Western European countries to boycott Russia, some of the world's most respected oil traders expect that this year the price of black gold has every chance to rise above $200 per barrel. For example, Pierre Andurand, who is a popular hedge fund manager in the oil sector, unexpectedly said at the FT Commodities global summit in Lausanne that after the announced intentions of Western countries, it will not be possible to return to normal work, at least in the coming months. Moreover, Andurand is sure that the European side is forever losing Russian supplies. Taking into account this impending restructuring, the current year can demonstrate oil to everyone at $250 per barrel. Other veteran oil specialists who spoke at the same conference also agreed that Russian oil and petroleum products will remain inaccessible to the European market in the near future. Doug King, head of the Merchant Commodity Fund RCMA, is also confident that oil will rise to $200-250 per barrel this year and this will not be a temporary phenomenon, but a real shock to the supply of crude oil.
|
| Technical analysis of GBP/USD for March 24, 2022 Posted: 24 Mar 2022 02:05 PM PDT
The GBP/USD pair continued moving upwards from the level of 1.3149. The pair rose from the level of 1.3149 (weekly support) to the top around 1.3184. Today, the first support level is seen at 1.3149 followed by 1.3114, while daily resistance is seen at 1.3232. According to the previous events, the GBP/USD pair is still moving between the levels of 1.3149 and 1.3232; for that we expect a range of 83 pips in coming hours. This would suggest a bullish market because the RSI indicator is still in a positive area and does not show any trend-reversal signs. Furthermore, if the trend is able to break out through the first resistance level of 1.3232, we should see the pair climbing towards the new double top (1.3298) to test it. On the contrary, if a breakout takes place at the support level of 1.3114, then this scenario may become invalidated. Remember to place a stop loss; it should be set below the second support of 1.3114. The material has been provided by InstaForex Company - www.instaforex.com |
| Technical analysis of EUR/USD for March 24, 2022 Posted: 24 Mar 2022 01:54 PM PDT
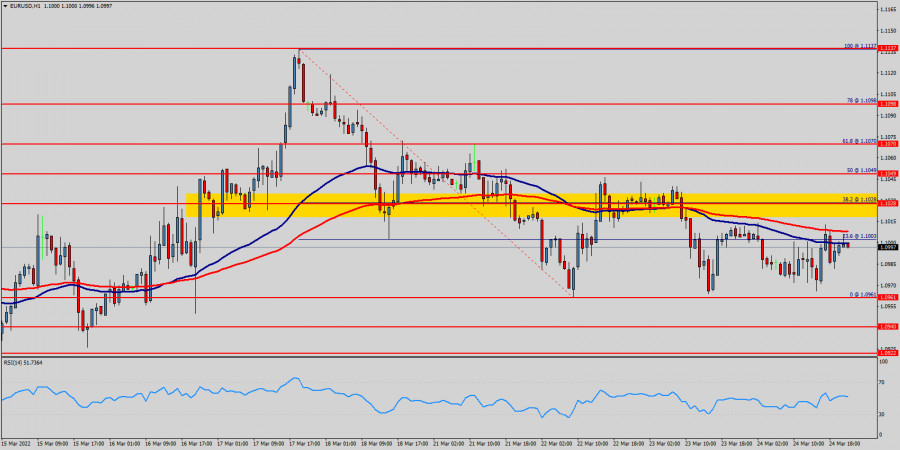
The EUR/USD pair is closing below the Pivot Point (1.1028) could assure that EUR/USD will move lower towards cooling new lows. The bears must break through 1.0960 in order to resume the downtrend - increased within an down channel. If the pair fails to pass through the level of 1.1028, the market will indicate a bearish opportunity below the strong resistance level of 1.1028. In this regard, sell deals are recommended lower than the 1.1028 level with the first target at 1.0960. The trend is still calling for a strong bearish market from the spot of 1.1028 because the sellers are asking for a high price. Moreover, the RSI is becoming to signal a downward trend, as the trend is still showing strong below the moving average (100) and (50). It is possible that the pair will turn downwards continuing the development of the bearish trend to the levels 1.0940. On the downside, the 1.0940 level represents support. The next major support is located near the $ 1.0922, which the price may drift below towards the 1.0922 support region. However, stop loss has always been in consideration thus it will be useful to set it above the last double top at the level of 1.1137 (notice that the major resistance today has set at 1.1137). The material has been provided by InstaForex Company - www.instaforex.com |
| March 24, 2021 : EUR/USD daily technical review and trading opportunities. Posted: 24 Mar 2022 12:23 PM PDT
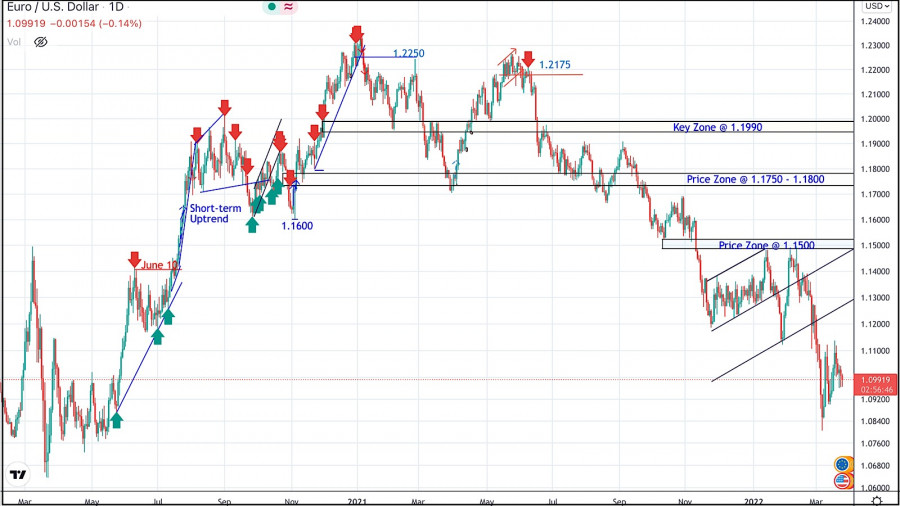
During the past few weeks, the EURUSD pair has been trapped within a consolidation range between the price levels of 1.1700 and 1.1900. In late September, Re-closure below the price level of 1.1700 has initiated another downside movement towards 1.1540. Price levels around 1.1700 managed to hold prices for a short period of time before another price decline towards 1.1200. Since then, the EURUSD has been moving-up within the depicted movement channel until bearish breakout occurred by the end of last week's consolidations. Few weeks ago, the price zone of 1.1350 failed to offer sufficient bearish rejection that's why it was bypassed until 1.1500 which applied significant bearish pressure on the pair. A possible SELL Entry was offered upon the previous ascending movement towards 1.1500 which provided significant bearish pressure. Shortly after, the EURUSD looked oversold while approaching the price levels of 1.0850. That's where the current upside movement was initiated. Any movement towards 1.1200 should be considered for another SELL trade as long as sufficient SELLING pressure is demonstrated. The material has been provided by InstaForex Company - www.instaforex.com |
| March 24, 2021 : EUR/USD Intraday technical analysis and trading plan. Posted: 24 Mar 2022 11:10 AM PDT
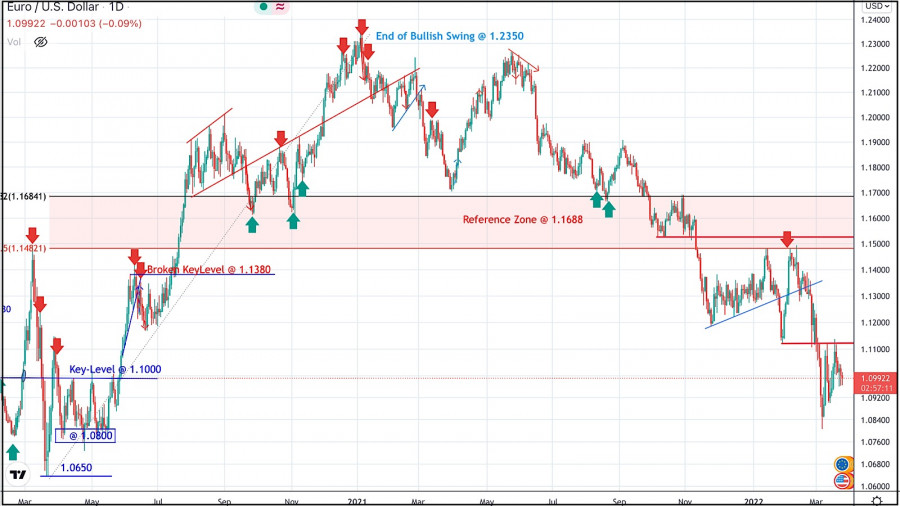
Recent bullish pullback towards 1.1650-1.1680 (upper limit of the previous consolidation range) was expected to offer bearish rejection and a valid SELL Entry. Significant bearish decline brought the EURUSD pair again towards 1.1550 levels which failed to provide sufficient BUYERS for too long period. Hence, only a short- term sideway movement was demonstrated around 1.1550 before quick bearish decline could occur towards 1.1200. On the other hand, the price levels around 1.1520 stood as a reference zone that applied significant bearish pressure upon two successive bullish visits. Recent Bearish decline below 1.1100 was considered as a bearish continuation sign. That's why, downside movement was expected to proceed towards 1.1000 then 1.0920 where the current bullish pullback was initiated. The price levels around 1.1100 should be watched upon any upcoming bullish move for bearish rejection and a possible SELL Entry. However, failure to do so will probably enable more bullish advancement towards 1.1320. The material has been provided by InstaForex Company - www.instaforex.com |
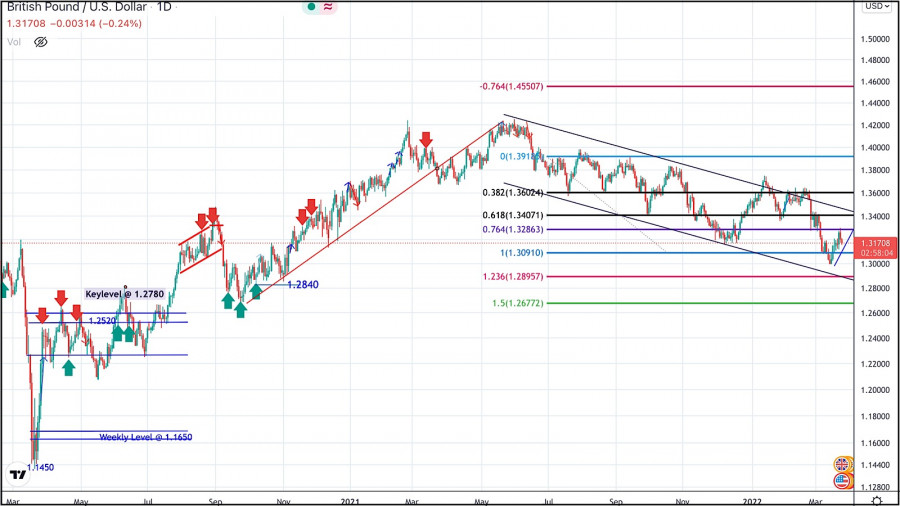
| March 24, 2021 : GBP/USD Intraday technical analysis and significant key-levels. Posted: 24 Mar 2022 11:09 AM PDT
The GBPUSD pair has been moving within the depicted bearish channel since July. Bearish extension took place towards 1.3220 where the lower limit of the current movement channel came to meet with Fibonacci level. Shortly after, BUYERS were watching the price levels of 1.3730 to have some profits off their trades as it stood as a key-resistance which offered significant bearish rejection recently. The short-term outlook turned bearish when the market went below 1.3600. This enhanced the bearish side of the market towards 1.3400 which brought the pair back towards 1.3600 for another re-test. Hence, the recent bullish pullback towards 1.3600 should have been considered for SELL trades as it corresponded to the upper limit of the ongoing bearish channel. It's already running in profits. Bearish persistence below 1.3090 was needed to enable further downside continuation towards 1.2900 (the lower limit of the movement channel). Bullish rejection was manifested around 1.3000, please note that bullish breakout above 1.3280 will probably enable quick bullish advancement towards 1.3400 and probably 1.3600 The material has been provided by InstaForex Company - www.instaforex.com |
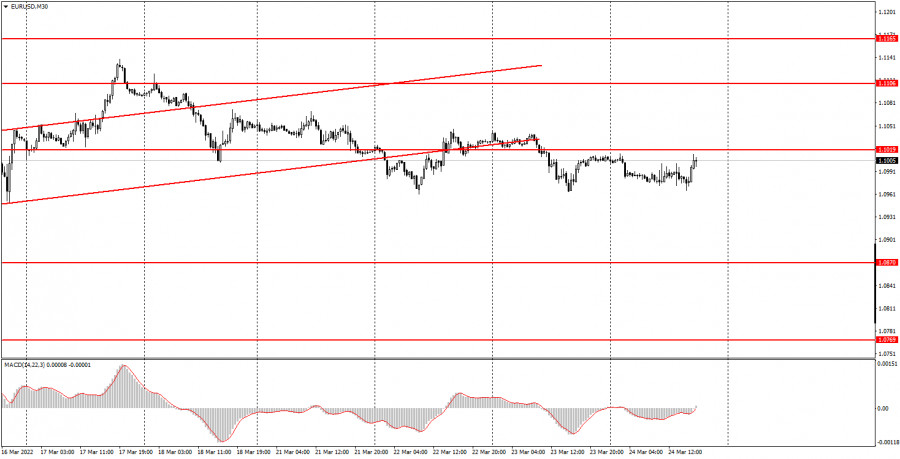
| How to trade the EUR/USD currency pair on March 25? Simple tips and analysis of deals for beginners. Posted: 24 Mar 2022 10:36 AM PDT Analysis of transactions Thursday: 30M chart of the EUR/USD pair.
The EUR/USD currency pair on Thursday was no longer just moving indistinctly, it was in a total flat. In principle, everything was going to this. The volatility of the pair fell almost every day, there were practically no new important reports and events. And as for geopolitics, the market began to calm down a little, frankly hoping that a new escalation of the military conflict would not happen. As a result, today the volatility of the pair did not exceed 50 points, and there was no trend movement at all. As we remember, any trend is a trader's friend. Accordingly, and vice versa. At this time, a downward trend is formally forming, as the price has managed to break out of the ascending channel. However, the pair has not been able to continue moving down for three days, but also cannot gain a foothold above the level of 1.1019. The macroeconomic background of today did not affect the pair's movement. The indices of business activity in the services and manufacturing sectors of the EU and the USA, orders for durable goods in America did not provoke any reaction from traders. And if there was a reaction, it did not exceed 10-15 points. 5M chart of the EUR/USD pair. On a 5-minute timeframe, the technical picture of today looks as simple as possible. During the day, a single trading signal was formed, and the pair traded mostly sideways all day. And even then, that single signal was formed with an error of 2 points. That is, it could be worked out, but novice traders could skip it. But if they didn't miss it, they could earn about 30 points, which, with total volatility of 50 points, is a very good result. It so happened that it was after the rebound from the 1.0964 level that the pair showed the strongest and most trending movement of the day. The price almost managed to reach the target level of 1.1019, but in any case, the purchase transaction should have been closed manually later in the evening. So it turned out to be profitable anyway. Now the euro/dollar pair can trade in a side-channel for some time. It seems that the market will be waiting for new geopolitical events since there is nothing much to expect in macroeconomic terms right now. How to trade on Friday: On the 30-minute timeframe, the pair has consolidated below the ascending channel, so we expect to see a continuation of the fall of the European currency. So far, there are obvious problems with this, despite the data received this week from the Fed and the ECB. Nevertheless, they have most likely already been worked out by the market, and it is waiting for new geopolitical events and news that may indeed appear in the near future. On the 5-minute TF tomorrow, it is recommended to trade by levels 1.0902, 1.0932, 1.0964, 1.1019, 1.1040, 1.1070, 1.1106. When passing 15 points in the right direction, you should set the Stop Loss to breakeven. On Friday, neither the States nor the European Union has scheduled any important events or the publication of the report. Nevertheless, now there is an information pause in the geopolitical conflict in Ukraine, but it is unlikely that it will last very long, given that military operations are continuing. The market can react very sensitively to new data. If they indicate an escalation of the conflict or the involvement of other countries in it, this may cause new sales of the euro and the pound. Basic rules of the trading system: 1) The strength of the signal is calculated by the time it took to generate the signal (rebound or overcoming the level). The less time it took, the stronger the signal. 2) If two or more trades were opened near a certain level on false signals, then all subsequent signals from this level should be ignored. 3) In a flat, any pair can form a lot of false signals or not form them at all. But in any case, at the first signs of a flat, it is better to stop trading. 4) Trade transactions are opened in the period between the beginning of the European session and the middle of the American session when all transactions must be closed manually. 5) On a 30-minute TF, signals from the MACD indicator can be traded only if there is good volatility and a trend, which is confirmed by a trend line or a trend channel. 6) If two levels are located too close to each other (from 5 to 15 points), then they should be considered as a support or resistance area. What's on the charts: Price support and resistance levels - the levels that are the targets when opening purchases or sales. Take Profit levels can be placed near them. Red lines are channels or trend lines - that displays the current trend and show in which direction it is preferable to trade now. MACD indicator (14,22,3) is a histogram and a signal line - an auxiliary indicator that can also be used as a signal source. Important speeches and reports (always contained in the news calendar) can greatly influence the movement of a currency pair. Therefore, during their exit, it is recommended to trade as carefully as possible or exit the market to avoid a sharp price reversal against the previous movement. Beginners to trade in the forex market should remember that every transaction cannot be profitable. Developing a clear strategy and money management is the key to success in trading for a long period. The material has been provided by InstaForex Company - www.instaforex.com |
| Analysis of GBP/USD on March 24. British and American statistics: neither positive nor negative Posted: 24 Mar 2022 10:36 AM PDT
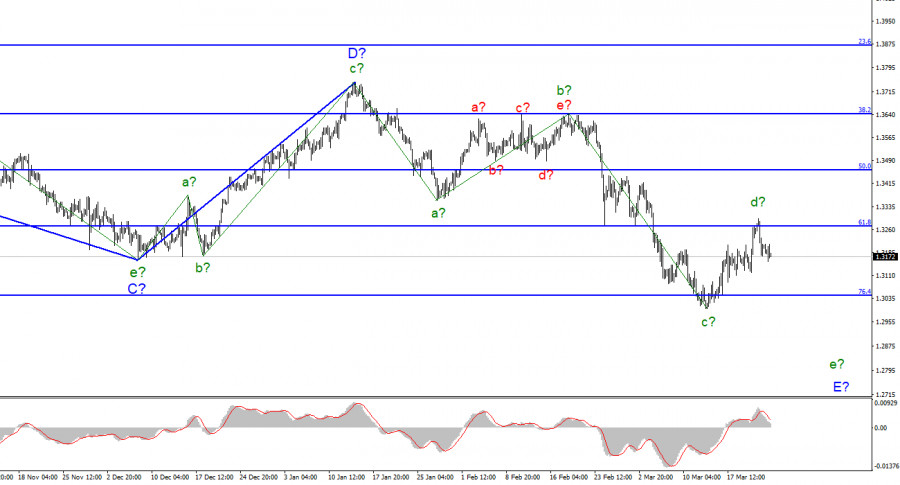
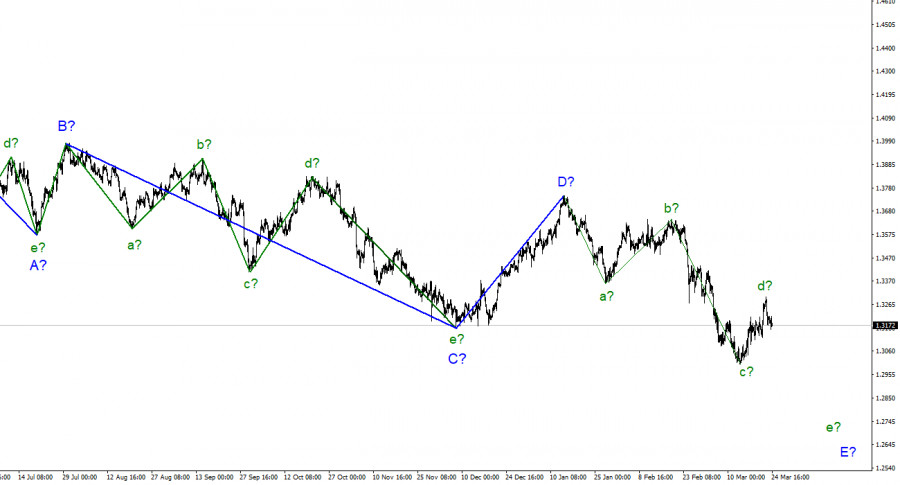
For the pound/dollar instrument, the wave markup continues to look very convincing and does not require any additions. The increase in the quotes of the British over the past week by all indications is a wave of d in E, and it may be nearing its completion or has already been completed. In total, there should be five waves inside the wave E, respectively, as in the case of the euro/dollar instrument, the downward trend section can continue its construction. At the moment, the British quotes have made an unsuccessful attempt to break through the 61.8% Fibonacci level, which may mean the completion of wave d. If this assumption is correct, then the decline in quotes will continue with targets located around the 27th figure within the wave e in E. I note that there are enough reasons for wave E to take an even more extended form. Or the entire downward section of the trend has taken a more extended form. It will depend on how bad the news background will be for the Briton. I have almost no doubt that the recent decline in the pound lies exclusively in the plane of the Ukrainian-Russian conflict. And this conflict is not over. The market has not decided on a trading strategy today The exchange rate of the pound/dollar instrument decreased by 15 basis points during March 24. Almost all day, the instrument has been rising and falling, which indicates that the market has not made a single decision. Economic statistics from the UK and the USA contributed to this situation. There were a lot of reports today, but they did not interest the market too much and were not the most important. The index of business activity in the manufacturing sector of Britain fell to 55.5, and the index of business activity in the service sector rose to 61.0. In America, the volume of orders for durable goods decreased by 2.2% m/m in February, but the total number of applications for unemployment benefits also decreased to 1,350 thousand. On both sides, therefore, there was one strong report and one weak one. This explains the fact that today demand has not grown for either the dollar or the pound. Of course, a lot now depends on the development of the conflict in Ukraine. There is no important news on this topic right now, but there is a lot of just news. The G-7 and NATO security summits will be held in the European Union today and tomorrow, during which decisions on new military assistance to Ukraine will probably be made. Moscow has repeatedly warned that with its help, the West is only fueling the conflict in Ukraine, and not helping to end it peacefully. The Kremlin also stated that any provision of assistance to Kyiv could be regarded as interference in the conflict, and a retaliatory strike would follow immediately. Therefore, today both instruments (euro/dollar and pound/dollar) were in a wait-and-see position. Tomorrow, it will be known how both summits ended, and new information will be received that will allow us to look at the balance of power in a new way. But now there are no hopes for a speedy and peaceful end to the conflict. General conclusions The wave pattern of the pound/dollar instrument assumes the construction of a wave E. I continue to advise selling the instrument with targets located near the 1.2676 mark, which corresponds to 100.0% Fibonacci, according to the MACD signals "down", since the wave does E not look complete yet. I propose to consider the expected wave d in E completed until the instrument makes a successful attempt to break through the 1.3273 mark, which equates to 61.8% Fibonacci.
At the higher scale, wave D looks complete, but the entire downward section of the trend does not. Therefore, in the coming weeks, I expect the decline of the instrument to continue with targets well below the low of wave C. Wave E should take a five-wave form, so I expect to see the quotes of the British near the 27th figure. The material has been provided by InstaForex Company - www.instaforex.com |
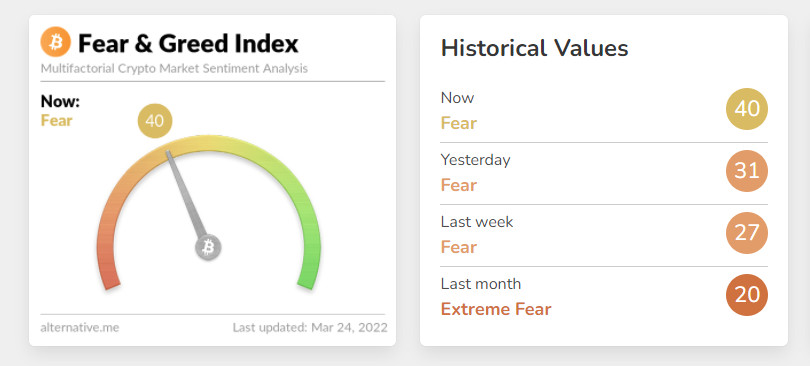
| The UK FCA has a tough policy against cryptocurrency companies Posted: 24 Mar 2022 10:36 AM PDT Bitcoin is not going to retreat from the assault on the $ 43,000 level, and we may see its breakdown in the near future. But whether it will be possible to gain a foothold above this range after that is a big question. Ether also feels comfortable around $ 3,000, but investors' pessimism is gradually approaching a critical mark. The well-known fear and greed index was now at 40 points, which is very close to the fear zone. Last week, the index showed 27 points at all, which could lead to a powerful sell-off of the cryptocurrency market, but investors resisted. If there is no progress at the above levels, trading instruments will see a downward correction to more acceptable support levels in the next few days, at which the major players will show themselves again. This will also lead to an increase in the fear index.
In the UK, they continue to tighten the screws on companies providing services in the field of cryptocurrencies. As it became known, all firms providing such services must be registered with the Financial Supervision Authority. Most likely, this kind of measure will force many cryptocurrency companies to wind down their business in the UK. Interestingly, the news about this appeared only today, and less than a week remains before the deadline, after which it will be prohibited to work under the old scheme. As I noted above, from March 31, firms providing services in the field of cryptocurrencies must be registered with the Financial Supervision Authority. He is also tasked with monitoring how digital asset firms fight money laundering. Last year, the regulator extended the deadline allowing firms in the temporary register to continue working without proper registration. Now, the FCA has stated that many crypto companies have already withdrawn their applications because they did not meet the required anti-money laundering standards. Many are seriously concerned about the fate of the $ 33 billion fintech company Revolut and the crypto startup Copper, whose adviser is former British Finance Minister Philip Hammond. The issue of these companies is hanging in the air, and their future in the UK is uncertain. Many industry representatives also expressed dissatisfaction with the way the FCA handles the cryptocurrency registry (especially how it approves applications and ignores requests. The FCA said that at the moment only 33 applications have been approved, and more than 80% of firms that could work in the UK have already withdrawn applications or been refused. "We have seen a large number of companies dealing with crypto assets that apply for registration while knowing that they do not meet the requirements," the FCA said. "Firms that did not meet the criteria were refused registration." Firms whose applications have been rejected by the FCA can appeal, but this is a lengthy process and may need to go through court. Many experts said that such measures could put the UK at a disadvantage at a time when it is struggling to become a world leader in financial innovation.
As for the technical picture of bitcoin Bitcoin has hit the $ 43,150 mark, and so far going beyond this range is problematic. The breakdown and active purchases above can play at the level of investors' greed, which will lead to reaching the next monthly highs in the areas of $ 45,780 and $ 48,500. The fact that bitcoin feels pretty great in the current conditions proves the interest in it, keeping its bullish potential in the long run. In the event of another decline in the trading instrument, only a breakdown of $ 40,500 will fail the trading instrument below, to a minimum of $37,500, and there it is at hand to $ 34,300. As for the technical picture of the ether The focus remains on the resistance of $ 3,050. Only the consolidation above will continue the upward trend for the trading instrument. The breakdown of $ 3,050 will serve as a new impulse to reach the levels of $ 3,272 and $ 3,399. In case of a return of pressure on ETH, purchases in the area of large support of $ 2,830, as it was this weekend, are not excluded. A break in this range will be a reason to go to the lows of $ 2,670 and $ 2,500, where the major players will again begin to actively act. The material has been provided by InstaForex Company - www.instaforex.com |
| Posted: 24 Mar 2022 09:22 AM PDT
On March 23, the Dow Jones-30 (#INDU) reached a high of 34,784. A technical correction followed from that level. Today in the American session, the index is trading below the 21 SMA located at 34,500. We expect a technical bounce or pullback towards this level which will be an opportunity to sell. Dow Jones-30 had a strong rally last week from a low of 32,573 around the zone 2/8 Murray. This week, the index is likely to make a technical correction. DJ30 is expected to return to the support 3/8 Murray at 33,593. The key support of the 200 EMA located at 34,039 could give it a technical bounce and the Dow could once again resume its upward movement. On the contrary, a sharp break of this zone could change the scenario and the DJ30 could start a downward trend and reach the 2/8 Murray at 32,812 in the short term. Our trading plan for the next few hours is to sell below the 21 SMA located at 34,500 with targets at 34,039 and 33,593. The eagle indicator is in the overbought zone and a bearish move is likely in the coming days. The material has been provided by InstaForex Company - www.instaforex.com |
| Trading signal for GBP/USD for March 24 - 25, 2022: sell below 1.3199 (4/8 Murray - SMA 21) Posted: 24 Mar 2022 08:28 AM PDT
On March 23, the GBP/USD pair reached a high of 1.3297, a level that coincides with the 200 EMA which acted as strong resistance. The British pound failed to break out the 200 EMA and consolidate above it, so it started a technical correction. Today in the American session, GBP/USD is trading below the 21 SMA located at 1.3199. From a technical viewpoint, trend indicators on the daily chart still remain in bearish territory and warn about further losses for the pound. According to the 4-hour chart, the British pound is still trading below the 200 EMA. The outlook also remains negative and GBP/USD is likely to resume its bearish move in the coming days. Downside pressure below the area 21 SMA (1.3199) will reaffirm the negative outlook and make the GBP/USD pair vulnerable to falling near the level 1.3061(5/8 Murray). The British pound is struggling to sustain an uptrend as investors are reacting to a dovish assessment of the BoE decision last week. As long as GBP/USD trades below the level of 1.3285 (200 EMA), it will suggest that the recent recovery move from yearly lows is over. This, in turn, will set the stage for a resumption of the downtrend. The GBP/USD pair could accelerate its decline and challenge the key psychological level of 1.3000. On the other hand, a sustained move above the level 1.3200 could help the recover GBP/USD and reach 1.3288 and even 5/8 Murray at 1.3305. Our trading plan is to sell below the 21 SMA (1.3199) and below the 4/8 Murray at 1.3183 with targets at 1.3061 and 2/8 Murray at 1.2939. The eagle indicator supports our bearish strategy because it is in the overbought zone. The material has been provided by InstaForex Company - www.instaforex.com |
| GBP/USD forecast on 24 March, 2022 Posted: 24 Mar 2022 08:17 AM PDT
On the downside, key support aligns at 1.3160 (Fibonacci 38.2% retracement, 100-period SMA on the four-hour chart). With a four-hour close below that level, 1.3100 (psychological level) could become the next bearish target. The material has been provided by InstaForex Company - www.instaforex.com |
| EUR/USD forecast on 24 March, 2022 Posted: 24 Mar 2022 08:16 AM PDT
EUR/USD is trading in negative territory below 1.1000 following a modest recovery attempt in the European session. The data from the US showed that Durable Goods Orders declined by 2.2% in February. On a positive note, Markit Composite PMI improved to 58.9 in March, beating the market expectation of 56. The EUR/USD pair shows on the daily chart that it is down for a second consecutive day, with a firmly bearish 20 SMA providing intraday resistance and leading the way lower. The Momentum indicator is stuck around its midline, while the RSI indicator gains bearish strength, heading lower at around 41, in line with further declines. The 4-hour chart offers a neutral-to-bearish picture, as the pair is unable to advance beyond a mildly bearish 100 SMA, while the 20 SMA converges with the longer one. Technical indicators in the mentioned time frame remain directionless, the Momentum around its midline and the RSI at around 42. The pair can accelerate its slump on a break below 1.0960, the weekly low. Support levels: 1.0960 1.0920 1.0875 Resistance levels: 1.1020 1.1070 1.1105 The material has been provided by InstaForex Company - www.instaforex.com |
| Posted: 24 Mar 2022 07:22 AM PDT
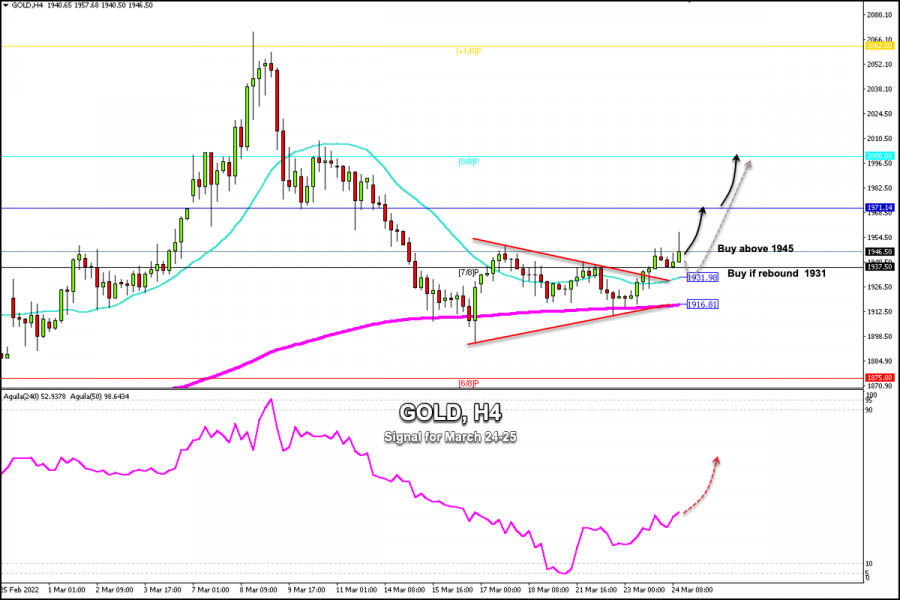
Early in the American session, gold is trading around $1,946 with a positive bias. According to the 4-hour chart, gold is above the 21 SMA (1,931) and above the 200 EMA located at $1,916. Yesterday, gold broke sharply through the symmetrical triangle pattern and now the short-term target is to reach the zone of $1,975 and the psychological level of $2,000 which coincides with 8/8 Murray. Yesterday, the Dow Jones Industrial Average opened session 200 points lower and then extended its decline throughout the day. Today in the early American session, the index is trading approximately 600 points below its high. The fact that the Wall Street indices are trading in the red is an indication that the market sentiment is changing. Last week, investors regained risk appetite but this week it is weakening and investors are likely to take refuge in gold, which could rebound to $2,000 and could even reach the high at 2,070. Negative market sentiment has been the main theme since Russia invaded Ukraine, which initially sent the price of gold to all-time highs in the $2,070 zone. US Treasury yields are playing a big role in the direction of gold. Bonds are correcting after hitting a high of 2.417%, this is benefiting gold, but it has little strength to continue its advance. It is expected that in the next few hours, gold will consolidate above 7/8 Murray located at $1,937. In the event of an eventual pullback, the 21 SMA is likely to act as a dynamic support and could give gold a new boost to resume its upward movement. The eagle indicator is generating a positive signal which supports our bullish strategy. The material has been provided by InstaForex Company - www.instaforex.com |
| Trading plan for Gold for March 24, 2022 Posted: 24 Mar 2022 06:11 AM PDT
Technical outlook:Gold prices have finally rallied towards its much anticipated counter trend and reaching close to $1,960 mark on Thursday. The yellow metal is now seen to e pulling back and is seen to be trading close to $1,947 levels. It is expected to find near term support through $1,930 levels, which is also fibonacci 0.618 retracement of the recentupswing between $1,910 and $1,958. Gold could see potential support through $1,930 mark and turn bullish towards $1,965 and up to $2,000-10 levels going forward. On the flip side, if prices drop below $1,920, it might open the door to re-test $1,910 and even drag the price further lower to the $1,880 mark. For now, bulls are looking inclined to push through $2,000 levels. Gold is currently producing a couter trend rally to retrace the earlier bearish boundary between $2,070 and $1,895 levels as seen on the 4H chart here. Once complete, bears are expected to be back in control and drag prices lower to $1,450 and beyond. The metal remains a good instrument to be sold on rallies. Trading plan:Potential rally through $2,000 against $1,890. Then lower. Good luck! The material has been provided by InstaForex Company - www.instaforex.com |
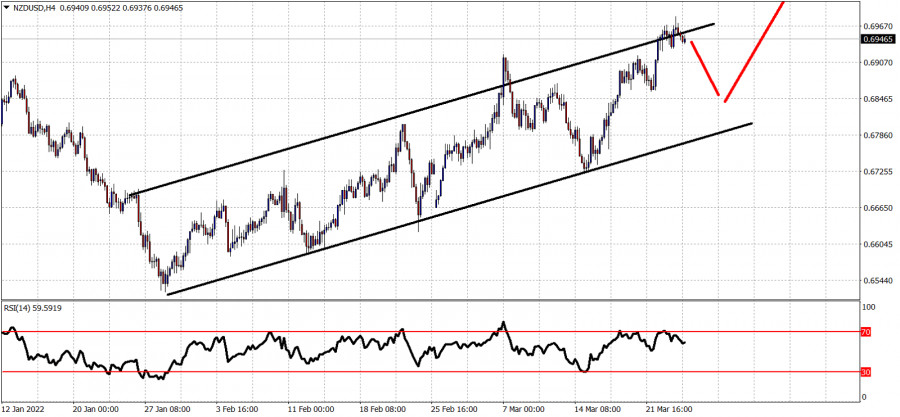
| NZDUSD: Overbought and vulnerable to a pull back. Posted: 24 Mar 2022 06:05 AM PDT Technically trend in NZDUSD remains bullish as price continues making higher highs and higher lows. Price is still inside the medium-term bullish channel. However this is not the time to open new long positions.
Red lines - expected price path NZDUSD is trading around 0.6950. Price is showing slowing down signs. The chances of a reversal and a move lower have increased. The RSI is providing us with bearish divergence signals. Short-term support is at 0.6930 and failure to stay above it will lead price lower. At current level we prefer to be neutral if not bearish. A pull back towards 0.6830 is expect in order to relieve the oscillators from overbought conditions. Key support by the upward sloping channel is found at 0.6780. Breaking below this level will have bearish impact on the pair. The material has been provided by InstaForex Company - www.instaforex.com |
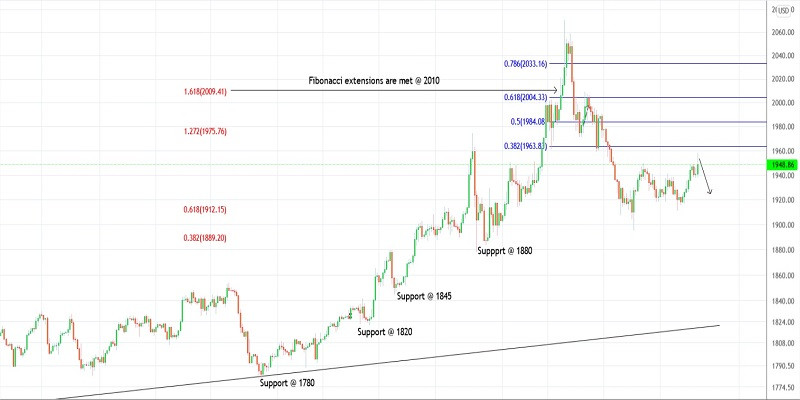
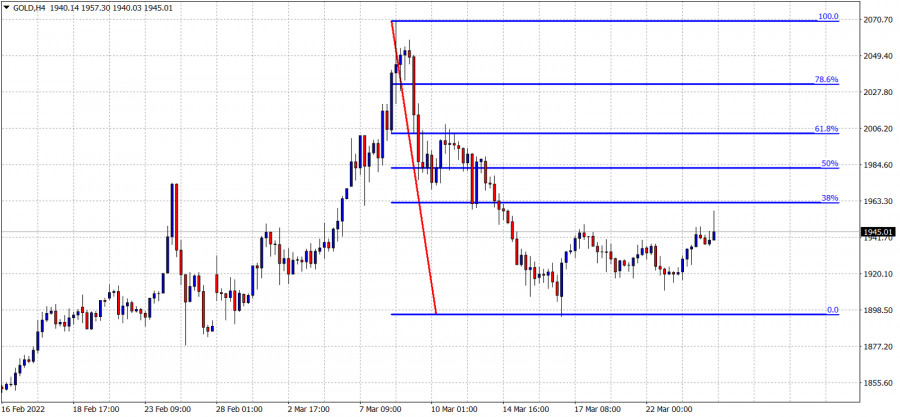
| Short-term technical analysis on Gold for March 24, 2022. Posted: 24 Mar 2022 05:59 AM PDT Gold price is trading above $1,945. Price is bouncing higher in what it seems to be a counter trend corrective bounce with respect to the decline from $2,070 to $1,894.
Gold price has not reached the 38% Fibonacci retracement yet. This is the first bounce target. This is also important short-term resistance. In order for Gold price to reach the 61.8% level, bulls need to show signs of strength and break above $1,963 and the 38% Fibonacci level. Support is found at recent lows at $1,919. A 4 hour candlestick close below this level, will be a bearish signal and will increase the chances of Gold falling below $1,894. The material has been provided by InstaForex Company - www.instaforex.com |
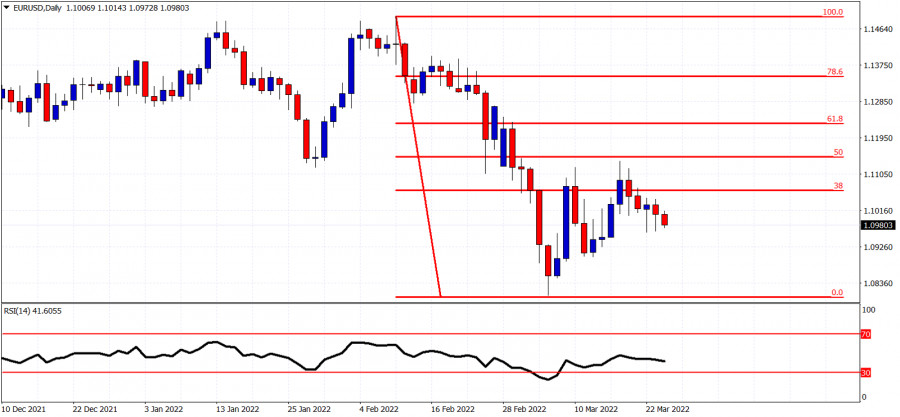
| EURUSD under pressure below 1.10. Posted: 24 Mar 2022 05:54 AM PDT EURUSD is trading around 1.0980. EURUSD continues to trade below key Fibonacci resistance and as long as this is happening, price will be vulnerable to a move towards 2022 lows.
EURUSD has made a bounce towards the 50% retracement but never got it. Price moved above the 38% Fibonacci level twice but bulls were not strong enough to hold price above it. The resistance at the 38% level has been confirmed twice. Bulls need to break above it otherwise they are in danger of seeing price fall towards 1.08. Key support as we mentioned in previous posts is found at 1.09. Bulls need to defend it. The material has been provided by InstaForex Company - www.instaforex.com |
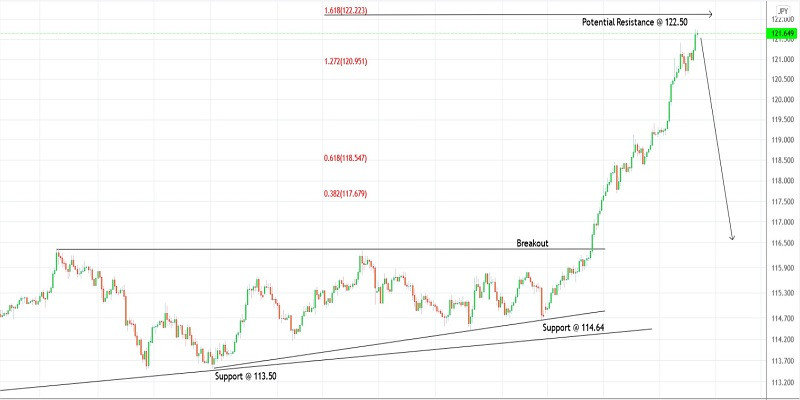
| Trading plan for USDJPY for March 24, 2022 Posted: 24 Mar 2022 05:54 AM PDT
Technical outlook:USDJPY has defied resistance yet again as bulls print another swing high around 121.75 on Thursday. The currency pair has produced a religious rally after breaking above its triangle consolidation earlier and is close to terminating around 122.20 levels. The Fibonacci 1.618 extension is seen passing through 122.20 mark as well, hence resistance should be strong. USDJPY was in a rising support (113.50, 114.65) and constant resistance (116.35) triangle consolidation earlier as seen on the 4H chart. Bulls were able to break the structure by pushing through 116.35 mark. The thrust wave between 114.65 and 121.75 looks near to completion as both fibonacci extensions are almost met. If the above proposed structure holds well, USDJPY should resume lower from here (112.60-122.20 range) sooner than expected. Also note that the recent swing high at 121.75 is accompanied by sharp bearish divergence on the RSI (which is not shown here). Prepare for a turn lower from here. Trading plan:Preparing for a potential turn lower against 122.90 Good luck! The material has been provided by InstaForex Company - www.instaforex.com |
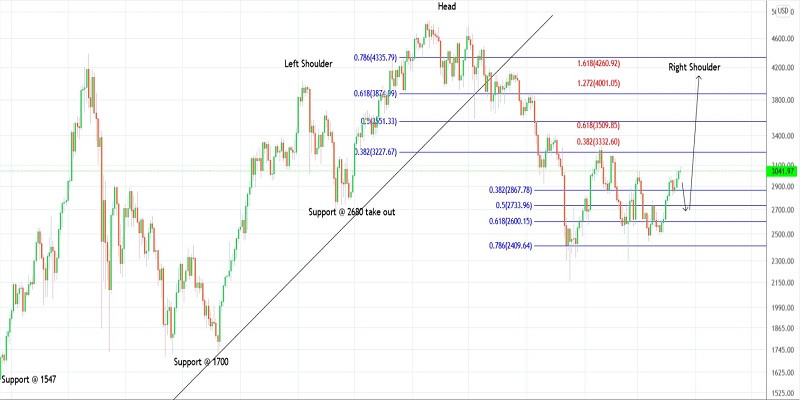
| Trading plan for Ethereum for March 24, 2022 Posted: 24 Mar 2022 05:39 AM PDT
Technical outlook:Ethereum has pushed through yet another intraday high close to $3,100 on Thursday. The crypto has pulled back a bit and is seen to be trading around $3,040 mark at this point in writing. It seems like a meaningful boundary is in place between $2,450 and $3,100 levels, which could be retraced before the next leg resumes higher. Ethereum is expected to find support around $2,700 mark, which is also the Fibonacci 0.618 retracement of the above upswing. High probability remains for a turn higher if bears manage to drag through the above potential support zone. Furthermore, it is also confirmed that the crypto is out of its triangle consolidation. Ethereum needs to push above $3,300 mark through to accelerate further towards $3,800-4,000 zone. It is the Fibonacci 0.618 retracement of its earlier drop between $4,850 and $2,100 levels respectively. Bears will remain inclined to be back in control from around the $4,000 mark and drag prices toward $1,700 lows going forward. Trading plan:Potential rally through $3,800-4,000 mark against $2,100. Then reversal. Good luck! The material has been provided by InstaForex Company - www.instaforex.com |
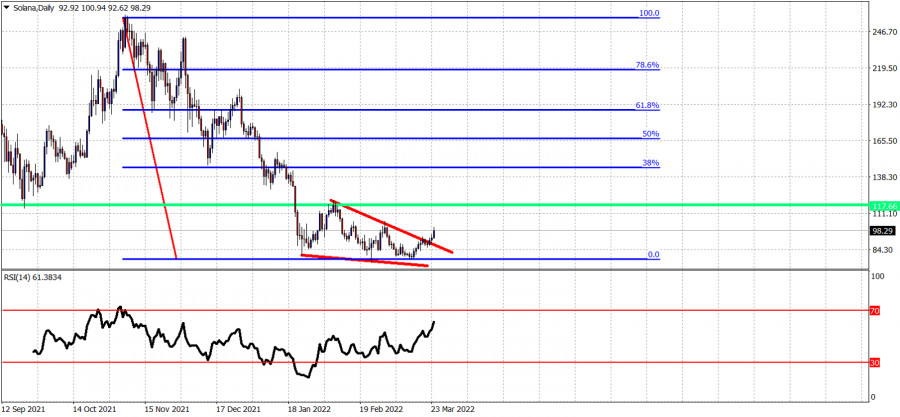
| Solana breaks out of wedge pattern providing bullish signal. Posted: 24 Mar 2022 05:34 AM PDT Like many cryptocurrencies, Solana has also formed a downward sloping wedge pattern. Solana has broken out of the wedge pattern providing a bullish signal and a minimum target at the start of the wedge pattern.
Red lines- wedge pattern Green line - short-term resistance and first target. Solana is trading now around $98.50. Breaking out of the wedge pattern gives us the start of the wedge as the first target area. This is shown by the green horizontal line. This target is at $117 area. If bulls manage to break above this level, then we expect Solana to reach the 38% Fibonacci retracement of the entire decline. This bounce towards the 38% level is justified if we confirm that the entire decline is complete. At current levels we prefer to be neutral if not bullish Solana. The material has been provided by InstaForex Company - www.instaforex.com |
| Bitcoin's correlation with S&P sets new record, BlackRock predicts massive BTC adoption Posted: 24 Mar 2022 05:32 AM PDT Arcane Research has released a report stating Bitcoin has recently set a new peak correlation coefficient with the S&P500 index. It reached a value of 0.49, breaking the previous record set in October 2020. Why is the correlation between BTC and S&P growing?According to Arcane Research, the 90-day correlation is actually a new peak that shows the unprecedented rise in the price and value of Bitcoin in its entire history. This is another confirmation of the fact that the threat of correlation with the stock market remains high enough for the growth of BTCUSD, as it may sink due to the prospect of several stages of Fed interest rate hikes until the end of 2022. Understanding the U.S. Treasury yield curve has reinforced the existing correlation. Yields on 10-year and 2-year bonds have now fallen to 20 basis points, short of the inversion where they could have gone negative. These statistics are often seen as a marker of an impending recession in the market. It is worth noting that the idea that cryptocurrencies in general and Bitcoin in particular also respond to market fundamentals such as hyperinflation creates tension between the belief that the main cryptocurrency itself can be used as a hedge against inflation, as claimed by some firms, such as MicroStrategy. BlackRock predicts growth in cryptocurrency adoptionIn parallel with the growing correlation of cryptocurrencies with the stock market, their implementation can now receive a new impetus in the world. Larry Fink, CEO of investment management firm BlackRock, said on Thursday about "a possible boost in cryptocurrency adoption due to the Russian-Ukraine war," Reuters reported. This emerging trend has forced him to change his stance towards cryptocurrencies to a positive one. According to him, the new reality has pushed banks and companies dealing with foreign currency settlements to switch settlements abroad to cryptocurrencies and digital assets. Bitcoin as a tool for international payments: is it real?The CEO of BlackRock believes that digital currencies such as Bitcoin can be used as a settlement tool for international transactions. Fink noted that current events will force countries to rethink their dependence on fiat currencies and embrace cryptocurrencies as an alternative tool. He told BlackRock shareholders about this. Due to the increased interest of customers in digital currencies and stablecoins, BlackRock began to study their usefulness and benefits. Moreover, he believes that a well-designed payment system based on digital currencies will improve the existing settlement system for international transactions. It can also reduce the risk of money laundering and corruption at the same time.
|
| Video market update for March 24,,2022 Posted: 24 Mar 2022 05:30 AM PDT Watch for the breakout mode on EUR.... The material has been provided by InstaForex Company - www.instaforex.com |

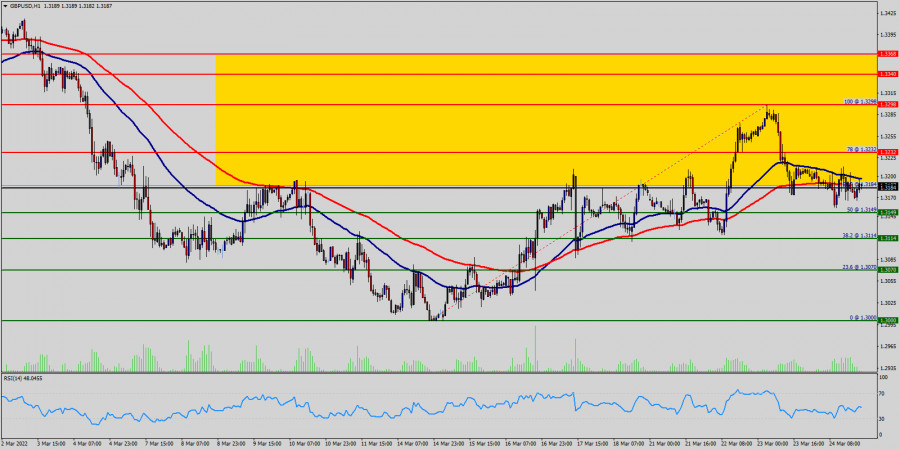

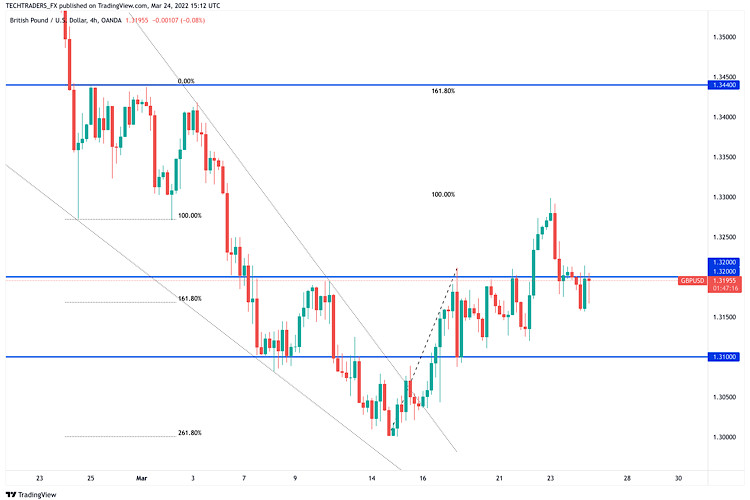 outlook doesn't provide any directional clues. In order to attract bulls, GBP/USD needs to reclaim 1.3200 (psychological level, Fibonacci 50% retracement of the latest downtrend) and start using that level as support. In that case, the pair could regain its traction and eye 1.3250 (Fibonacci 61.8% retracement) and 1.3300 (psychological level, weekly high).
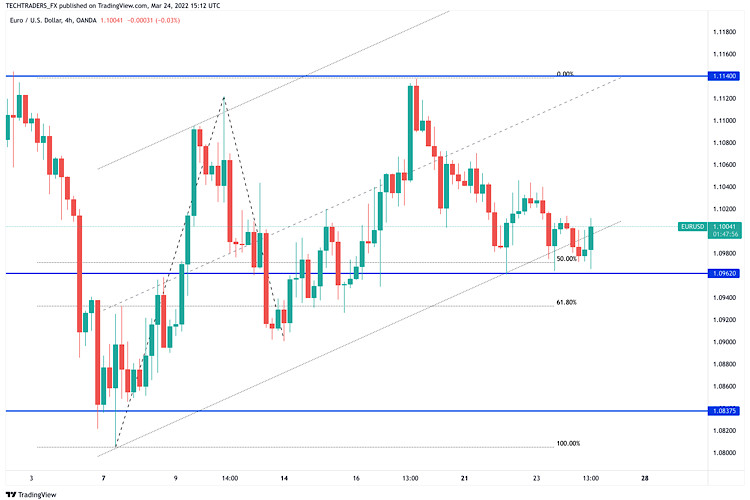

| You are subscribed to email updates from Forex analysis review. To stop receiving these emails, you may unsubscribe now. | Email delivery powered by Google |
| Google, 1600 Amphitheatre Parkway, Mountain View, CA 94043, United States | |


Comments