Forex analysis review
Forex analysis review |
- Technical analysis of EUR/USD for March 09, 2022
- March 9, 2021 : EUR/USD daily technical review and trading opportunities.
- March 9, 2021 : EUR/USD Intraday technical analysis and trading plan.
- March 9, 2021 : GBP/USD Intraday technical analysis and significant key-levels.
- How to trade EUR/USD on March 10, 2022. Simple trading tips and analysis for beginners
- Trading signals for Crude oil (WTI - #CL) on March 9-10, 2022: sell below 120.52 (21 SMA - symmetrical triangle )
- Trading plan for Gold for March 09, 2022
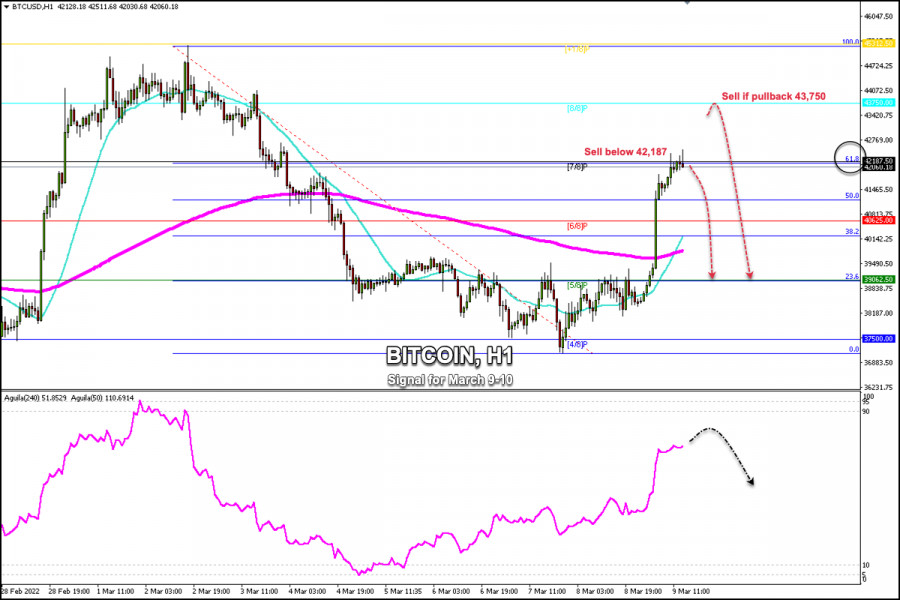
- Trading signals for Bitcoin (BTC/USD) on March 9-10, 2022: sell below $42,187 (7/8 Murray - 61.8% Fibonacci )
- Trading plan for Ethereum for March 09, 2022
- Oil prices volatile as Russian oil import bans worry world markets
- Major Asian stock indices slide
- Trading plan for USDJPY for March 09, 2022
- Ethereum to face major resistance trend line once again.
- EUR/USD Analysis and Trading Plan
- EURUSD dead cat bounce or major reversal?
- Gold pulls back towards $2,000.
- Is the Dollar index preparing for a major reversal?
- BTC update for March 09,.2022 - Both upside objectives has been reached
- Video market update for March 09,,2022
- Analysis of Gold for March 09,.2022 - Key pivot at the price of $2.003 on the test
- EUR/USD analysis for March 09, 2022 - Upside breakout of the important pivot
- US premarket on March 9: commodity prices drop and investors' worries ease
- Bitcoin: Fidelity explains why cryptocurrency volatility is good for investors
- Outlook for GBP/USD for US trade on March 9. GBP to exceed 1.3141
- Forecast for EUR/USD on March 9. The situation continues to deteriorate. There is no economic news
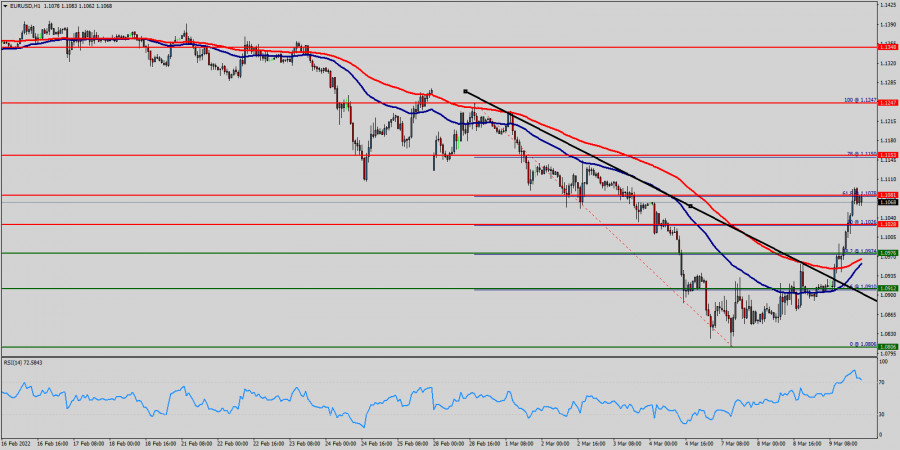
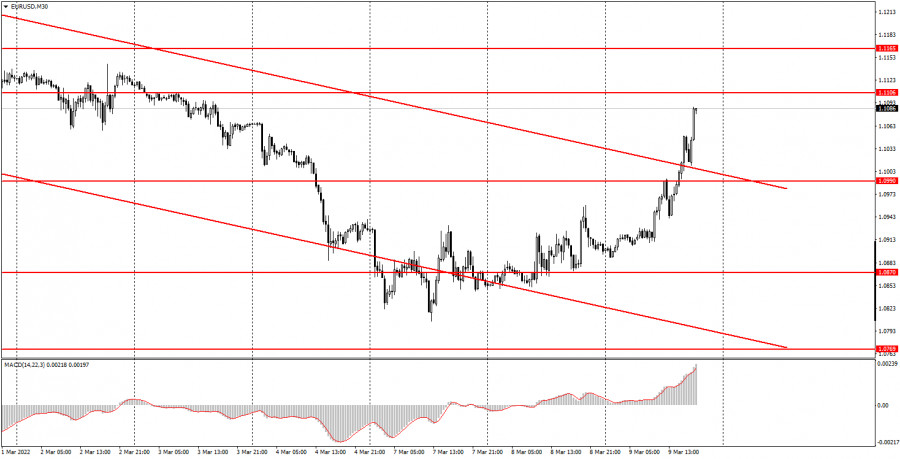
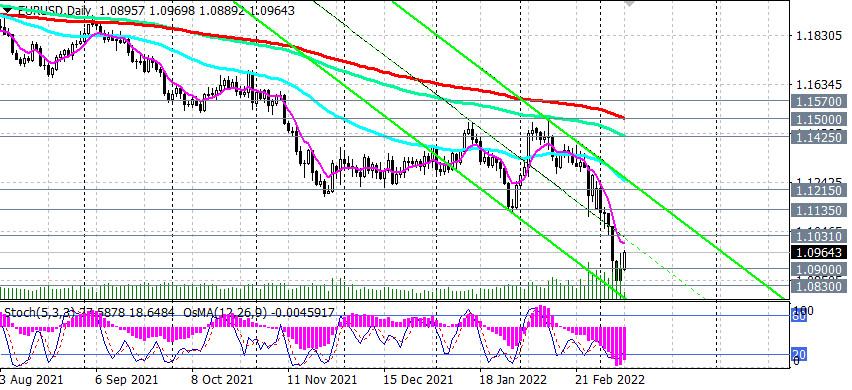
| Technical analysis of EUR/USD for March 09, 2022 Posted: 09 Mar 2022 01:06 PM PST
The EUR/USD pair continues to move downwards from the level of 1.1247. The pair dropped from the level of 1.1247 to the bottom around 1.0806. But the pair has rebounded from the bottom of 1.0806 to close at 1.1069. Today, the first resistance level is seen at 1.1081, the price is moving in a bearish channel now. Furthermore, the price has been set below the strong resistance at the level of 1.1081, which coincides with the 61.8% Fibonacci retracement level. This resistance has been rejected several times confirming the veracity of a downtrend. Additionally, the RSI starts signaling a downward trend. As a result, if the EUR/USD pair is able to break out the first support at 1.0976, the market will decline further to 1.0868 in order to test the weekly support 2. Consequently, the market is likely to show signs of a bearish trend. So, it will be good to sell below the level of 1.1081 with the first target at 1.0976 and further to 1.0868. However, stop loss is to be placed above the level of 1.1153. The material has been provided by InstaForex Company - www.instaforex.com |
| March 9, 2021 : EUR/USD daily technical review and trading opportunities. Posted: 09 Mar 2022 11:02 AM PST
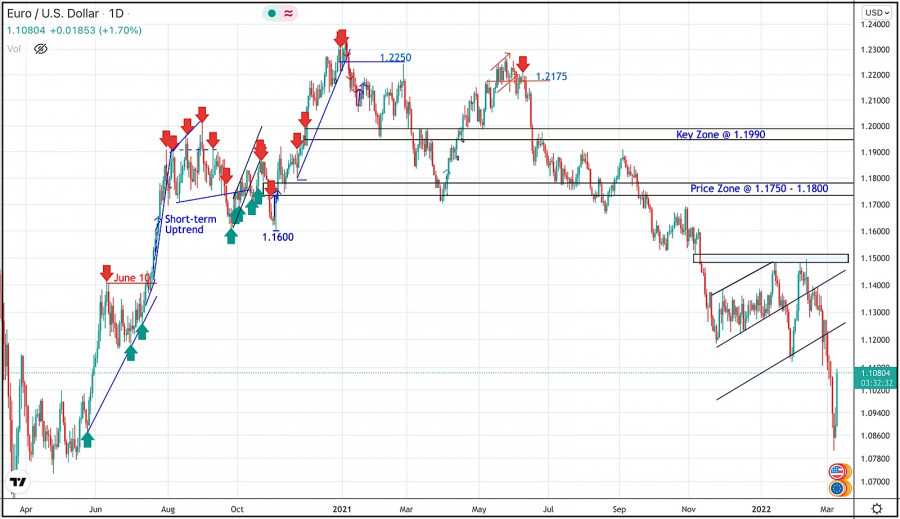
During the past few weeks, the EURUSD pair has been trapped within a consolidation range between the price levels of 1.1700 and 1.1900. In late September, Re-closure below the price level of 1.1700 has initiated another downside movement towards 1.1540. Price levels around 1.1700 managed to hold prices for a short period of time before another price decline towards 1.1200. Since then, the EURUSD has been moving-up within the depicted movement channel until bearish breakout occurred by the end of last week's consolidations. Few weeks ago, the price zone of 1.1350 failed to offer sufficient bearish rejection that's why it was bypassed until 1.1500 which applied significant bearish pressure on the pair. A possible SELL Entry was offered upon the previous ascending movement towards 1.1500 which provided significant bearish pressure. Shortly after, the EURUSD looked oversold while approaching the price levels of 1.0850. That's where the current upside movement was initiated. Any movement towards 1.1200 should be considered for another SELL trade as long as sufficient SELLING pressure is demonstrated. The material has been provided by InstaForex Company - www.instaforex.com |
| March 9, 2021 : EUR/USD Intraday technical analysis and trading plan. Posted: 09 Mar 2022 10:52 AM PST
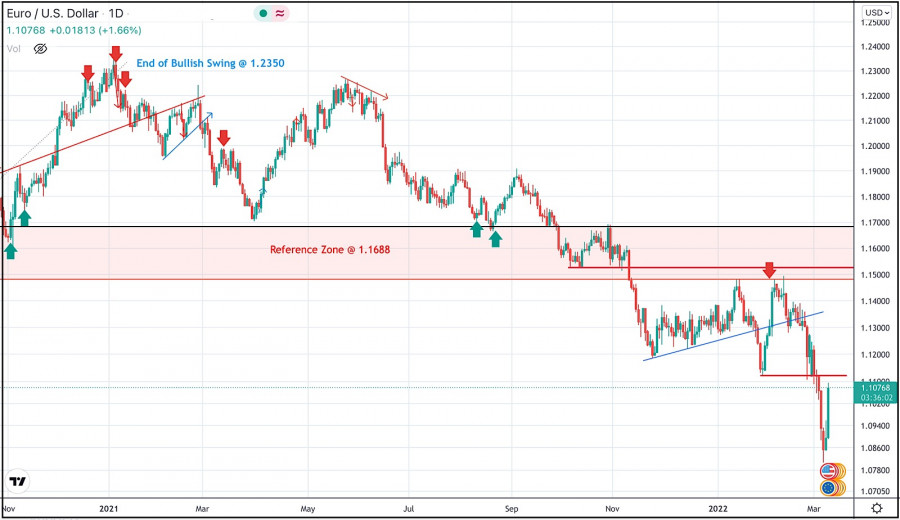
Recent bullish pullback towards 1.1650-1.1680 (upper limit of the previous consolidation range) was expected to offer bearish rejection and a valid SELL Entry. Significant bearish decline brought the EURUSD pair again towards 1.1550 levels which failed to provide sufficient BUYERS for too long period. Hence, only a short- term sideway movement was demonstrated around 1.1550 before quick bearish decline could occur towards 1.1200. On the other hand, the price levels around 1.1520 stood as a reference zone that applied significant bearish pressure upon two successive bullish visits. Recent Bearish decline below 1.1100 was considered as a bearish continuation sign. That's why, downside movement was expected to proceed towards 1.1000 then 1.0920 where the current bullish pullback was initiated. The price levels around 1.1100 should be watched upon the current bullish move for bearish rejection and a possible SELL Entry. However, failure to do so will probably enable more bullish advancement towards 1.1320 The material has been provided by InstaForex Company - www.instaforex.com |
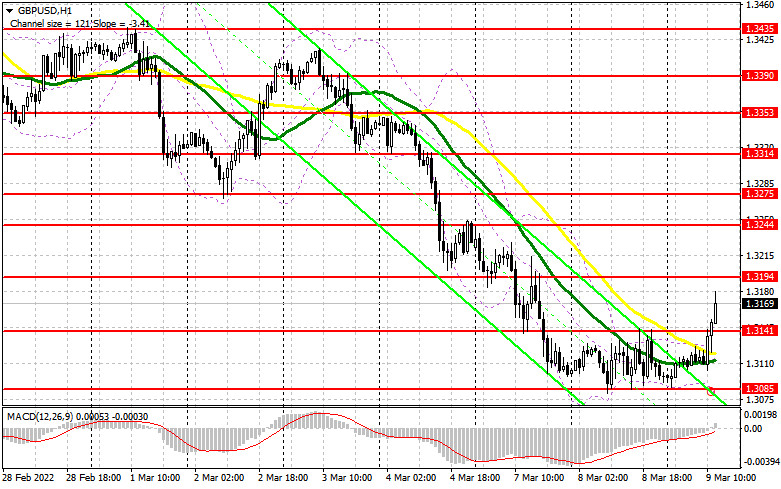
| March 9, 2021 : GBP/USD Intraday technical analysis and significant key-levels. Posted: 09 Mar 2022 10:36 AM PST
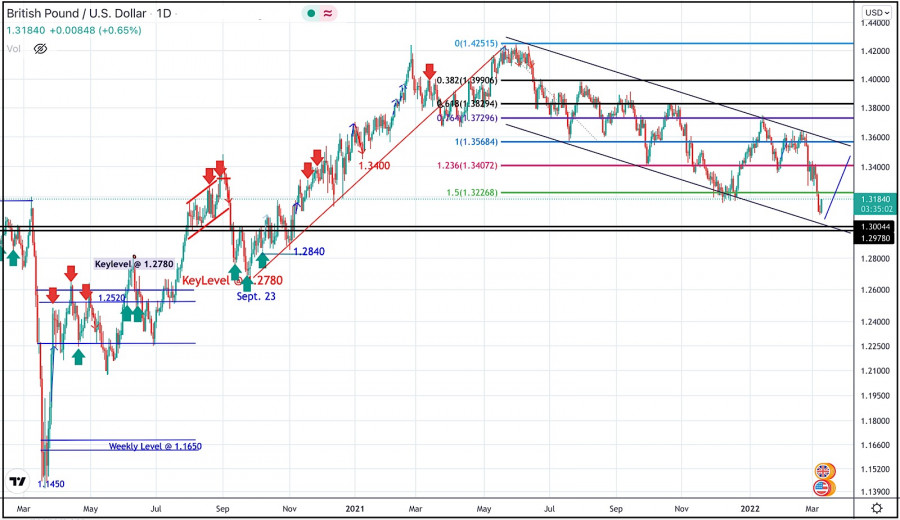
The GBPUSD pair has been moving within the depicted bearish channel since July. Bearish extension took place towards 1.3220 where the lower limit of the current movement channel came to meet with Fibonacci level. Conservative traders should have taken BUY trades around 1.3200 price levels as suggested in previous articles. Shortly after, BUYERS were watching the price levels of 1.3730 to have some profits off their trades as it stood as a key-resistance which offered significant bearish rejection recently. The short-term outlook turned bearish when the market went below 1.3600. This enhanced the bearish side of the market towards 1.3400 which brought the pair back towards 1.3600 for another re-test. Hence, the recent bullish pullback towards 1.3600 should have been considered for SELL trades as it corresponded to the upper limit of the ongoing bearish channel. It's already running in profits. Bearish persistence below 1.3220 may enable further downside continuation while initial bearish target is located around 1.3000 (the lower limit of the movement channel). On the other hand, please note that bullish breakout above 1.3250 enables quick bullish advancement towards 1.3400. The material has been provided by InstaForex Company - www.instaforex.com |
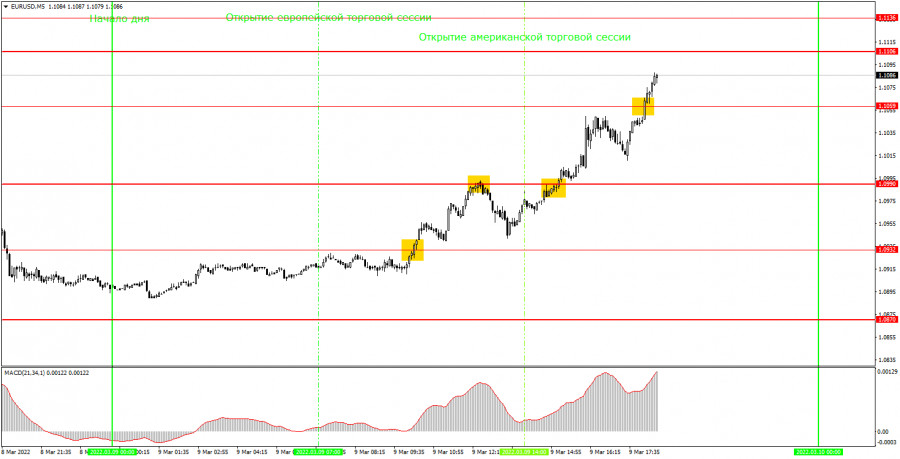
| How to trade EUR/USD on March 10, 2022. Simple trading tips and analysis for beginners Posted: 09 Mar 2022 10:30 AM PST Analyzing trades on Wednesday: EUR/USD on 30M chart
The EUR/USD pair made a rapid advance on Wednesday. The euro unexpectedly surged by almost 200 pips. There was not a single message, news, or publication that could potentially provoke such a strong movement. The price has settled above the descending channel.This indicates that the downtrend has been canceled and the euro may be rising for a while. Hopefully, forex traders have shifted their attention from the geopolitical background and will not react so strongly to any news from Russia or Ukraine. But this remains to be seen. One thing is clear for now: the euro is showing a strong upward movement which is opposite to the main technical picture. Tomorrow will be a very important day for EUR. On Thursday, the US will release the data on inflation, the ECB will hold its policy meeting, and Sergey Lavrov will negotiate with Dmitry Kuleba. EUR/USD on 5M chart
On the 5-minute time frame, a clear trend movement was observed today. A trend is always good for traders. There were only a few trading signals during the day, but all of them were strong and profitable. The first buy signal was formed when the price broke through the level of 1.0932. A few hours later, the price reached the level of 1.0990 and rebounded from it. Therefore, beginners had to close long positions and open short ones. In the course of a downward cycle, the price dropped by 30 pips but failed to reach the target level of 1.0932. Therefore, it was possible to profit from this trade only by closing it manually. The next buy signal was formed near the level of 1.0990, and the price subsequently went up by another 80 pips, breaking through the level of 1.1059 on its way. Thus, this trade should have been closed manually in the evening. As a result, the profit on three trades could have amounted to at least 100 pips, which is an excellent result. As you can see, a trend can appear even when there are no fundamental and macroeconomic reasons for it. A trend movement is very important for traders. That is why we analyze various news and economic reports. Trading tips on Thursday On the 30-minute time frame, the downtrend has been canceled. However, the euro's unexpected rally has no strong reason behind it. Therefore, we can assume that the pair will resume its fall on Thursday. At least, it will go through a correction after a 200-pip rally it had today. The news background on Thursday will shape the market sentiment. On the 5-minute time frame, it is recommended to trade at the levels of 1.0870, 1.0932, 1.0990, 1.1059, 1.1106, 1.1136, 1.1165, and 1.1228. You should set a Stop Loss to breakeven as soon as the price moves 15 pips in the right direction. On Thursday, the ECB will sum up the results of its March meeting, which will be followed by Christine Lagarde's speech. These events will trigger a reaction in the market only if the ECB head announces important changes in the monetary policy. The US will publish the data on inflation. In addition to this, negotiations will continue between Kyiv and Moscow. This news may also affect the movement of the pair during the day. Basic rules of the trading system 1) The strength of the signal is determined by the time it took the signal to form (a rebound or a breakout of the level). The quicker it is formed, the stronger the signal is. 2) If two or more positions were opened near a certain level based on a false signal (which did not trigger a Take Profit or test the nearest target level), then all subsequent signals at this level should be ignored. 3) When trading flat, a pair can form multiple false signals or not form them at all. In any case, it is better to stop trading at the first sign of a flat movement. 4) Trades should be opened in the period between the start of the European session and the middle of the US trading hours, when all positions must be closed manually. 5) You can trade using signals from the MACD indicator on the 30-minute time frame only amid strong volatility and a clear trend that should be confirmed by a trendline or a trend channel. 6) If two levels are located too close to each other (from 5 to 15 pips), they should be considered support and resistance levels. On the chart Support and Resistance Levels are the levels that serve as targets when buying or selling the pair. You can place Take Profit near these levels. Red lines are channels or trend lines that display the current trend and show in which direction it is better to trade now. The MACD indicator (14, 22, and 3) consists of a histogram and a signal line. When they cross, this is a signal to enter the market. It is recommended to use this indicator in combination with trend patterns (channels and trendlines). Important announcements and economic reports that can be found on the economic calendar can seriously influence the trajectory of a currency pair. Therefore, at the time of their release, we recommend trading as carefully as possible or exiting the market in order to avoid sharp price fluctuations. Beginners on Forex should remember that not every single trade has to be profitable. The development of a clear strategy and money management is the key to success in trading over a long period of time. The material has been provided by InstaForex Company - www.instaforex.com |
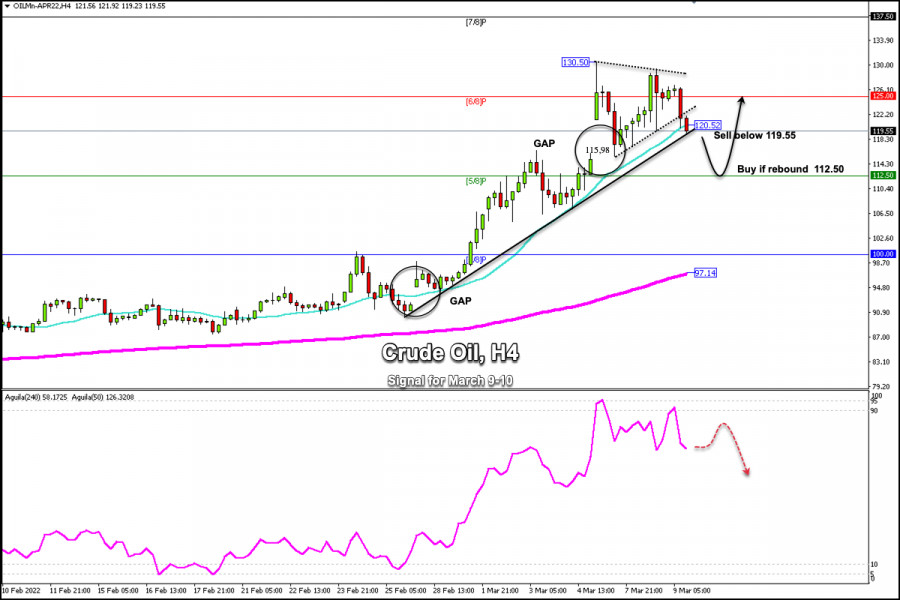
| Posted: 09 Mar 2022 07:54 AM PST
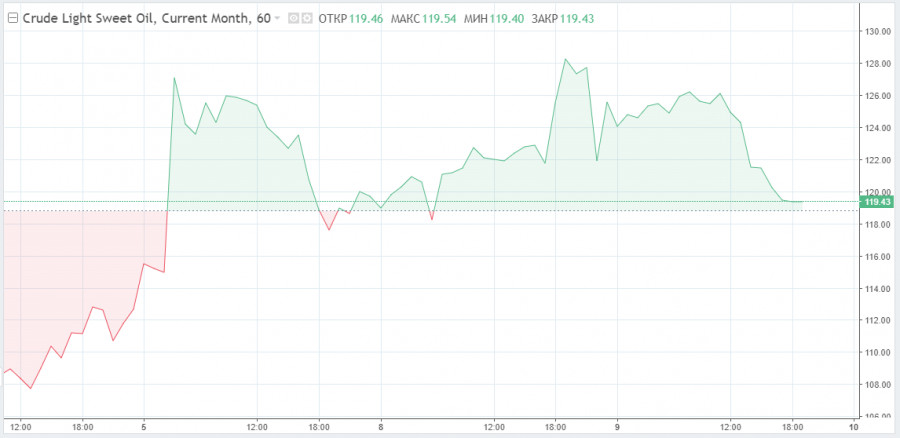
Crude oil price reached a high of 130.50 above Murray's 6/8. We can observe the formation of a symmetrical triangle which was broken in the European session. At the fundamental level, in the effort to mitigate the impact of the ban on Russian oil imports, US State Department senior adviser Amos Hochstein said earlier Wednesday that the United States and other nations would consider releasing more barrels of oil from reserves, if necessary. On the other hand, OPEC Secretary General Mohammed Barkindo said there is no physical shortage of oil at the moment, in an interview to Bloomberg TV. On a technical level, early in the American session, crude oil is trading below the 21 SMA located at 120.52. It is approaching the uptrend channel formed since February 25. A sharp break below 119.55 could accelerate the move down towards 5/8 Murray located at 112.50 and towards the psychological level of $100.00. The short-term outlook for oil could be determined by the development of the war scenarios between Russia and NATO, which are constantly being threatened and that makes investors nervous. Any correction in crude oil will be seen as an opportunity to continue buying in the short term. So, in the coming hours it is likely that crude oil will attempt to cover the gap it left on March 4 at 115.98. Therefore, at current price levels as long as WTI remains below the 21 SMA located at 120.52, there will be an opportunity to continue selling with targets at 112.50. On the other hand, a technical bounce in the 5/8 Murray zone around 112.50 will be a buying opportunity with targets at 120.50, 125.00 (6/8) and could hit the high 130.50. The material has been provided by InstaForex Company - www.instaforex.com |
| Trading plan for Gold for March 09, 2022 Posted: 09 Mar 2022 06:48 AM PST
Technical outlook:Gold prices rallied through the roof toward $2,070 mark late on Tuesday, threating to take out $2,075 swing highs. The yellow metal faced considerable resistance and reversed as sharply on Wednesday. It is seen to be trading close to $1,990 levels at this point in writing after printing intraday low below $1,980 mark. Gold's price action might be suggesting a meaningful potential top in place around $2,070 and that bears could be back in control from here. Please note that initial support comes in around $1,960 as labelled on the 4H chart here. A break below that would confirm that bears are back in control and are here to stay for long. Earlier, Gold had met its fibonacci 1.618 extension around $2,020 high as depicted on the chart. The final leg higher was an extended one but still keeps the bearish outlook intact. The metal seems to be good to be sold on rallies from here as bears target $1,960 and $1,880 levels in the near term. Watch out for a potential trend reversal ahead. Trading plan:Potential drop through $1,880 against $2,080 Good luck! The material has been provided by InstaForex Company - www.instaforex.com |
| Posted: 09 Mar 2022 06:48 AM PST
After a week of a downtrend and constant price declines, since the beginning of the Asian session, BTC broke the resistance zone of 5/8 Murray at 39,062. Until today, Bitcoin is gaining more than 10.2%. The increase could have been triggered by news of a new educational program from the US Treasury Department. Yesterday Bitcoin was trading around the support zone of 37,500 and is now trading at $42,187. In these 24 hours, BTC broke above the psychological level of 40,000 and 42,000, which have been vital levels of resistance. It is currently located above the 21 SMA and the 200 EMA with a bullish bias. In the next few hours, it could reach the resistance of 8/8 Murray at 43,750. This BTC rally could be part of a technical correction and the crypto could resume its downtrend and reach the support of 37,500 again. According to the Fibonacci indicator, BTC has made a correction towards 61.8%. If it fails to consolidate above this area in the next few hours, there is likely to be a pullback towards the level 200 EMA around 40,000. If the price breaks this zone, it could again fall towards 37,500. Our trading plan for the next few hours is to sell below 7/8 Murray at 42,187 with targets at 39,062 and towards 4/8 Murray at 37,500. Or in case of a pullback towards 43,750 it would be an opportunity to sell at resistance of 8/8 Murray. The material has been provided by InstaForex Company - www.instaforex.com |
| Trading plan for Ethereum for March 09, 2022 Posted: 09 Mar 2022 06:28 AM PST
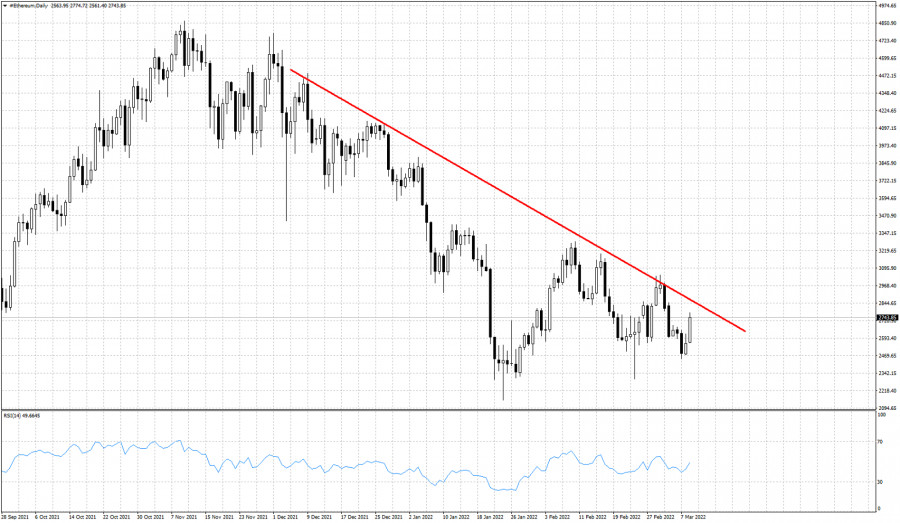
Technical outlook:Ethereum might have resumed its rally toward $3,600 and up to $4,000 mark as discussed on Tuesday. The crypto is seen to be trading higher around 4,373-50 zone at the time of writing and is expected to continue higher in the next few trading sessions. A push above $3,300 mark will accelerate through $3,600 mark. Ethereum is into its counter trend rally since $2,100 lows. The corrective usually unfolds into three waves out of which two are already complete around $3,300 and $2,300 levels respectively. If the above structure holds well, bulls will remain poised to hold prices above $2,300 and continue higher in the next few trading sessions. Ethereum could be retracing its larger downswing between $4,850 and $2,100 levels as seen on the daily chart here. If the above is correct, the crypto might reach fibonacci 0.618 level around $3,800-4,000 mark before finding resistance again. Bears will remain poised to be back in control thereafter. Trading plan:Potential rally through $4,000 against $2,100 Good luck! The material has been provided by InstaForex Company - www.instaforex.com |
| Oil prices volatile as Russian oil import bans worry world markets Posted: 09 Mar 2022 05:38 AM PST
Oil trading remains highly volatile on Wednesday. At the time of writing, Brent futures with delivery in May retreated to $123.91 per barrel after opening at $130.46 during the European session. WTI April futures fell to $119.43 per barrel from $125.66 early on Wednesday. The commodity declined after the American Petroleum Institute published its US stockpiles data. According to API, US crude stockpiles unexpectedly increased by 2.8 million barrels, well above expectations of market players and analysts. As a result, crude oil prices has declined sharply. Oil advanced early on Wednesday following Joe Biden's announcement of a ban on Russian energy imports. The White House stated it banned Russian oil, natural gas, and energy imports to bring down the Russian economy in response to the war in Ukraine. "This is a move that has strong bipartisan support in the Congress and, I believe, in the country," Biden said. In 2021, the United States imported about 672,000 barrels of oil and petroleum products. According to data by Lipow Oil Associates, this amounted to 8% of total US oil imports. The US decision to ban imports of Russian oil, petroleum products, LNG, and coal is likely to propel inflation upwards. Soaring prices of other commodities is also putting pressure on the US economy. On March 3, Jerome Powell, chairman of the Federal Reserve, warned that rising energy prices would negatively affect the American economy and boost inflation in the short term. The UK has joined its ally and announced it would phase out Russian oil imports by the end of the year. British sanctions do not apply to Russian natural gas. According to Bloomberg citing the UK Office for National Statistics, Russian oil and gasoline products constituted 13.4% of the UK's imports. The European Union has published its plan to reduce its dependence on Russian supply. Frans Timmermans, first vice president of the European Commission, has announced the EU would reduce its consumption of Russian natural gas by two-thirds this year. Calls for Western sanctions against Russia have raised fears of supply disruptions, leading to an oil price upsurge. However, market players began to avoid Russian oil before Western sanctions were announced. Lipow Oil Associates noted that even without government legislation, there was a de-facto ban on Russian crude oil in the market. While traders digest the recent news, American citizens face the highest gasoline prices since 2008. On Tuesday, March 8, the average price of gasoline reached $4,173 per gallon. According to AAA Gas Prices, one gallon of gas costed $4,114 in July 2008. The US Department of Energy's oil stockpile data is due today. According to the Wall Street Journal, oil stockpiles were projected to fall by 400,000 barrels, while gasoline and distillate stockpiles were expected to decline by 1.9 million barrels. The situation in Ukraine remains dire, with only some humanitarian corridors for civilians functioning. The world's rating agencies have downgraded Russia's economic rating, stating Russia is very close to a default. The upcoming talks between Russian and Ukrainian foreign ministers in Turkey, which will happen on Thursday, could bring some optimism to the markets. Currently, traders with short positions in risky assets should await its conclusion. |
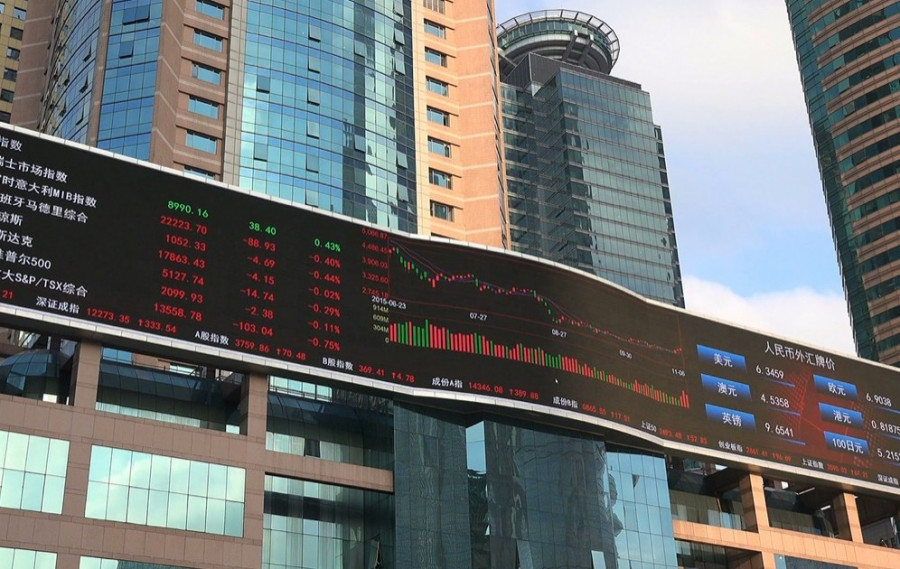
| Major Asian stock indices slide Posted: 09 Mar 2022 05:27 AM PST
Major Asian stock indices edged lower on Wednesday. China's Shanghai Composite and Shenzhen Composite Indices fell by 2% and 1.76% respectively. Hong Kong's main Hang Seng index lost 2.4%. At the same time, the Japanese and Australian indicators gained 0.7% and 1.16% respectively. Today, the Korean stock exchange is closed. Yesterday, South Korea's KOSPI advanced. Yesterday's statement by the US President on a ban on US imports of Russian oil and gas had a negative impact on the markets. Investors are pessimistic due to growing risks of possible energy shortages, which in turn could lead to another spike in oil prices and even higher inflation. The sanctions imposed by European countries and the United States against Russia have an adverse effect on their economies as they create disruptions to supplies and transportation. Investor sentiment is also hurt by internal statistics for the region. Thus, Japan's GDP rose by 4.6% on an annual basis and by 1.1% on a quarter-on-quarter basis (in the fourth quarter of 2021), lower than economists' median forecast for 5.6% and 1.4% gains. Among the Japanese listed companies, the top performers turned out to be Isuzu Motors Ltd. (+8.9%), Pacific Metals Co. (+4.5%), and SoftBank Group (+4.6%). Shares of Fast Retailing (+0.4%) and Toyota Motor (+2.5%) also added a little. At the same time, Sony Group Corp. shares slid by 1%, and Panasonic fell by 2.5%. In China, the main indicator of inflation - the consumer price index - rose by 0.9% in the previous month from a year ago and by 0.6% on a monthly basis. At the same time, analysts expected an increase of 0.3% month-on-month. The producer price index dropped to 8.8% last month from 9.1% in January on an annual basis, while economists predicted a 8.7% decline. Among companies listed on the Hong Kong stock exchange, the worst-performing stocks were Li Ning Co. (-9.6%), Anta Sports Products Ltd. (-8.7%), Hong Kong Exchanges & Clearing Ltd. (-6%), as well as China Petroleum & Chemical Corp. and China Mengniu Dairy Co. (-5.2% and -4.8% respectively). As for Australian companies, Mesoblast shares were up by 17%. Shares of other companies showed losses: BHP slid by 0.1%, Rio Tinto fell by 0.5%, South32 Ltd. declined by 1.6%, and Alumina Ltd. lost 1.5%. The material has been provided by InstaForex Company - www.instaforex.com |
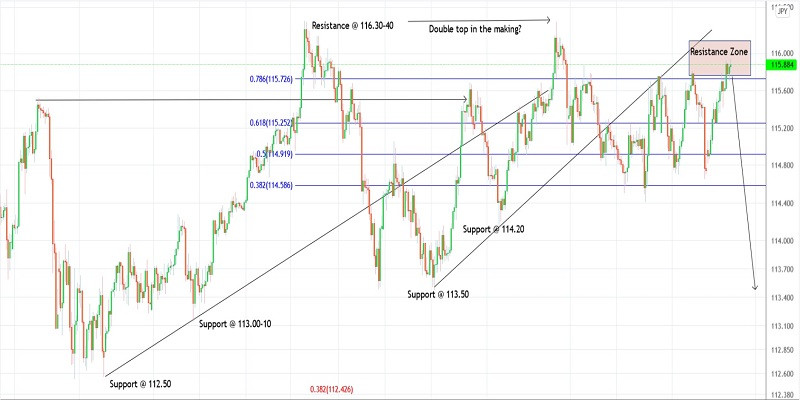
| Trading plan for USDJPY for March 09, 2022 Posted: 09 Mar 2022 05:20 AM PST
Technical outlook:USDJPY reached the resistance zone marked on the 4H chart around 115.90 levels on Wednesday. The currency pair is seen to be pulling back towards 115.80 mark and is expected to produce a bearish reversal from here. Bottom line remains 116.35-50 zone, which should remain intact for bears to be back in control. USDJPY has already carved a meaningful downswing between 116.35 and 113.50 levels early this year. Since then, prices have been consolidating within a range, carving lower degree downswing. The recent downswing which is being worked upon is between 116.34 and 114.40 levels respectively. USDJPY as tested resistance close to 115.90, just above the Fibonacci 0.786 retracement of the larger downswing as depicted on the chart here. If the above holds well, prices would stay below 116.35 and bears will drag lower towards 113.50 and 112.00 in the near term. Please note that medium term target is at least 109.00 mark. Trading plan:Potential drop through 109.00 against 118.50 Good luck! The material has been provided by InstaForex Company - www.instaforex.com |
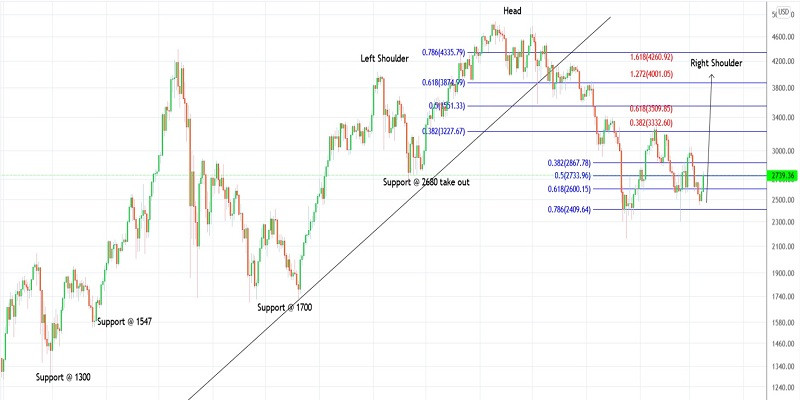
| Ethereum to face major resistance trend line once again. Posted: 09 Mar 2022 05:07 AM PST Ethereum is bouncing higher like most of the cryptocurrencies. Price is now at $2,736 having made a low around $2,445 and a recent high at $3,044. The red downward sloping resistance trend line is now at $2,865. In order to call a bullish signal, price must break above $2,865 and in order to confirm it, we need a break above $3,044.
Ethereum has so far tested the red resistance trend line more than three times and each time it got rejected. Price continues making lower lows and lower highs. Bears remain in control of the trend. In order for this to change, bulls will need to break above the red trend line. Support remains at $2,445 and bulls do not want to see it broken. Traders need to be patient. There are increased chances of a bigger bounce, but we have no confirmation yet. The material has been provided by InstaForex Company - www.instaforex.com |
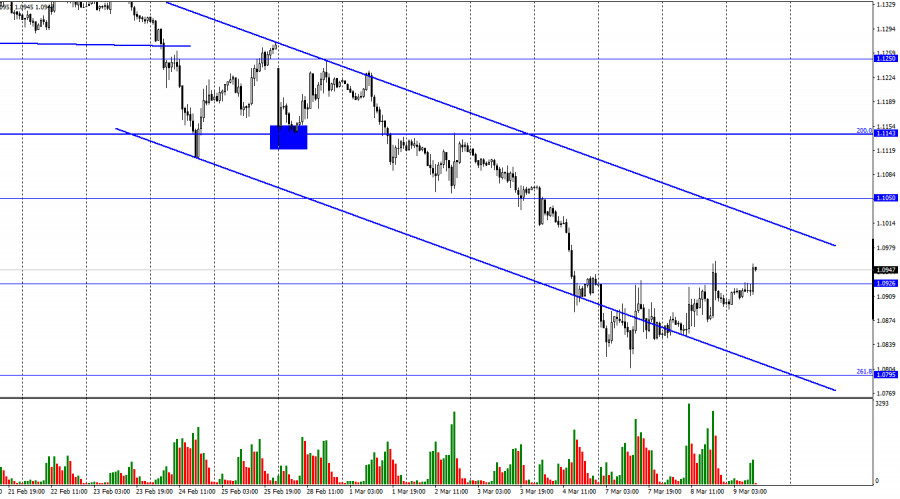
| EUR/USD Analysis and Trading Plan Posted: 09 Mar 2022 05:04 AM PST The dollar declined during today's Asian session. However, its decline is most likely corrective so far. Investors prefer defensive assets, including the dollar, against the background of events in Ukraine. The dollar index (DXY) reached its highest level in 21 months at 99.41 on Monday, and its growth, as economists expect, will continue. Meanwhile, oil and gas prices continue to break records in the market, threatening Western economies with a sharp increase in inflationary pressure. The euro looks vulnerable to the threat of Russia cutting natural gas supplies to European countries in response to the sanctions imposed. Since the beginning of the Russian military special operation in Ukraine, the price of natural gas in Europe has already increased by almost 200%, and this creates significant problems for the growth prospects of the Eurozone economy, economists say, expecting that the European economy will slow down significantly, unlike other major economies. The data published the day before states that in the 4th quarter of 2021, the eurozone's GDP grew by 0.3% (+4.6% in annual terms), which fully coincided with economists' expectations, provided moderate support for the euro. According to these data, the employment rate in the eurozone also increased in December (+0.5%, +2.2% in annual terms). However, these data correspond to the period before the start of Russia's military special operation in Ukraine. Now, the economic situation in the eurozone has deteriorated, and inflation has increased significantly, including due to rising energy prices. Thus, a barrel of WTI crude oil rose by 3.6%, above $123.00, and Brent crude exceeded $131.00 yesterday after Biden announced a ban on the import of Russian oil. The focus of investors' attention this week is the ECB meeting, which will end on Thursday with the publication at 12:45 GMT of the decision on interest rates. Economists expect annual inflation in the eurozone to peak at 6.2% in April (versus 5.8% in February and 5.1% in January). And earlier, the momentum of the eurozone economic recovery was weaker than in the U.S. Consumer spending and capital investment in the eurozone are at levels lower than before the pandemic, while U.S. figures have returned to what they were, according to ECB data. Most likely, the ECB will leave interest rates unchanged this year, despite the growing inflationary pressure, and this creates space for a decline in the euro. Thus, EUR/USD has been trading with a decrease of almost 3% since the military operation in Ukraine began, and yesterday the pair fell to 1.0805, corresponding to the lows of almost 2 years ago. Tomorrow at 13:30 GMT, the ECB press conference will begin, and it will be of main interest to market participants. ECB leaders will assess the current economic situation in the eurozone and comment on the bank's decision on rates. In previous years, following the results of some ECB meetings and subsequent press conferences, the euro exchange rate changed by 3%-5% in a short time. The soft tone of the statements is expected to have a negative impact on the euro. Today there is no important news in the economic calendar. In view of this, the corrective weakening of the dollar and the growth of EUR/USD may continue. At the time of this writing, EUR/USD is trading near the 1.0940 mark, above the local, almost 2-year low of 1.0805 reached on Tuesday. However, further growth of the pair above 1.1030 is likely to be difficult, and a breakthrough of the local support level of 1.0900 will open the way for a deeper decline. Technical analysis and trading recommendations As we noted above, after a sharp drop during the previous week, today EUR/USD is growing for the second day in a row, developing an upward trend towards the important short-term resistance level of 1.1031 (200 EMA on the 1-hour chart).
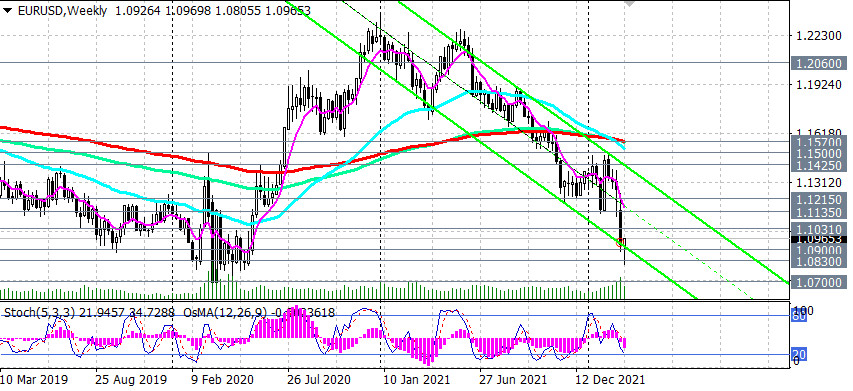
At the time of this writing, EUR/USD is trading near the 1.0970 mark, in the zone of almost 2-year lows, below the key resistance levels of 1.1570 (200 EMA on the weekly chart), 1.1500 (200 EMA on the daily chart).
Technical indicators OsMA and Stochastic on the 1-hour, 4-hour, daily charts turned to long positions.
However, the corrective growth will most likely be limited by the resistance level of 1.1031. If the decline resumes, the targets are local support levels of 1.0900 (the lower line of the descending channel on the weekly chart), 1.0830 (local lows), 1.0700 (March 2000 lows).
In an alternative scenario, the corrective growth will be delayed and will continue towards the resistance levels of 1.1135 (local lows), 1.1215 (200 EMA on the 4-hour chart). However, in the current situation, against the background of fundamental data, short positions remain preferable.
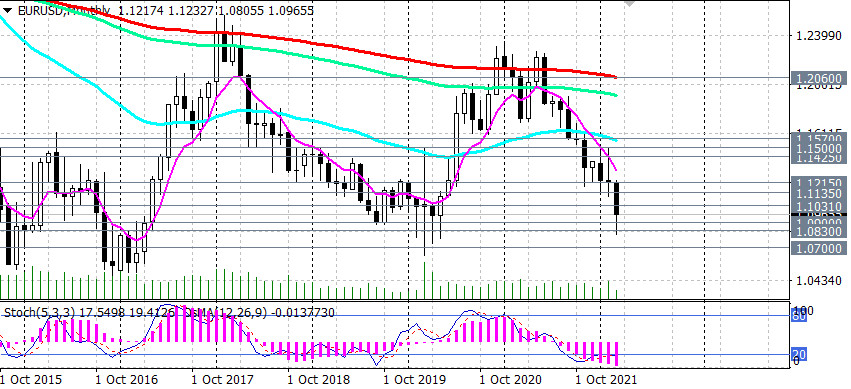
Only a breakdown of the long-term resistance level of 1.1570 (200 EMA on the weekly chart) can return EUR/USD to the long-term bull market zone with the prospect of growth to the resistance level of 1.2060 (200 EMA on the monthly chart). Support levels: 1.0935, 1.0900, 1.0830, 1.0700 Resistance levels: 1.1031, 1.1135, 1.1215, 1.1300, 1.1400, 1.1425, 1.1500, 1.1570 Trading Recommendations EUR/USD: Sell Stop 1.0930. Stop-Loss 1.1040. Take-Profit 1.0900, 1.0830, 1.0700 Buy Stop 1.1040. Stop-Loss 1.0930. Take-Profit 1.1100, 1.1135, 1.1215, 1.1300, 1.1400, 1.1425, 1.1500, 1.1570 The material has been provided by InstaForex Company - www.instaforex.com |
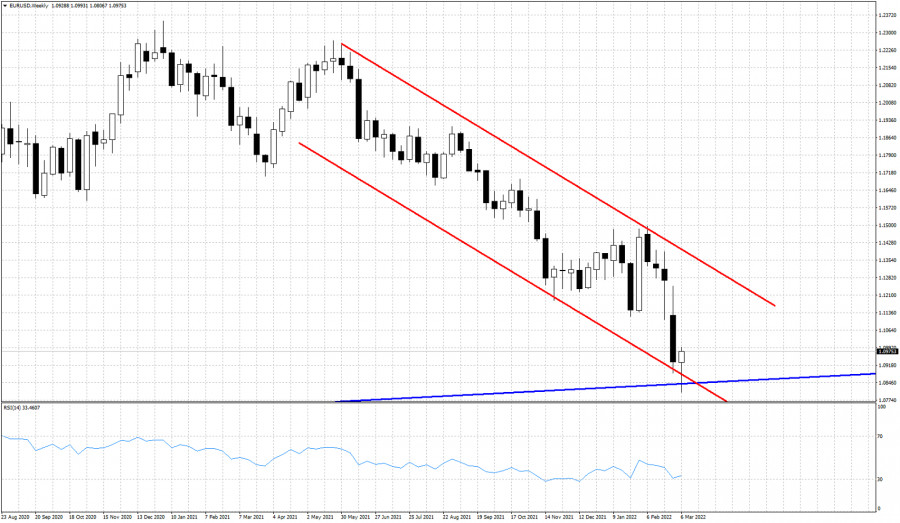
| EURUSD dead cat bounce or major reversal? Posted: 09 Mar 2022 04:59 AM PST EURUSD made a low just above 1.08 this week but is now turning higher relative to last week's close. There are two more trading sessions left for the week to end, so far price is forming a reversal candlestick pattern.
Blue line- major support trend line EURUSD is bouncing higher after testing the blue major support trend line connecting the 2017-2020 lows. Price remains inside the medium-term bearish channel but is bouncing off the lower channel boundary. The weekly candlestick pattern so far is promising for bulls as it forms a bullish hammer. If this week forms such a bullish candlestick pattern and next week is bullish as well, then we can say that there are increased chances of a major low being formed around 1.08. The material has been provided by InstaForex Company - www.instaforex.com |
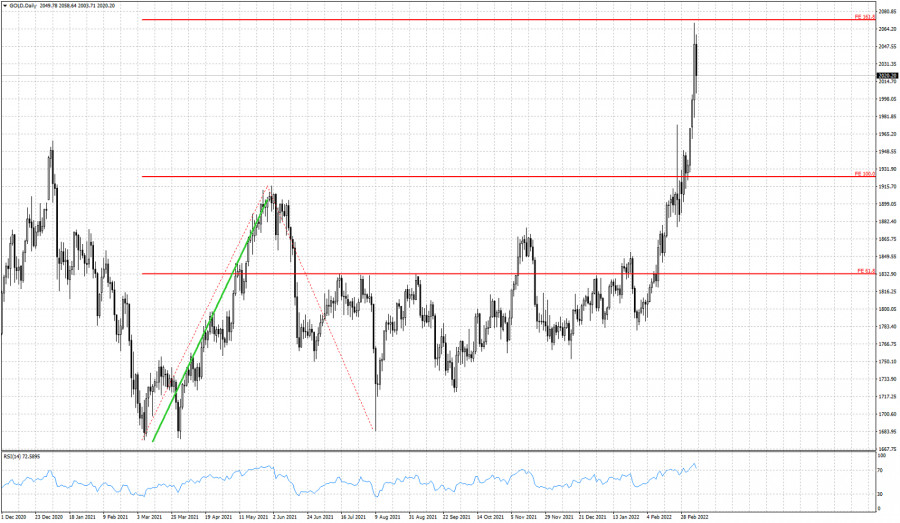
| Gold pulls back towards $2,000. Posted: 09 Mar 2022 04:55 AM PST Gold price made a high yesterday around $2,050 and in our latest analysis we warned traders that at least a short-term pull back was justified. Gold is now trading around $2,017 and there is potential for a move lower.
Green line - first upward movement Gold price has stopped the rise at the 161.8% Fibonacci extension of the first upward move. Technically trend remains bullish. As we mentioned yesterday, price was expected to make a pull back. Today we see this pull back and there is potential even for a move below $2,000. The RSI in the Daily chart has entered overbought levels and is turning lower. The last time this happened, Gold price fell from $1,915 to $1,683. Gold price has 38% Fibonacci retracement at $1,948 and there are increased chances of seeing the pull back reach that level. The material has been provided by InstaForex Company - www.instaforex.com |
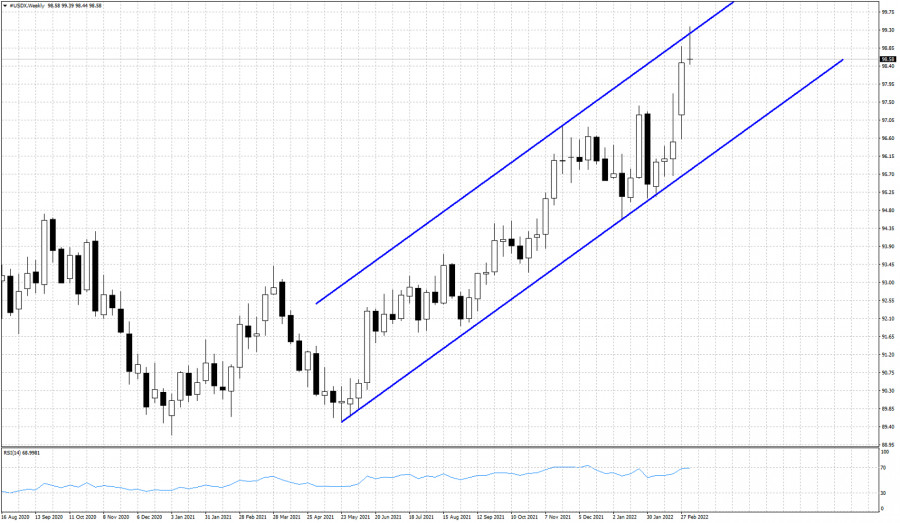
| Is the Dollar index preparing for a major reversal? Posted: 09 Mar 2022 04:47 AM PST In previous posts we warned US Dollar bulls that the index was approaching key resistance area and overbought levels. Price justified at least a short-term top around 99. This week price rose as high as 99.39 touching the upper channel boundary resistance. However price got rejected and is now forming a bearish candlestick pattern.
Blue lines- bullish channel Although technically trend remains bullish, we warned earlier this week that a reversal and a pull back are justified at current levels. So far price is forming a reversal candlestick with two more sessions left until the end of the week. The chances of creating a bearish hammer candlestick pattern are high. The chances of a reversal and a pull back are high. That is why we preferred a few days ago to turn neutral when price was at 99. A pull back towards the lower channel boundary is not out of the question. The material has been provided by InstaForex Company - www.instaforex.com |
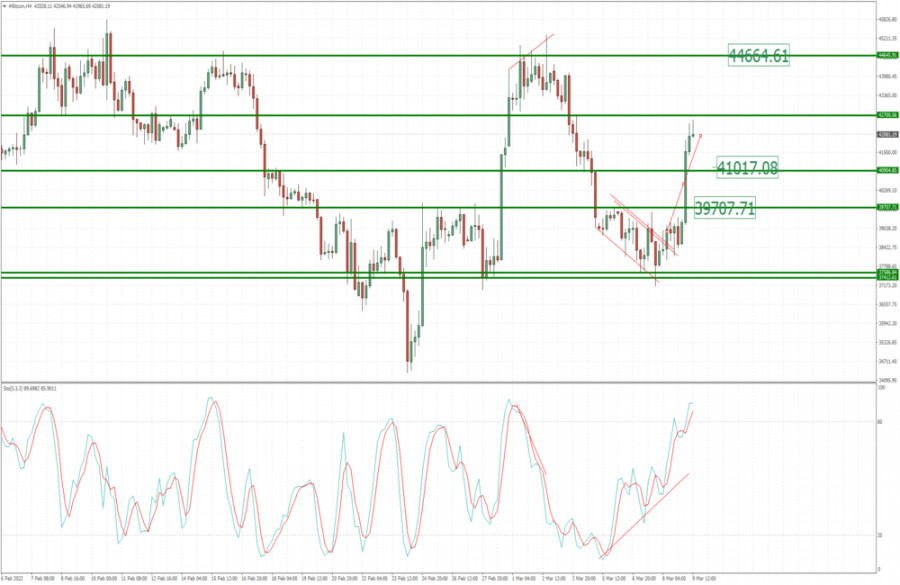
| BTC update for March 09,.2022 - Both upside objectives has been reached Posted: 09 Mar 2022 04:44 AM PST Technical analysis:
BTC has been trading upside as I expected. The price reached both upside objectives from yesterday at $39,700 and $41,000 and is heading towards third objective at $44,600. Trading recommendation: Due to strong upside momentum today, I see potential for further upside continuation after the downside correction. My advice is to watch for buying opportunities on the pullbacks using the intraday time-frames. Next main upside objective is set at the price of $44,665. Stochastic is in overbought area but with no divergence yet, which is indication of the strong upside condition. Key support is set at the price of $41,320 The material has been provided by InstaForex Company - www.instaforex.com |
| Video market update for March 09,,2022 Posted: 09 Mar 2022 04:21 AM PST Watch for downside continuational patterns on the USD/MXN.... The material has been provided by InstaForex Company - www.instaforex.com |
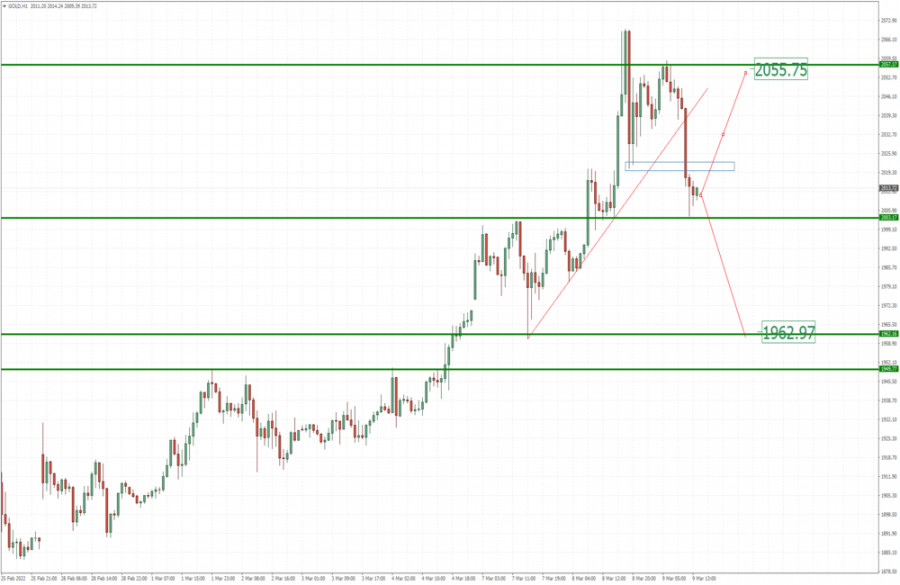
| Analysis of Gold for March 09,.2022 - Key pivot at the price of $2.003 on the test Posted: 09 Mar 2022 04:19 AM PST Technical analysis:
Gold has been trading downside this morning and there is the the test of the key support pivot at $2,003. Watch carefully for the price action at this key pivot to confirm further direction. Trading recommendation: In case of the downside breakout of the $2,003, watch for selling opportunities on the rallies with the downside objectives at $1,962 and $1,950. Additionally, there is the breakout of the well-defined rising trendline in the background, which is another sign for potential downside movement. In case of the rejection of the $2,003 and upside breakout of $2,025, watch for buying opportunities on the pullbacks with the upside objectives at $2,055 and $2,07 The material has been provided by InstaForex Company - www.instaforex.com |
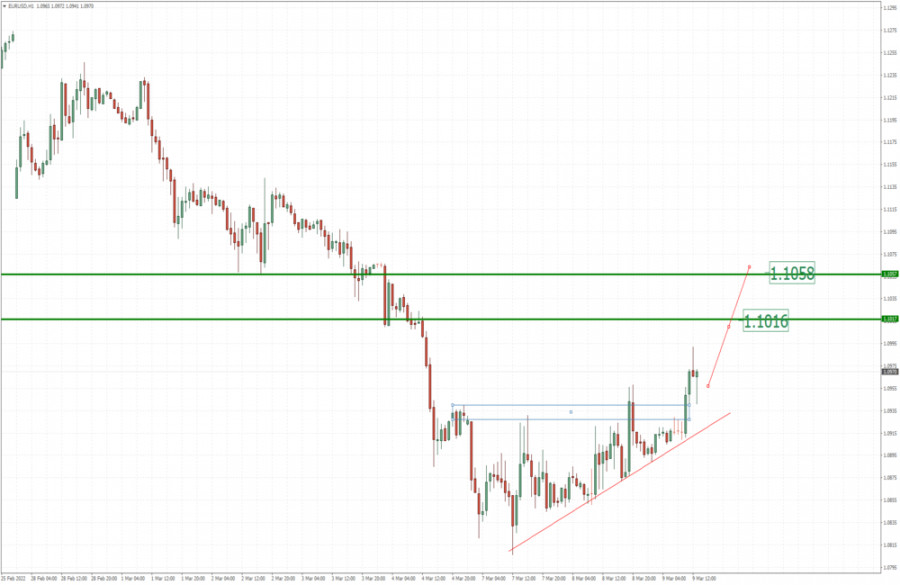
| EUR/USD analysis for March 09, 2022 - Upside breakout of the important pivot Posted: 09 Mar 2022 04:04 AM PST Technical analysis:
EUR/USD has been trading upside this morning and I found the breakout of the cluster resistance at 1,0945. I see further upside movement today. Trading recommendation: Due to strong upside momentum and breakout of resistance his morning, I see potential for further bullish continuation. Watch for buying opportunities on the intraday pullbacks with the upside objectives at 1,1016 and 1,1060. There is rising trend-line in the background successful rejection, which is another sign that buyers are in control. Key support at the price of 1,0850 The material has been provided by InstaForex Company - www.instaforex.com |
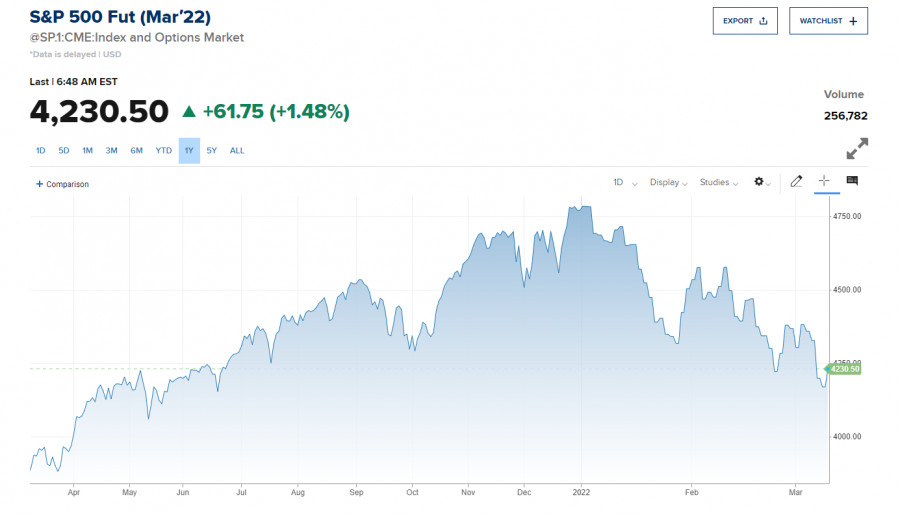
| US premarket on March 9: commodity prices drop and investors' worries ease Posted: 09 Mar 2022 04:00 AM PST US stock index futures showed strong gains on Wednesday even as investors were spooked by strong commodity price increases and high inflation. Dow Jones Industrial Average futures gained 510 points or about 1.6%. Futures on the S&P 500 jumped by 1.7% and futures on the Nasdaq 100 increased by 2.1%.
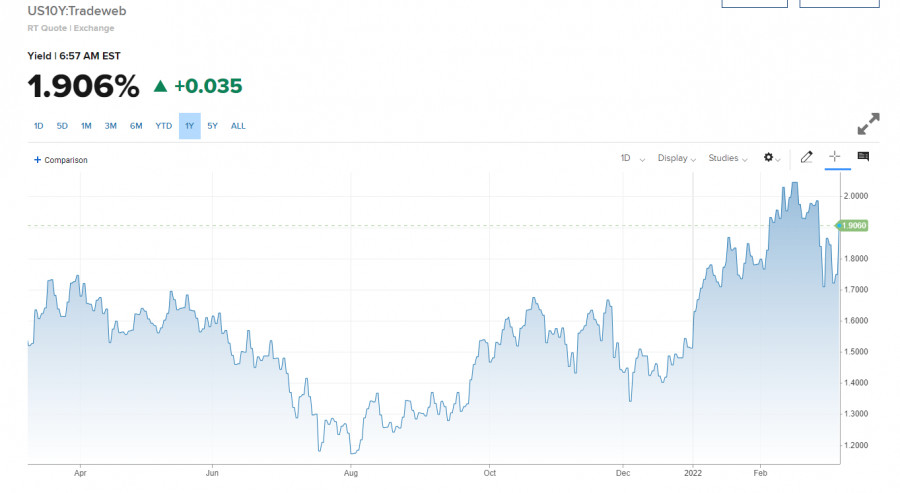
Most likely, the slight decline in commodity prices from their yearly highs, which scared the market a lot earlier this week, allowed investors to look at the bigger picture more clearly. However, it is hard to tell what traders will pick up next as the risks are everywhere: the low yields on Treasuries are clearly not going to save money from the 8.0% inflation rate that will likely be announced tomorrow. Energy and agricultural products rose amid Russia's military operation in Ukraine. Some metals also showed significant growth. Recently, President Joe Biden announced a ban on imports of Russian minerals, including oil, in response to the country's military operation in Ukraine. Immediately after that, the price of oil reached a 13-year high of $130. West Texas Intermediate, the US benchmark crude, declined by 2.2% to $120.92, while Brent crude, the international benchmark, dropped by 1.7% to $125.78. Wheat futures also fell sharply by 6.3% to $1,206 a bushel, but palladium and gold continued to rise. Palladium rose by 3.8% to $3,082. As for Treasury yields, they rose but it is temporary, as investors are focused on tomorrow's inflation data and expect more action from the Fed. 10-year bonds rose by about 3.7 basis points to 1.91%. All major indices closed lower yesterday. The Dow Jones ended the day with a decline by 184 points or 0.5%. The S&P 500 lost 0.7% and the Nasdaq Composite closed almost unchanged, declining by 0.2%.
Today, market volatility will be quite subdued, whereas yesterday, the excessive activity was caused by investors' uncertainty about what to expect from future energy prices. This has exacerbated fears of a slowdown in global growth as inflation rises. Many are worried that the Fed will not be able to make a soft economic landing, but judging by the growth rate so far, the central bank should be able to avoid a recession. The strength of the US labor market, consumer demand, and credit should keep the economy out of recession in the short term. However, it is difficult to say how the global economy will be hit due to sanctions on Russia. As for the S&P 500 technical picture The pressure on the index persists, and there is a lot of bad news amid almost a lack of good ones. Bulls failed to fix the price above $4,292 yesterday and they will try to do so today. If they fail today, the pressure on the index is likely to increase, which may cause a decline to $4,233. A breakthrough of this level is likely to increase pressure on the index and return bearish sentiment to the market. The asset may test new lows at $4,175 and $4,113. If the price reaches and fixes above $4,292, it gives hope for the market recovery, but what happens in the regular session today is a big question. In the case of growth, we may expect a new sell-off at $4,341 and $4,383. Much will depend on the development of the conflict in Ukraine and possible negotiations between the presidents of the two countries. The material has been provided by InstaForex Company - www.instaforex.com |
| Bitcoin: Fidelity explains why cryptocurrency volatility is good for investors Posted: 09 Mar 2022 03:55 AM PST Critics of Bitcoin call its volatility an unsolvable setback for digital gold to become a full-fledged investment asset. Analysts at Fidelity, the largest asset manager, decided to dispel this fear. They stated that despite the fact that "bitcoin is fundamentally unstable," this does not prevent it from fulfilling "its ultimate investment objective of preserving wealth over long time periods." What arguments does the global asset manager give to confirm the investment attractiveness of Bitcoin? I'll tell you in this review. The debunking of concerns about the volatility of cryptocurrencies was stated in Fidelity's latest issue of "The Research Round-Up." In its longer analysis, the company cited oil and gold as examples to explain the entire volatility process. Here are the highlights of the review. Fixed supply affects the priceFidelity states that "Bitcoin is unique in that it is a good whose supply is completely inelastic to changes in price. In other words, supply does not and cannot change in response to price." We are well aware that the mining limit is only 21 million bitcoins. And that's it, no more coins will be issued. Unlike other goods that have a cycle, which Fidelity explains this way: "Going back to economic principles, we know that when demand increases for a good, in the short-term the price will rise. However, the higher price then incentivizes suppliers to produce more. More supply will then bring down the price. With bitcoin, supply cannot change regardless of what price does. Therefore, any change in demand, short-term as well as long-term, will have to be reflected by changes in price." Therefore, in the situation with bitcoin, the laws of supply and demand can only affect the price, and they do. "There is no change in supply to dampen the effect of price moves, even over the longer-term." This is paired with the ever-dwindling supply of new coins due to halving, and you have the perfect recipe for what bitcoin proponents call "number go up technology." Fidelity sums up this argument like this: "Bitcoin is valuable because it has a fixed supply and it is also volatile for the same reason." These two features come in the same package. Bitcoin is a better store of value than the U.S. dollar"Something that has low volatility is not necessarily a good store of value in the long run, while something that has high volatility does not mean that it can't be a good store of value in the long run." It's easy to get scared of volatility. Investors, traders, and even true crypto enthusiasts let their feelings get in the way and exit the market at every little price spike. However, there is no one who has held Bitcoin for more than four years and is in the red. Literally nobody. Here's what experts from Fidelity say: "The U.S. dollar is not volatile but has also not been a good store of value in terms of purchasing power, while bitcoin is considered very volatile, but has been a much better store of value over the past ten and even five years." "Volatility is a byproduct of price discovery, and there is no other way for price discovery to happen in a free market." Even though Bitcoin is 13 years old, it is still in the process of determining the price. How much does it really cost? We won't know for years, even decades. "This process of individuals all coming to adopt bitcoin in different ways and timeframes necessarily must produce volatility," concludes Fidelity. Fidelity: Bitcoin volatility is decliningThe asset management company says the limited historical data currently available shows that volatility is declining in the long term. It was the same with gold at one time, analysts say. "As gold went through a major price discovery process in the '70s, which then resulted in amassing a larger base of investors, volatility naturally declined." However, sums up Fidelity, bitcoin is still early up to this point. And while the company does not provide financial advice, it notes that now it is worth learning how to manage the volatility of the cryptocurrency and use it to your advantage.
|
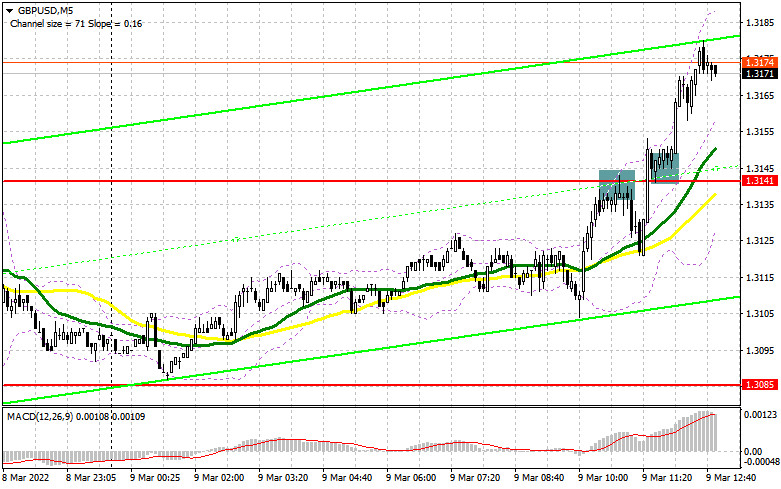
| Outlook for GBP/USD for US trade on March 9. GBP to exceed 1.3141 Posted: 09 Mar 2022 03:39 AM PST Conditions for opening long positions on GBP/USD Earlier, I recommended focusing on the level of 1.3141 to take decisions to enter the market. Let us take a look at the 5-minute chart to analyze the market situation. A failure to consolidate above the resistance level of 1.3141 formed a sell signal. However, the pound sterling showed an insignificant decline. After a drop of 15 pips, bulls became active again, thus allowing the currency to break and consolidate above 1.3141. As a result, traders had to close sell positions with small losses and open buy orders, expecting the continuation of the upward correction. By the moment I wrote the article, the pair had gained more than 35 pips.
Since the macroeconomic calendar is not rich in events today, the pound sterling may receive support only from expectations of positive results of the Ukraine-Russia talks. Of course, this will hardly cause a trend reversal. The rise could be explained by the fact that traders lock-in profits ahead of important news, including the US consumer price report that is slated for release tomorrow. Until the pound/dollar pair trades above 1.3141, it will have every chance to hit new intraday highs. In the second part of the day, buyers should protect the support level of 1.3141. If the pair drops to this level after the publication of the data on the US job openings and oil inventories, traders should wait for a false break and buy the pair, expecting a rise to 1.3194. If the price downwardly breaks this level, some bullish stop orders could be executed, thus supporting buyers. In this case, the pair may climb to 1.3244 and 1.3275. The level of 1.3314 could act as a farther target. However, the pair will be able to reach it only tomorrow after the publication of the US inflation report. We should also remember that the Bank of England is considering a key interest rate hike, which is a strong bullish signal for the pound sterling. If the pair drops and bulls fail to protect 1.3141, a pessimistic scenario is likely to come true. A break of 1.3141 is likely to increase pressure on the pair. In this case, it is better to avoid long positions until we see a false break. It is possible to buy the pound/dollar pair from 1.3034 or from 1.3976, expecting an upward correction of 20-25 within a day. Conditions for opening short positions on GBP/USD Bears will hardly regain control over the market soon. If the pair closes the day below 1.3141, pressure on the pound sterling will rise. The British pound is significantly oversold especially amid the future key interest rate hike by the BoE. That is why traders should be very cautious about opening short positions. Only in case of a false break of 1.3194, it is possible to sell the pound/dollar pair. The support level of 1.3141 will act as the main target. A downward break of the level will provide traders with a short signal with the target at 1.3085. The area of 1.3034-1.2976 is a farther target, where it is recommended to lock-in profits. If the pair continues climbing amid weak data from the US, it is better to avoid sell positions. A break of 1.3194 may lead to a surge in the pair amid new stop orders initiated by sellers. In this case, sell orders could be opened after a false break of 1.3244. It is possible to sell the pound sterling from 1.3275, expecting a change of 20-25 pips.
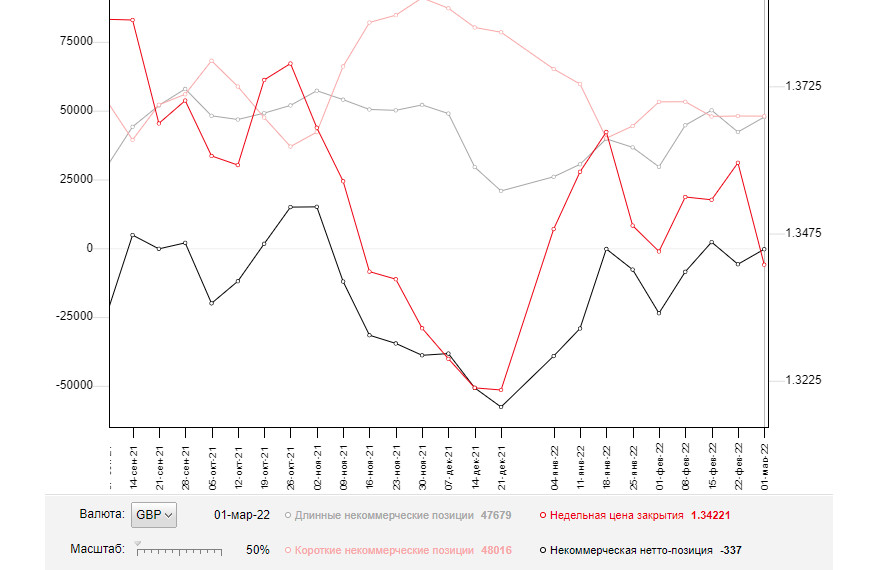
Commitment of Traders Report According to the COT report from March 1, the number of long positions soared, whereas the number of short ones slumped. Notably, under the existing conditions, such reports are of minor importance. Currencies may change by 100-200 pips a day amid the present geopolitical situation. Next report is likely to unveil a jump in short positions. That is why it is better not to take into account the current figures. There is no use to predict a further policy of the BoE and the US Fed. If the situation in Ukraine becomes worse, monetary policies will be of minor importance. Russia and Ukraine are holding a new round of negotiations. A lot will depend on the meeting results. However, it is obvious that high inflation in the UK will make the BoE take more radical measures. Since the economic growth is slackening and Russia is planning to take response measures, the regulator will hardly raise the benchmark rate more than expected. However, it is necessary to do so. Otherwise, people's savings will vanish. The COT report unveiled that the number of long non-commercial positions increased from 42,249 to 47,679, while the number of short non-commercial positions decreased from 48,058 to 48,016. The weekly closing price dropped to 1.3422 against 1.3592.
Signals of indicators: Moving Averages Trading is conducted just below the 30- and 50-day moving averages, which indicates that bears are still controlling the market. . Note: The period and prices of moving averages are considered by the author on the one-hour chart that differs from the general definition of the classic daily moving averages on the daily chart. Bollinger Bands If the price drops, the lower limit of the indicator located at 1.3085 will act as a support level. Description of indicators
|
| Forecast for EUR/USD on March 9. The situation continues to deteriorate. There is no economic news Posted: 09 Mar 2022 03:38 AM PST
The EUR/USD pair continued its weak growth process towards the upper boundary of the downward trend corridor on Tuesday. The pair's quotes have secured above the level of 1.0926, but this consolidation does not open up any special prospects for the bulls. It will be possible to count on a stronger growth of the euro currency only after consolidation over the descending corridor. In this case, the euro may continue to grow towards the levels of 1.1050 and 1.1143. However, the current information background does not allow us to assume a strong growth of the euro currency. Over the past day, there was no information background, which explains the attempt of traders to roll the pair up a little and the drop in activity. However, the lack of information background from the USA and the EU concerns only economic news and the calendar. Yesterday, it became known that Joe Biden, together with Congress, decided to abandon purchases of Russian oil, gas, and coal. The share of imports of these energy carriers from Russia to the United States is small, but this is an additional blow to the Russian economy, which is already going through its bad times. In addition, the central bank of the Russian Federation has banned the sale of foreign currency to Russians, as well as the withdrawal of more than certain amounts abroad. World rating agencies have lowered Russia's credit rating to "pre-default". In general, the situation is not improving, and world markets continue to be in a state of shock. While we have a small pause, the European currency may rise, but tomorrow this pause will end. A very important consumer price index in the US will be released on Thursday, and the results of the ECB meeting will also be announced. Although it is not necessary to expect much from the European Regulator now, information concerning the impact of the Ukrainian-Russian crisis on the European economy may sound from the lips of Christine Lagarde. That is, the EU Central Bank may adjust its monetary policy, which did not imply an interest rate increase in 2022. Inflation in the EU is likely to continue to grow, as the price of oil and gas, which are actively used in the European Union, is growing very much.
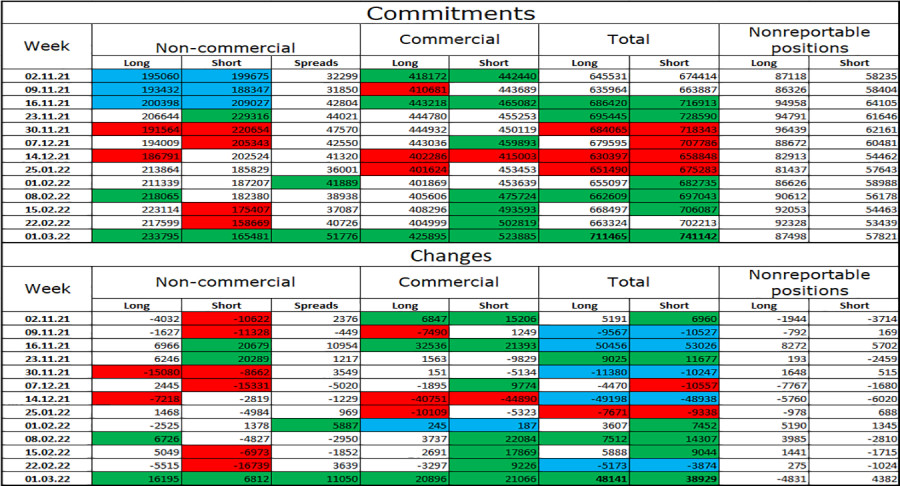
On the 4-hour chart, the pair performed a drop to the corrective level of 200.0% (1.0865) and rebound from it, which allows traders to count on a reversal in favor of the EU currency and some growth of the pair in the direction of the corrective level of 161.8% (1.1148). Closing at 1.0865 will work in favor of the US currency and increase the likelihood of further decline towards the next level of 1.0638. Commitments of Traders (COT) Report:
Last reporting week, speculators opened 16,195 long contracts and 6,812 short contracts. This means that the bullish mood has intensified. The total number of long contracts concentrated on their hands now amounts to 233 thousand, and short contracts - 165 thousand. Thus, in general, the mood of the "Non-commercial" category of traders is also characterized as "bullish". This would allow the European currency to count on growth, if not for the information background, which now supports only the American currency. We are now witnessing a paradoxical situation: the bullish mood of major players is increasing, while the currency itself is falling. And it falls very much. Thus, only geopolitics matters now. News calendar for the US and the European Union: On March 9, the calendar of economic events of the European Union and the United States does not contain a single interesting entry. Thus, the influence of the information background on the mood of traders today will be absent. I don't expect any geopolitical news today either. EUR/USD forecast and recommendations to traders: I recommend new sales of the pair when rebounding from the upper limit of the descending corridor on the hourly chart with a target of 1.0795. It is also possible to sell the pair when closing below the level of 1.0865 on the 4-hour chart. I do not recommend buying a pair, as the probability of a new fall in the euro currency is too high. The material has been provided by InstaForex Company - www.instaforex.com |


| You are subscribed to email updates from Forex analysis review. To stop receiving these emails, you may unsubscribe now. | Email delivery powered by Google |
| Google, 1600 Amphitheatre Parkway, Mountain View, CA 94043, United States | |


Comments