Forex analysis review
Forex analysis review |
- Remembering the Fed and waiting for a new fall.
- Bitcoin is falling again and geopolitics does not save.
- Analysis ofGBP/USD on March 5. The pound has broken through an important level and is ready for a new decline.
- GBP/USD weekly analysis for February 28 – March 4. COT report. GBP struggles to hang on
- Analysis of EUR/USD for February 28-March 4. COT report. EUR tumbles by 300 pips
- Gold has reasons to climb to $2,000
- US stock market under pressure from Russia-Ukraine conflict
| Remembering the Fed and waiting for a new fall. Posted: 05 Mar 2022 07:29 PM PST
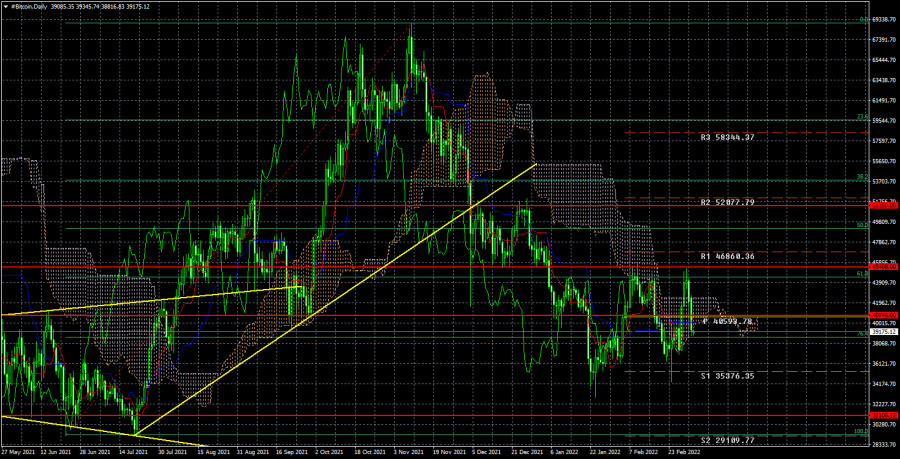
On the 24-hour TF, the technical picture for bitcoin looks even worse. First, the price bounced three times from the important level of $ 45,408 and the Fibonacci level of 61.8%. Second, the price has already gone below the Senkou Span B and Kijun-sen lines. Third, on the daily TF, the last round of growth looks just like an upward pullback. Therefore, we believe that now there is not a single technical sign of the emergence of a new "bullish" trend. Yes, bitcoin surprised us by showing an increase of $ 10,000 in the period from February 24 to March 2, but this does not mean that we have now taken a course of $ 100,000, as pseudo-experts like to say in any situation. We believe that now bitcoin will try to return to the lows of the year and try to move to the level of $ 31,100. Further, the scenario is known: either a rebound or overcoming. Let's remember about the Fed and the tightening of monetary policy. In the last two weeks, everyone has completely forgotten about the Fed and that this organization, which performs the functions of the central bank in the United States, is going to tighten monetary policy at almost every meeting in 2022. That is, we are talking about the first tightening since 2019 - the first tightening in the last 3 years. In the last three years, when bitcoin built a new upward trend, within which it managed to update its absolute value maximums, the Fed either lowered the rate or adhered to ultra-low rates, almost zero. Naturally, this was a huge plus for any risky investments, especially considering the QE program, which pumped up the American economy with hundreds of billions of dollars for 2 years. Therefore, from our point of view, it is not at all surprising that bitcoin grew during this period. But now times are changing. The QE program is over, rates will rise no matter what pace, and this summer the Fed may start unloading its balance sheet, which will mean the withdrawal of excess money from circulation. This will negatively affect inflation. And what do we have in the end? The conditions for investing in risky instruments deteriorate at times. Bitcoin will no longer be used by investors to hedge inflation, as inflation will begin to decline sooner or later. The money supply will decrease, which means there will be less money to invest. Thus, we believe that bitcoin has already entered a new cycle of decline for itself, which will last at least a year.
In the 24-hour timeframe, the quotes of the "bitcoin" failed to overcome the level of $ 45,408 and began a new round of downward movement within the framework of the downward trend that has been observed for 4 months. There are no obstacles on the way to the $ 31,100 level. If traders manage to overcome it, then the drop in quotes of the "bitcoin" will continue almost guaranteed. Geopolitics continues to deteriorate, so there are fewer reasons for bitcoin to grow, too. The material has been provided by InstaForex Company - www.instaforex.com |
| Bitcoin is falling again and geopolitics does not save. Posted: 05 Mar 2022 07:29 PM PST
The bitcoin cryptocurrency surprised a lot in the period from February 24 to March 2. It was surprised by the fact that during the sharp aggravation of the geopolitical situation in the world, it showed impressive growth. Recall that before the start of the Ukrainian-Russian conflict, we repeatedly said that the fundamental background of 2022 will not contribute to the growth of bitcoin and you can forget about updating its value for a couple of years. When the "geopolitical chaos" in Eastern Europe began, the chances of bitcoin's growth fell even more, since bitcoin is the most risky asset of all currently known to mankind. It should have started the fall in the first place. However, as it often happens, it turned out exactly the opposite. Bitcoin has grown by $ 10,000. What was it? From our point of view, something happened that no one could have predicted. Unprecedented sanctions were imposed against the Russian Federation, many banks were blocked from accessing SWIFT, the central bank's gold and foreign exchange reserves were blocked, the Russian ruble flew into the sky, and the stock market simply collapsed. Naturally, in such a situation, ordinary (and not only) Russians rushed to save their rapidly declining assets. This also applies to shares of Russian companies and cash, which began to depreciate at an alarming rate. And since the US dollar is already quite difficult to find in the Russian Federation, the eyes fell on the most popular cryptocurrency - bitcoin. Ukraine also added "oil to the fire". Exactly for the same reasons. There is a full-scale war going on in the country, respectively, investors are fleeing the economy. They also often run through cryptocurrencies. That is why we observed the growth of the "bitcoin" at a time when it should have been falling at the speed of the Russian ruble. However, the situation is changing now. Cryptocurrency exchanges are beginning to restrict Russians' access to cryptocurrencies. The first shock has already passed and those who had real capital and real opportunities to convert them into cryptocurrency have already done so. And now bitcoin can show the movement that was supposed to happen. That is, the fall. Earlier, we have repeatedly said that we expect a fall to the level of $ 31,100, where the future fate will be decided. This level is the minimum of last year, which was reached last summer. Presumably, mass purchase orders are located at this level, and investors consider it as a very good price for purchases. Therefore, if the bulls manage to keep the price above this level, then bitcoin will be saved. If not, the fall will continue with renewed vigor. So far, bitcoin has dropped only to the level of $ 39,000, which in the current circumstances can be considered just an achievement. However, there is another important factor. The price failed three times to overcome the level of $ 45,408 and the nearby Fibonacci level of 61.8%. That is, at least two strong sales signals were received. In addition, bitcoin failed to update its previous local maximum, which was reached on February 10.
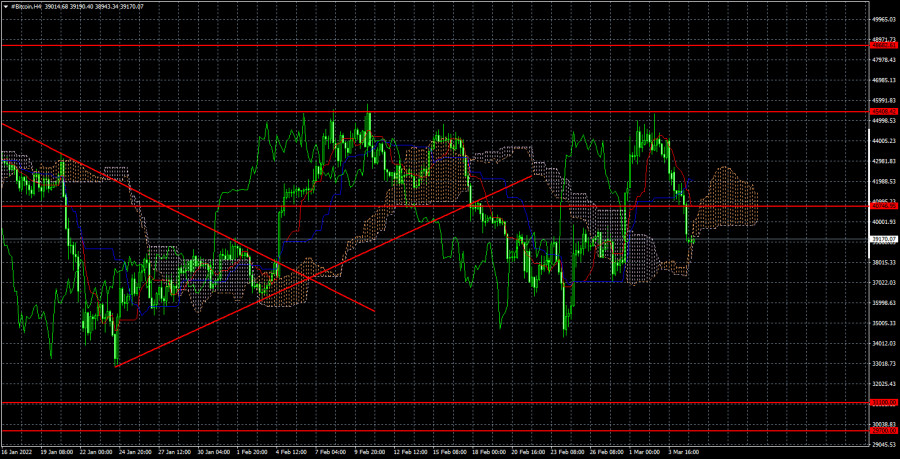
The trend on the 4-hour timeframe has changed to a downward one. The price dropped below the trend line, below the Ichimoku cloud, and the $ 40,746 level. Thus, now the way is open for her to the level of $ 31,100, and we recommend selling cryptocurrency at this time. So far, there is no reason to expect a recovery of the "bullish" trend. Absolutely all factors, technical, fundamental, geopolitical, speak in favor of the fact that the fall will continue. The material has been provided by InstaForex Company - www.instaforex.com |
| Posted: 05 Mar 2022 04:56 AM PST
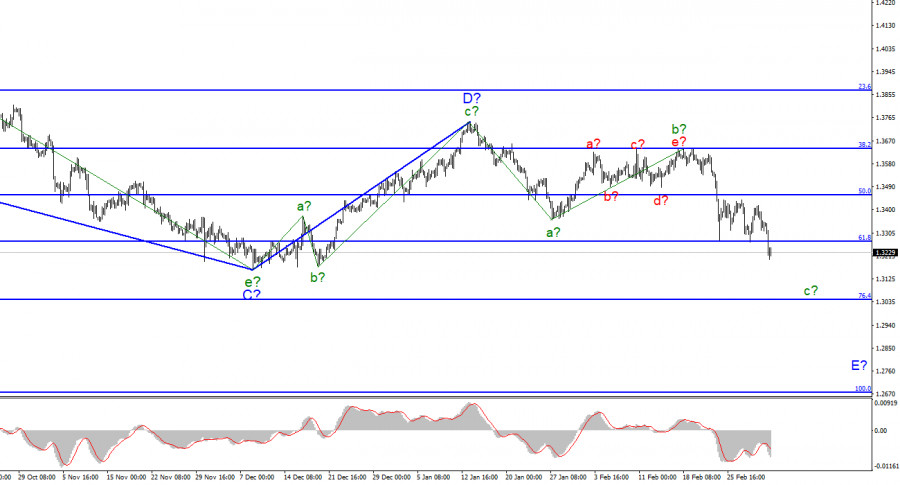
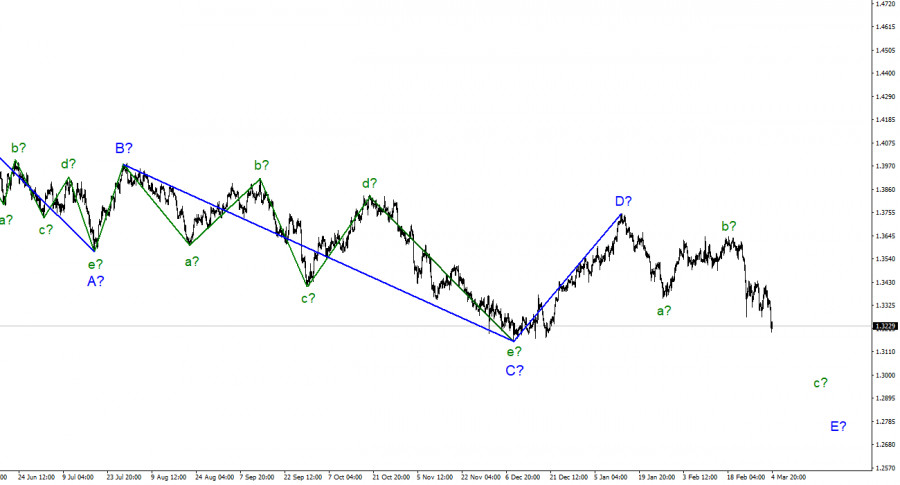
For the pound/dollar instrument, the wave markup continues to look very convincing, although it is quite difficult. The supposed wave b-E of the downward trend segment became much more complicated, but after several unsuccessful attempts to break through the 1.3642 mark, it still ended. The decline in quotes in the last week indicates a transition to the construction of wave c, which can also turn out to be very long. At the moment, the low of the expected wave a has been broken, so the construction of the downward trend section continues for sure. And necessarily within the framework of wave E. Thus, the entire downward section of the trend has acquired a five-wave form, and its intended wave E should also acquire a five-wave form. Hence, adopt a rather extended structure. A successful attempt to break through the 1.3275 mark indicated that the market was ready for new sales. Wave c-E does not look completed yet - it is too short, and the current news background continues to increase demand for the dollar. And again, geopolitics. The exchange rate of the pound/dollar instrument decreased by 125 basis points during March 4. In my review of the euro/dollar, I touched on the topic of economic statistics from America only in passing, but the statistics turned out to be very important, so we will analyze it in more detail. Let's start with the British report on business activity in the construction sector. It rose to 59.1 at the end of February, but the British did not show a single bullish candle during Friday. That is, the market did not pay any attention to this report. The next in line was data from America. The most important Nonfarm Payrolls report turned out to be significantly better than market expectations, accounting for 678 thousand new jobs outside agriculture. The unemployment rate dropped from 4% to 3.8%. These two reports were already enough to make the demand for the US currency grow even stronger. Therefore, Friday became a "black" day for the euro and the pound, and instead of an upward pullback on Friday evening (which often happens), we saw a new decline. At the same time, geopolitics does not leave the minds of market participants. The situation in Ukraine, if it has not escalated in recent days, then it is not improving. Thus, the market is still in a very nervous state, and the direction of movement of both instruments that I am observing perfectly shows what the mood of the market is now. From my point of view, there are simply no alternative options for the development of the situation. For the first time in a very long time, almost all factors say an unambiguous "down". Judge for yourself. The wave pattern implies the construction of another descending wave, which can take a very extended form. Geopolitics puts pressure on the euro and the pound in the first place, while the US dollar is just in demand. The geopolitical conflict in Ukraine may persist for many months. Already on March 15-16, the Fed may raise the interest rate and begin a course to bring it to 2-2.5%. At the same time, the Bank of England does not plan to raise the rate higher than 1% in 2022. All the trumps are in the hands of the Americans. General conclusions. The wave pattern of the pound/dollar instrument assumes the construction of a wave E. The instrument made two unsuccessful attempts to break the 1.3645 mark, but the third was successful. Therefore, I continue to advise selling the instrument with targets located around the 1.3046 mark, which corresponds to 76.4% Fibonacci, according to the MACD signals "down", since the wave c-E does not look complete yet.
On the higher scale, wave D also looks complete, but the entire downward section of the trend does not. Therefore, in the coming weeks, I expect the instrument to continue to decline with targets below the low of wave C. Wave D turned out to be a three-wave one, so I cannot interpret it as wave 1 of a new upward trend segment. The material has been provided by InstaForex Company - www.instaforex.com |
| GBP/USD weekly analysis for February 28 – March 4. COT report. GBP struggles to hang on Posted: 05 Mar 2022 01:25 AM PST Long term
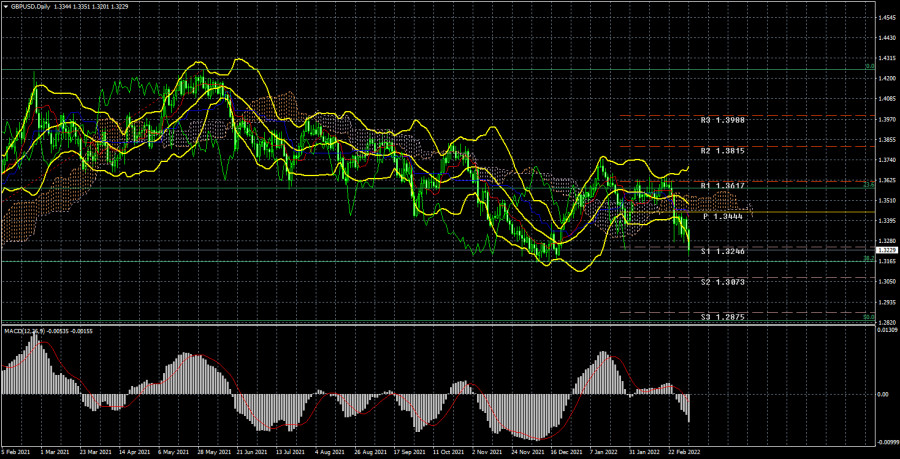
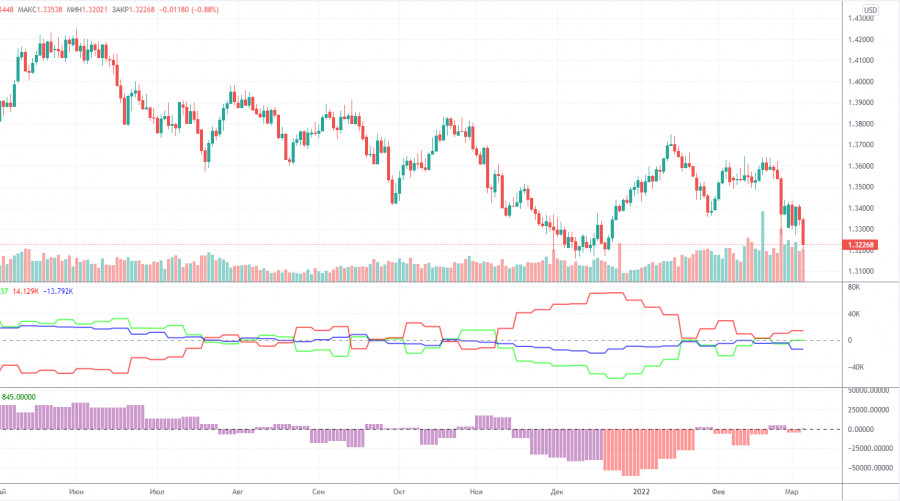
The GBP/USD pair has fallen by 180 points this week, which is still not so bad in the current situation. The pair could not retest its previous local low of December 8 at the 38.2% Fibonacci level. Therefore, the British pound declined by just 38.2% after having developed an uptrend in 2020. At the same time, the euro has overcome the Fibo level of 76.4% and is now heading for 100%. Compared to this, the losses of the pound seem to be less significant. On a larger scale, this downward movement is just a short-term correction. Yet, the sterling is still at risk of declining further against the US dollar. Its further trajectory will largely depend on the geopolitical background. GBP is considered a risk asset, so it tends to fall against USD in times of uncertainty. At the same time, the pound/dollar pair has strong support that could keep it from falling deeper. This is the level of 38.2% at 1.3161, from which the price has already rebounded. We have mentioned several times that the pound remains rather strong against the US dollar compared to the euro, for example. This trend is still relevant today. As for the macroeconomic reports, they were mostly downplayed by market participants. The same is true about the fundamental background. The situation in Ukraine is not improving, although there has been less fire in recent days. This can be either a slight de-escalation of the conflict or the calm before the storm. Negotiations between Moscow and Kyiv continue. Let's hope that the two sides will reach an agreement. COT analysis
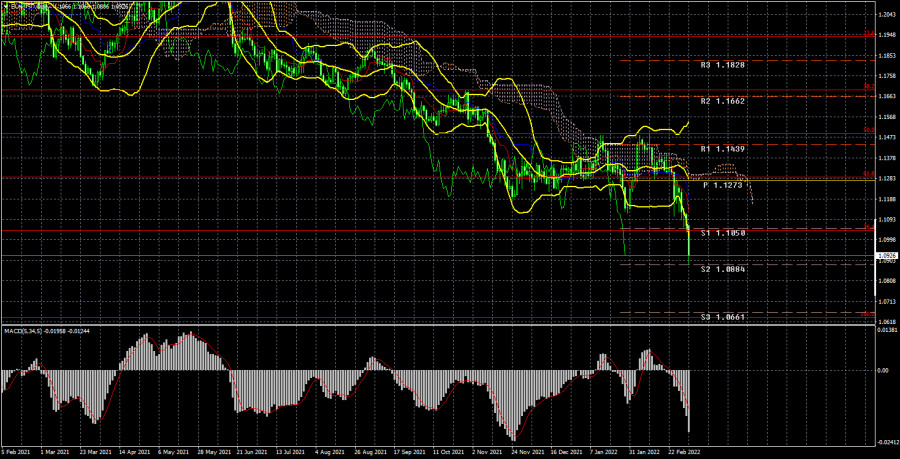
The latest COT report on the British pound showed that professional traders became more bullish on the pair. A week earlier, their sentiment was more bearish. In general, the sentiment of major market players is changing too quickly, which is clearly displayed by the two indicators in the picture above. At the moment, the net position of the non-commercial group of traders is close to the zero level which means a neutral sentiment. This is also confirmed by the total data on the number of open contracts. There are currently 51,000 buy contracts and 50,000 sell contracts. As you can see, the difference is minor. Moreover, since July last year, professional traders are struggling to decide on how to trade the pound. In December, the bearish trend strengthened notably, thus leading to a significant fall in the UK currency. The rest of the time, traders are hesitating to choose one direction. Therefore, the fact that the pound has not developed a strong decline partly corresponds to the COT reports. However, we still believe that the COT report is not the best data to base your forecast on. Now, the demand for the US dollar is rapidly rising all over the world. So, it would be wise to expect its further rally regardless of what the COT report is showing. Actually, this is exactly what is happening to the euro now: buy positions on the euro are increasing but the currency is falling nevertheless. So, geopolitical news remains the main focus at the moment. Fundamental analysis The economic calendar in the UK was almost empty last week. As expected, three indices of business activity published this time did not cause any reaction in the market. In the US, the economic data was more encouraging. Yet, we cannot say for sure that the pound's fall was attributed to the strong data from the US. At the same time, this could well be the reason. For example, on Wednesday, when Jerome Powell spoke, the pound gained ground right after that. What we can say for sure is that the pound is falling less rapidly against the dollar compared to other majors. This can mean that GBP traders still take into account the macroeconomic and fundamental backgrounds that are not always in favor of USD. At the moment, it is better to refrain from making conclusions based on fundamental factors since market sentiment largely depends on geopolitics. Markets may shortly react to some key reports but this reaction is unlikely to change the prevailing trend. Trading plan for March 7 - 11: 1) The pound/dollar pair has now resumed the downtrend as it has firmly settled below the Ichimoku Cloud Senkou Span B and the Kijun-sen indicator lines. Now the key level for the pair is 1.3161. Further direction of the pound depends on whether the price will overcome this support or not. If the pair breaks below this level, the pound may continue to fall towards 50.0% Fibonacci at 1.2827. Therefore, selling the pair seems the best option for now. 2) The likelihood of an uptrend has decreased significantly over the past week. First of all, this is confirmed by technical analysis. In its latest round of growth, the pair failed to retest its previous local high. So, it was just a correction, which will be then replaced by the main trend. Accordingly, the fall of the quotes below the previous local low is almost inevitable. Therefore, buying the pair is not relevant now. Description of indicators: Support and resistance levels, as well as Fibonacci levels, are the levels that serve as targets when buying or selling the pair. You can place a Take Profit near these levels Ichimoku Indicators (standard settings), Bollinger Bands (standard settings), MACD(5, 34, 5). Indicator 1 on the COT chart indicates the size of the net position of each category of traders. Indicator 2 on the COT chart indicates the size of the net position for the non-commercial group of traders. The material has been provided by InstaForex Company - www.instaforex.com |
| Analysis of EUR/USD for February 28-March 4. COT report. EUR tumbles by 300 pips Posted: 05 Mar 2022 12:41 AM PST Long-term prospect
This week, the euro has nosedived by 300 pips. The currency closed every trading day with a decline. It is a real slump that is perfectly seen on the daily chart. Since the beginning of the downtrend, which has been lasting for 14 months already, a decline that was recorded during the last two weeks has been the most considerable one. The euro and some other currencies are actively losing value amid the current geopolitical situation. In addition, the euro and the pound sterling are riskier assets compared to the US dollar. The better part of international transactions is performed in dollars. If people need to invest funds, they usually choose the greenback. There is no wonder that the US currency is rising. Investors are selling off risky assets and buying the greenback. Analysts have noticed the capital inflow from Russia and Ukraine. People are buying dollars to protect themselves from inflation and devaluation of the Russian ruble. That is why European currencies have no reason to grow. Of course, the US dollar cannot climb for a long time. A correctional process will begin sooner or later. However, at the moment, the downtrend is likely to prevail among the European currencies. We should also remember that while the Fed is planning to raise the benchmark rate, the ECB has no intention to change its policy. It is another factor that is supporting the US dollar. COT report
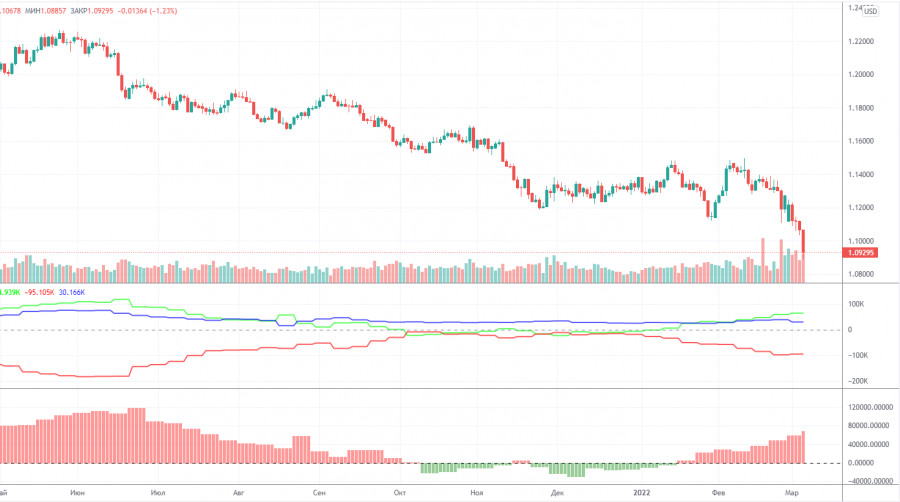
The COT report published on Friday showed a rise in the bullish sentiment among professional traders. This time, non-commercial traders opened about 16K buy positions and 6.8K sell positions. Thus, the overall number of buy contracts exceeds the number of sell contracts by 70K. That is why we can assume that a new bullish trend has started its formation. A decline in the European currencies is the only problem. We can see that demand for the euro is mounting, whereas the currency is losing value. This means that demand for the US dollar is rising faster than demand for the euro. The fact is that now the US dollar is used as a safe-haven asset worldwide. Demand for the greenback is surging amid geopolitical tensions. That is why at present, we cannot use the COT reports to forecast a further movement of the euro/dollar pair. The report does not simply meet the real state of affairs. We have to wait for the end of the conflict in Eastern Europe. Analysis of fundamental events This week, there has been a lot of important macroeconomic and fundamental information. However, it failed to influence the market situation. In other words, the euro/dollar pair was moving only in one direction. Notably, the market reacted to some news, thus pushing up the greenback. For example, a strong report on the US non-farm employment change allowed the US dollar to gain in value later on Friday. In addition, Jerome Powell has provided two speeches this week. However, his comments could hardly be called hawkish. This should have pushed the US currency lower. Christine Lagarde also provided several speeches. The US and the EU disclosed their services and manufacturing PMI reports, whereas the EU unveiled its inflation figures for February. Nevertheless, the pair has been falling. Thus, both macroeconomic and fundamental factors have no effect on the market at the moment. Trading plan for March 7-11. 1) On the daily chart, the pair continues losing value amid the current geopolitical situation. By the moment, the pair has passed the 76.4% Fibonacci level. It is likely to hit 1.0637, the 100.0% Fibonacci level. 2) Now, it is not a good idea to buy the euro/dollar pair. Firstly, there are no signs that the pair may begin the upward correction. Secondly, the market is ignoring the macroeconomic data that may support the euro. Thirdly, geopolitical tensions are likely to retain their pressure on traders and investors, who still believe that the US dollar purchases are the only way out. Description of indicators Support and resistance levels as well as Fibonacci levels are targeted levels for buy or sell orders. It is possible to set a take-profit order near these levels. Ichimoku indicators (standard settings), Bollinger Bands (standard settings), MACD (5, 34, 5). Indicator 1 on the COT charts is the net position size of each category of traders. Indicator 2 on the COT charts is the net position size for non-commercial traders. The material has been provided by InstaForex Company - www.instaforex.com |
| Gold has reasons to climb to $2,000 Posted: 05 Mar 2022 12:04 AM PST
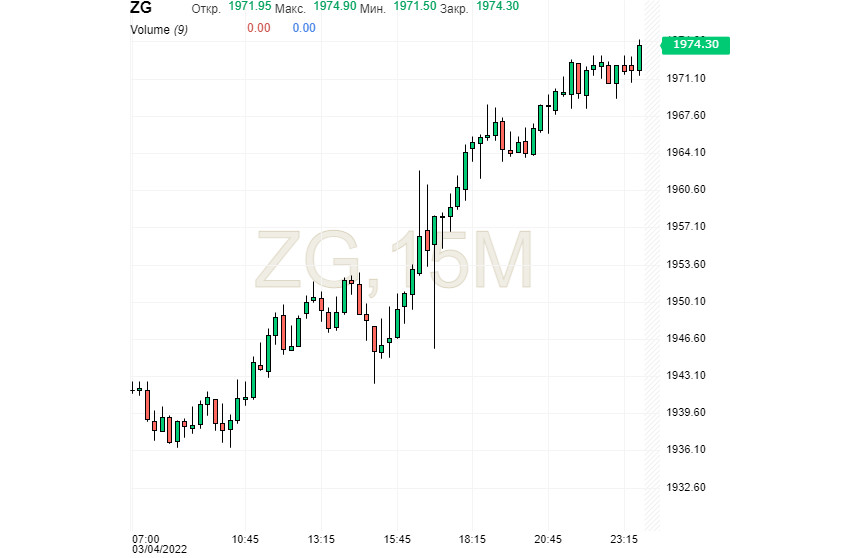
Gold closed the trading week on a positive note, approaching new all-time highs. Experts suppose that demand for the precious metal will rise amid the geopolitical tension and instability. In February, traders were actively buying gold. The metal proved to be a reliable safe-haven asset. On February 24, gold prices reached their high near $1,975 per troy ounce. Since then, the upward trend has been prevailing. Analysts have grounds to say that a downward correction, that took place for almost a year, was replaced by an uptrend. This may push the price to new historic peaks. On March 3, the precious metal soared amid a rise in the number of long positions. According to the gold futures market, the number of long positions surged by 5.2 thousand. In the near future, gold prices are likely to go on climbing. However, the price may show a short-lived stagnation. Notably, at the end of the week, the asset was trading at $1,974, whereas on Friday, it was hovering near $1,970, trying to break through the barrier.
Most analysts are sure that in the near future, the precious metal will show the strongest growth in the last year and a half. The military conflict in Ukraine is the main driver of gold prices. The escalation in the conflict resulted in greater demand for safe-haven assets. During the week that ended on March 4, gold appreciated by almost 4%, though it is not the ceiling. Analysts emphasize two factors that may cause a rally in gold prices: surging inflation and geopolitical situation. Notably, in the US, inflation jumped to 40-year highs and it continues accelerating. Analysts recommend investing in gold. The precious metal is an important inflation barometer and the best safe-haven asset. At present, the precious metal is strongly reacting to the geological crisis, including the Russia-Ukraine conflict. Gold is benefiting from the existing instability. The asset has become the main component of an investment portfolio due to recent events. According to preliminary estimates, in the next 6 months, gold may soar to $1,800-$1,900 per troy ounce. In the short term and mid term, the metal may even exceed $2,000. In the short term, gold may be hovering near $1,900. However, a sideways channel is the first step towards the highs recorded in August 2020, when the price hit $2,063. Gold may reach new highs amid the rising inflation. Geopolitical and economic risks are boosting gold. However, the US Fed is also contributing to higher prices. It is quite possible that the key interest rate hike will support the US dollar, which, in turn, may cause a decline in gold prices. However, the current geopolitical situation has a strong influence on the market. Thus, the precious metal has every chance to hit new all-time highs. The material has been provided by InstaForex Company - www.instaforex.com |
| US stock market under pressure from Russia-Ukraine conflict Posted: 04 Mar 2022 11:15 PM PST
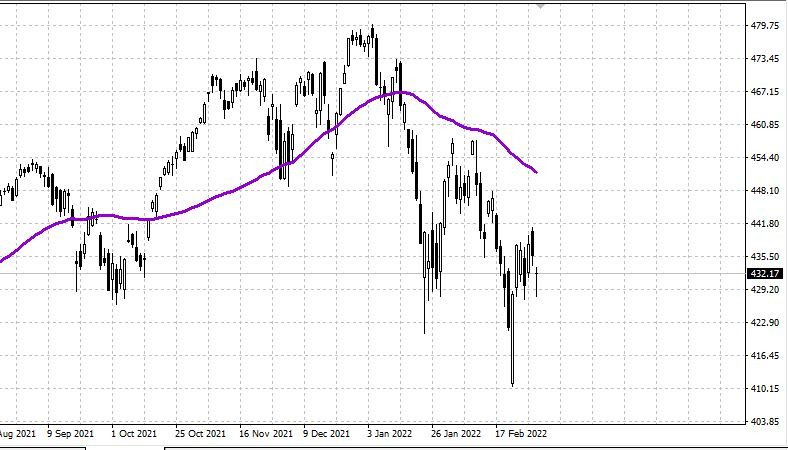
S&P 500 The US stock market plunged, while the US dollar advanced. The situation in Ukraine and strong data on US nonfarm payrolls. Major US indices ended lower at the end of the week: the Dow Jones Industrial Average lost 0.5%, the NASDAQ Composite slid by 1.7%, the S&P 500 fell by 0.8%. S&P 500: 4,329 Friday's statistics on the US labor market for February turned out to be positive. US nonfarm payrolls increased by 678,000, beating expectations and notching the best month for jobs growth since July. However, this increase followed a fall in December caused by the Omicron outbreak in the US. This means that the labor market has somewhat recovered. The unemployment rate fell to 3.8% from 4.0% in January. In general, the market has almost fully recovered to pre-COVID levels in terms of employment growth and the jobs level. As for Russia's military actions in Ukraine, the country continues to attack in several directions. Its forces are trying to encircle Kyiv and Kharkov. In the south, the Russians have opened a land corridor between Crimea and the Russian border in the east. Russia is seeking to expand the territory of the Donetsk and Lugansk People's Republics to the borders of Donetsk and Luhansk regions. The West is discussing new sanctions amid Russia's ongoing attack on Ukraine. Now traders fear that further sanctions will directly limit Russian oil and gas shipments. According to the German authorities, they are ready for such a scenario. Two rounds of Russia-Ukraine peace talks have yielded almost no results. A third round of negotiations between the parties is set to take place this weekend. USDX: 98.48. The US dollar hit a new annual high on both the situation in Ukraine and strong data on the US labor market. The Fed is still on track to raise interest rates on March 16. USD/CAD: 1.2725. The pair continues to trade within the range of 1.2600 - 1.2800 Conclusion: The events unfolding in Ukraine remain the main factor driving the market. However, US stocks seem to be ready to gain on any signs of easing tensions between Russia and Ukraine. The material has been provided by InstaForex Company - www.instaforex.com |

| You are subscribed to email updates from Forex analysis review. To stop receiving these emails, you may unsubscribe now. | Email delivery powered by Google |
| Google, 1600 Amphitheatre Parkway, Mountain View, CA 94043, United States | |


Comments