Forex analysis review
Forex analysis review |
- Gold shows turbulent trading and high volatility
- Litecoin upside reversal possible
- USD/CHF aims at 0.9360 higher high
- GBP/USD holds at 1.3100, more declines in cards
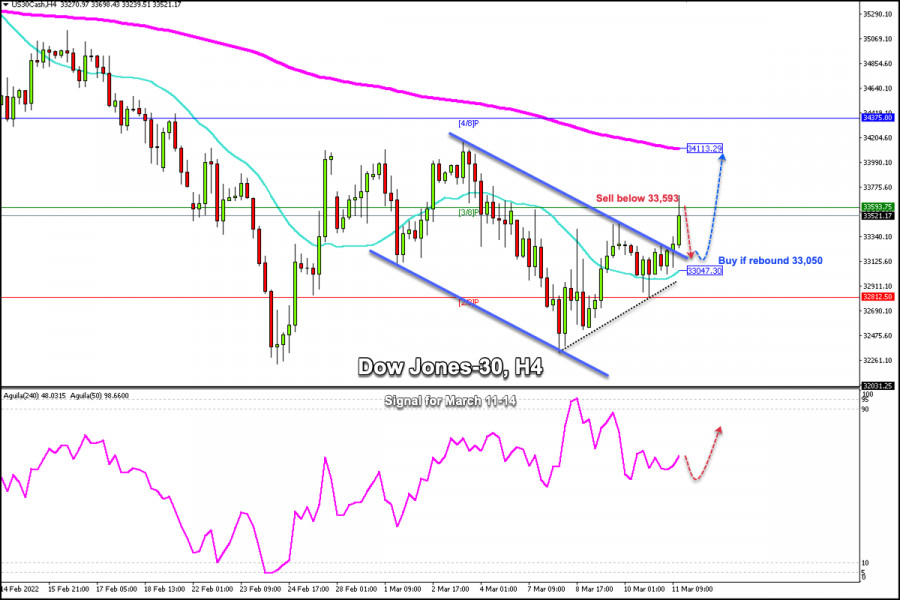
- Trading signals for Dow Jones-30 (#INDU) on March 11-14, 2022: sell below 33,593 (3/8 Murray)
| Gold shows turbulent trading and high volatility Posted: 11 Mar 2022 11:03 PM PST
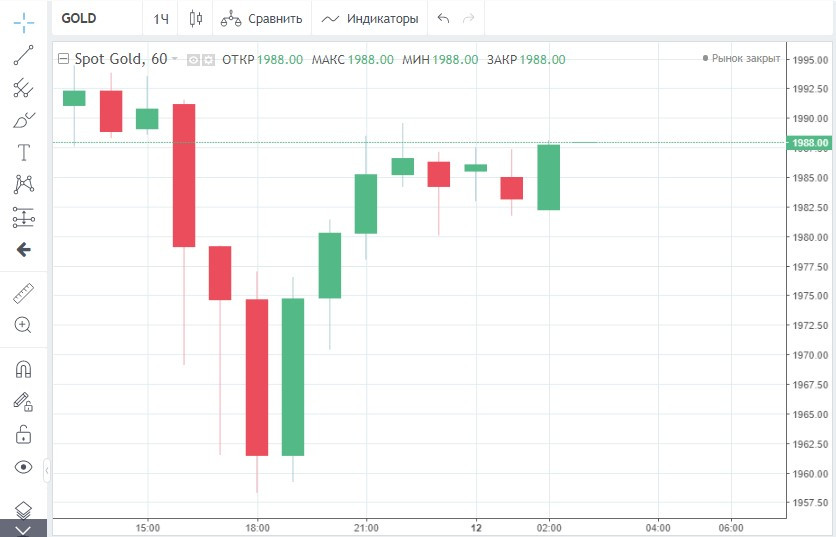
Recently, gold showed strong volatility during the trading sessions. According to analysts' forecasts, such behavior of quotations will continue for a long time. What is the reason for it? The precious metal closed the week with gains. The bullion has risen by 0.9% since Monday, although it reversed more than once during the trading week. Thus, the price of gold, having perceived the support of geopolitical risks, jumped by 2.4% on Tuesday. Meanwhile, the quotes promptly collapsed by 2.7% on Wednesday due to the de-escalation of the Russian-Ukrainian conflict. A sharp change in the range of price fluctuations was observed during Friday's trading, when gold steeply dived, and then sharply climbed. Analysts associate yesterday's drop in gold with the Russian President's statement. On March 11, Vladimir Putin at a meeting with Belarusian President Alexander Lukashenko hinted at progress in the negotiations on the conflict in Ukraine. The Russian President's encouraging comments surprised the markets and returned investors' appetite for risky assets for a while. Against this background, the attractiveness of gold as a safe-haven asset decreased, as a result of which quotations fell within 2 hours by about $30 and traded below $1,970. However, gold did not remain in the red zone for a long time. The bullion reversed after US President Joe Biden announced the US intention to cancel Moscow's special trade status on Friday. The loss of this status would make it difficult for Russian companies to do business in the United States because it would allow the US to raise tariffs on imports of a wide range of goods from Russia. Canada has already taken similar measures against Russia. If Biden manages to convince Congress to stop normal trade relations with Moscow, it may put Russia on a par with such countries as North Korea, Cuba, and Iran. Yesterday, the US President promised to try to convince the leaders of the G7 countries to ban Russia from receiving funds from the International Monetary Fund, the World Bank, and other financial institutions. In another blow to the Kremlin, the White House has imposed another package of sanctions. On March 11, the US introduced an embargo on imports of diamonds, alcohol, and seafood from Moscow. It is also forbidden to ship luxury goods to Russia from the United States. Biden's statement exacerbated market fears about more problems in global supply chains and rising inflation. As investors considered what he said, gold prices moved steadily upwards. The release of the Consumer Sentiment Index from the University of Michigan also supported bullion prices. According to preliminary estimates, the index fell to its lowest level since 2011 at 59.7 in March. In February, the consumer sentiment index in the US was at 62.8. Meanwhile, inflation expectations rose sharply this month. The US expects inflation to rise to 5.4% for the year, up from 4.9% last month. Increased geopolitical and inflation risks helped bullion to partially recover the day's losses. However, the asset ended the session at a loss. The gold fell by 0.8%, or to $15.40 on Friday. The closing price was $1,985.
"It has been another explosively volatile week for gold as the risk pendulum swings back and forth. The precious metal remains highly sensitive to geopolitical uncertainty concerning Ukraine, while other themes in the form of rising inflation and growth concerns had added to the volatility," analyst Lukman Otunuga said. Overall, experts predict that gold will maintain a volatile but upward trend. Each new package of sanctions against Russia will continue to put pressure on investors and increase their fear that inflation has not peaked yet. The material has been provided by InstaForex Company - www.instaforex.com |
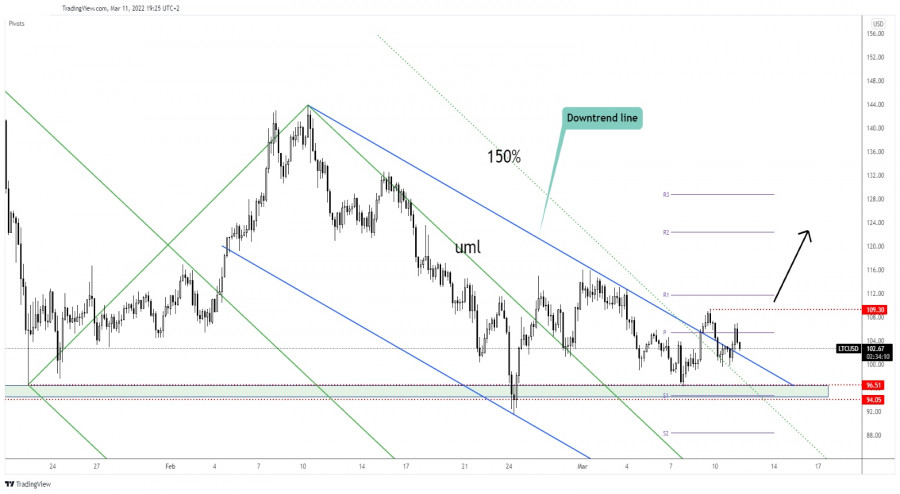
| Litecoin upside reversal possible Posted: 11 Mar 2022 09:56 AM PST Litecoin is trading in the red at 102.56 at the time of writing. The price comes back down to test and retest the broken levels before jumping higher. Actually, Bitcoin's drop forces the altcoins to drop as well. In the short term, LTC/USD is moving somehow sideways, so we'll have to wait for a fresh trading opportunity. In the last 24 hours, LTC/USD is up by 0.45% but in the last 7 days, the crypto is down by 2.38%. The price action signaled that the downside is limited but an upside reversal is far from being confirmed. LTC/USD Retests The Buyers!
LTC/USD escaped from the down channel pattern. Now it tries to retest the downtrend line. Staying above this broken dynamic resistance may signal that LTC/USD could develop a new leg up. The breakout above the 150% Fibonacci line and above the downtrend line signaled potential upwards movement. Still, only a new higher high, a valid breakout above the 109.30 could really announce a strong leg higher. An upwards movement could be invalidated if the price comes back below the downtrend line. LTC/USD Outlook!Retesting the downtrend line and making a new higher high, a valid breakout above 109.30 could activate a new swing higher and could bring new long opportunities. The material has been provided by InstaForex Company - www.instaforex.com |
| USD/CHF aims at 0.9360 higher high Posted: 11 Mar 2022 09:55 AM PST
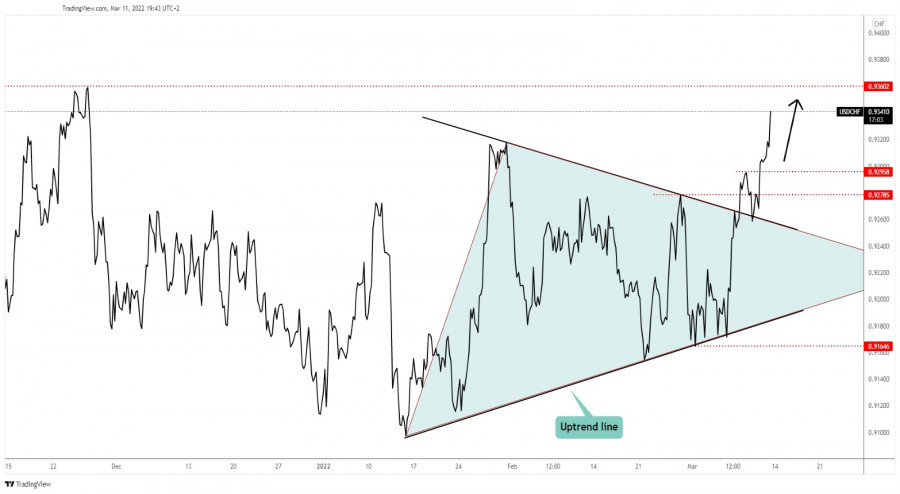
USD/CHF Strong Growth!The USD/CHF pair extends its growth after jumping above the 0.9295 former high. You knew from my analyses that the currency pair could climb towards fresh new highs after escaping from the triangle pattern and if it jumps above the 0.9295 high. As you can see, USD/CHF retested the broken downtrend line, the triangle's upside line confirming the breakout and potential upside continuation. The price ignored also the 0.9318 high which represented an upside obstacle. USD/CHF Trading Conclusion!The breakout above 0.9295 and through 0.9300 psychological level confirmed further growth and was seen as a good buying opportunity. The next upside target and obstacle is represented by the 0.9360 higher high. Ignoring this obstacle may announce further growth towards new highs. A temporary retreat, decline, could help the buyers to catch a new upwards movement. The material has been provided by InstaForex Company - www.instaforex.com |
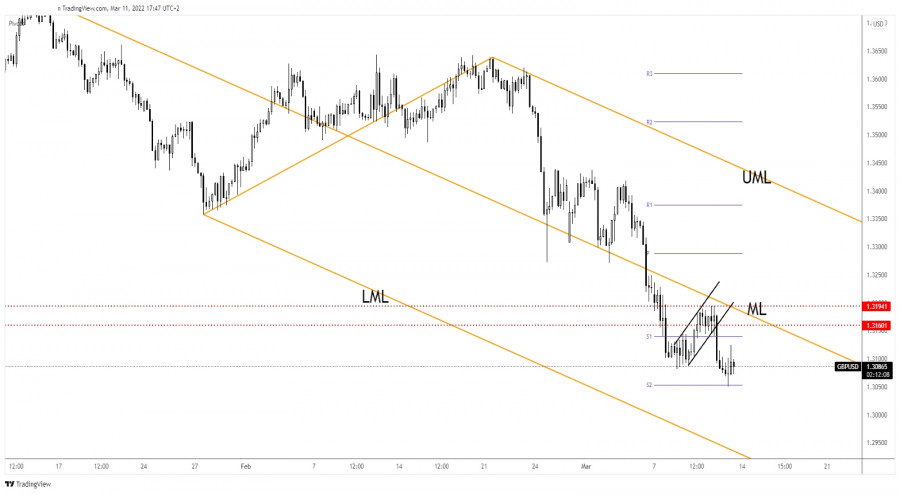
| GBP/USD holds at 1.3100, more declines in cards Posted: 11 Mar 2022 09:17 AM PST The GBP/USD pair is trading at 1.3085 at the time of writing. In the short term, the price has tried to rebound and recover after yesterday's sell-off, but the bearish pressure remains high. The currency pair climbed as much as 1.3124 today where it has found resistance. Fundamentally, the Pound has been lifted by the UK data. On the other hand, the USD was weakened by the DXY's drop. The UK GDP rose by 0.8% beating the 0.1% expected, Construction Output reported a 1.1% growth versus 0.5% expected, Index of Services registered a 1.0% growth exceeding the 0.8% growth forecasted, while the Goods Trade Balance dropped unexpectedly lower from -12.4B to -26.5B below -12.6B forecasts. The GBP received a helping hand from Industrial Production which reported a 0.7% growth versus 0.1% expected, while the Manufacturing Production rose by 0.8%, even if the traders expected only a 0.2% growth. GBP/USD maintains a bearish outlook even if the UK reported positive economic figures, while the Prelim UoM Consumer Sentiment was reported at 59.7 points below 61.4 expected. GBP/USD Bearish Bias!
As you can see on the h4 chart, GBP/USD plunged after escaping from the minor up channel. In the short term, it has rebounded but the leg higher was stopped by 1.3194 key level. As long as it stays below the median line (ML), the bias remains bearish. A temporary rebound could bring new short opportunities. The weekly S2 of 1.3053 stands as static support. A valid breakdown and a new lower low could open the door for a larger downside movement. GBP/USD Outlook!The bias is bearish despite temporary rebounds. The breakdown from the minor up channel represented a short opportunity. A valid breakdown below the S1 could validate more declines towards the 1.3 psychological level. In my opinion, a great short opportunity will appear if the rate registers a new rebound, if it prints a new up channel or a Rising Wedge pattern in the short term. The material has been provided by InstaForex Company - www.instaforex.com |
| Trading signals for Dow Jones-30 (#INDU) on March 11-14, 2022: sell below 33,593 (3/8 Murray) Posted: 11 Mar 2022 08:19 AM PST
One of the reasons behind the improvement in stock markets was the apparent rapprochement between the parties, the governments of Ukraine and Russia. The Ukrainian government seems to be ready to make concessions regarding the territorial integrity of its country and its neutrality, which would mean abandoning the objective of joining NATO. For its part, the Russian government was willing to dialogue as long as it achieves the goal of Ukraine's neutrality. These developments were the fire that fueled risk appetite driving the Dow Jones to break out of the downtrend channel that had formed since March 2. Currently, the index is trading below the 3/8 Murray, above the 21 SMA, and above the downtrend channel. A pullback is expected in the next few hours towards the area 33,047. This will give us the opportunity to buy the Dow Jones again with targets at the 200 EMA located at 34,113. The dominant trend remains downward as long as the index trades below the 200 EMA at 34,113 and below the 4/8 Murray at 34,375. A trade and a daily close above 34,375 (4/8 Murray) could mean the change in trend and the price could reach the level of 35,957 (6/8 Murray). This will mean the start of a new bullish move. Conversely, a daily close below the 21 SMA at 33,047 could resume the move down towards 2/8 Murray at 32,812 and eventually the price could drop to the low of March 8 at 32,337. Our trading plan is to sell below 33,593 (3/8) with targets at 33,050 (21 SMA) and wait for a technical bounce at that same level to buy with targets at 34,113 (200 EMA). The material has been provided by InstaForex Company - www.instaforex.com |
| You are subscribed to email updates from Forex analysis review. To stop receiving these emails, you may unsubscribe now. | Email delivery powered by Google |
| Google, 1600 Amphitheatre Parkway, Mountain View, CA 94043, United States | |

Comments