Forex analysis review
Forex analysis review |
- Video market update for March 11,,2022
- GBP/USD: the plan for the US session on March 10 (analysis of morning deals). The pound quickly rolled back down after an
- EUR/USD: plan for the US session on March 10 (analysis of morning deals). Markets froze in anticipation of the outcome of
- Analysis and forecast for GBP/USD on March 10, 2022
- EUR/USD analysis and forecast for March 10, 2022
- Daily Video Analysis: XAUUSD, H4 Strong Buying Opportunity For Gold
- Forex forecast 03/10/2022 EUR/USD, EUR/JPY, Gold and Oil from Sebastian Seliga
- BTC update for March 10,.2022 - Second downside wave in creation
- European Central Bank decision may surprise
- Analysis of Gold for March 10,.2022 - Key pivot at $1.973 on the test
- EUR/USD analysis for March 10, 2022 - Potential for the downside continuation
- Video market update for March 10,,2022
- Analysis and trading tips for GBP/USD on March 10
- US stock market on March 10, 2022
- Trading plan for starters of EUR/USD and GBP/USD on March 10, 2022
- Analysis and trading tips for EUR/USD on March 10
- US and European stock markets advance amid Ukraine talks, UAE oil production hike
- US inflation to rise above 8.0%
- Trading plan for EUR/USD and GBP/USD on March 10, 2022
- Technical Analysis of ETH/USD for March 10, 2022
- Technical Analysis of BTC/USD for March 10, 2022
- Hot forecast for EUR/USD on March 10, 2022
- Technical Analysis of EUR/USD for March 10, 2022
- Technical Analysis of GBP/USD for March 10, 2022
- Market participants await US CPI data
| Video market update for March 11,,2022 Posted: 10 Mar 2022 03:43 AM PST Watch for upside breakout on USD/JPY The material has been provided by InstaForex Company - www.instaforex.com |
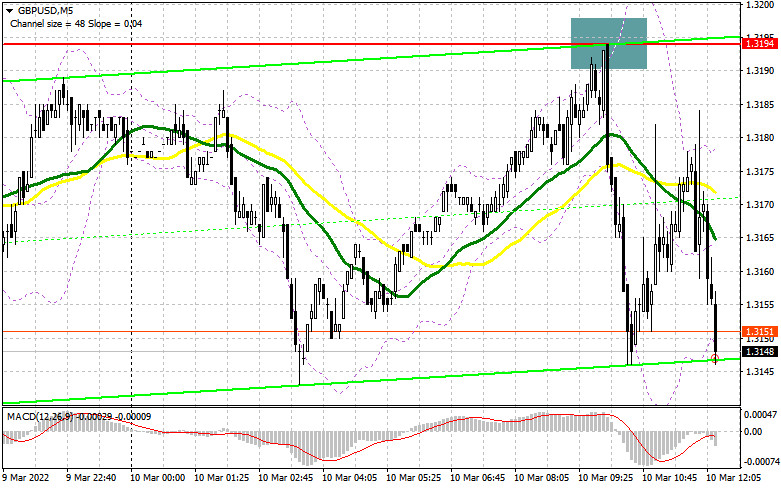
| Posted: 10 Mar 2022 03:27 AM PST To open long positions on GBP/USD, you need: In my morning forecast, I paid attention to the level of 1.3194 and recommended making decisions on entering the market. Let's look at the 5-minute chart and figure out what happened. An unsuccessful attempt by the bulls to gain a foothold above the resistance of 1.3194 led to the formation of a sell signal for the pound, after which the pair went down more than 50 points. We did not reach the nearest support of 1.3138, so from a technical point of view, nothing has changed for the second half of the day. And what were the entry points for the euro this morning?
During the American session, everything will depend on today's data on inflation in the United States, which many are now focusing on. The fall of the pound may be limited since we have clear aggressive actions of the Bank of England to interest rates ahead since inflation in the UK is almost the most important headache of citizens and politicians governing the country. An increase in rates will lead to a return of demand for the pound. An unsuccessful attempt by bulls to get above 1.3194 can become a very serious problem, as self-doubt can bring new sellers back to the market - especially if the US inflation data is higher than economists' forecasts. An important task of the bulls during the American session remains to protect the support of 1.3138, where the moving averages are playing on their side. Long positions from this level can be considered only after the formation of a false breakdown since the entry will be carried out against the bear market. Growth in this scenario will bring the pair back to the resistance of 1.3194, which it was not possible to get above today. Only a breakthrough and a reverse test of this area from top to bottom, together with declining inflation in the United States, will lead to the demolition of several sellers' stop orders, allowing them to continue to increase long positions more actively. The target in this case will be the 1.3244 area. A more difficult task will be to reach the resistance of 1.3275 - this will deal a strong blow to the bearish trend observed since the end of February. I recommend fixing profits there. In the scenario of a decline in GBP/USD in the afternoon and the absence of bulls at 1.3138, it is best to postpone purchases until the next support around 1.3085 - this is a more reliable level. But I advise you to open long positions there only when a false breakdown is formed. You can buy GBP/USD immediately on a rebound from 1.3034, or even lower - from a minimum of 1.2976, counting on a correction of 20-25 points within a day. To open short positions on GBP/USD, you need: Bears have defended the level of 1.3194, but they are not in a hurry to return to the market before the key statistics in the United States, which can predetermine the further actions of the Federal Reserve System. Therefore, I advise you to act very carefully with short positions, so as not to fall into the trap at the most annual lows. Only after the formation of a false breakdown at 1.3194, by analogy with what I understood above, you can sell GBP/USD further along with the trend. The main goal, in this case, will be to support 1.3138. The lack of activity on the part of buyers there, as well as the breakdown and reverse test of this level from the bottom up – all this will give an additional entry point into short positions to fall to the lows of this week, in the area of 1.3085. A more distant target will be the areas 1.3034 and 1.2976, where I recommend fixing the profits. However, these levels will be available only if the actual CPI value significantly exceeds the forecasts of economists. If the pair grows during the US session after weak US data, it is best to postpone sales. The demolition of 1.3194 may lead to a sharp increase in the pound against the background of new stop orders from sellers. In this case, I advise you to open short positions of GBP/USD after a false breakdown in the area of 1.3244. You can sell the pound immediately for a rebound from 1.3275, counting on a correction within the day by 20-25 points.
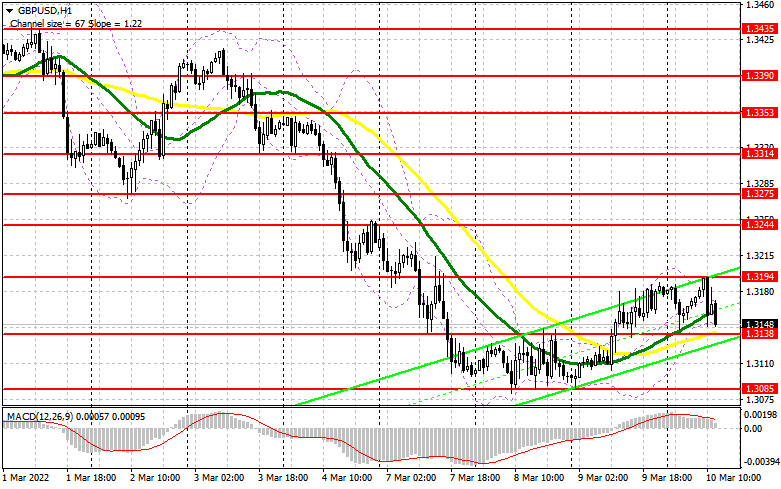
The COT reports (Commitment of Traders) for March 1 recorded a sharp increase in long positions and a reduction in short ones. This led to a reduction of the negative delta value to almost zero. However, you need to understand that now such reports are secondary, and the market is changing almost daily, flying by 100-200 points against the background of the ongoing geopolitical conflict that has affected almost the whole world. Most likely, the report next week will show a sharp demand for short positions, so it's best not to look too closely at the current figures yet. It also makes no sense to talk about what the policy of the Bank of England or the Federal Reserve System will be since, in the event of an aggravation of the military conflict, it will not matter at all. Now Russia and Ukraine have sat down at the negotiating table, and much will depend on the results of these meetings. The only thing that is clear for sure is high inflation in the UK, which will force the Bank of England to act more actively. Given the slowdown in economic growth and retaliatory sanctions from Russia, it is unlikely that the regulator will go for a sharper increase in interest rates - and this must be done, otherwise, inflation will devour not only the available incomes of the population but also sharply reduce them. The COT report for March 1 indicated that long non-commercial positions increased from the level of 42,249 to the level of 47,679, while short non-commercial positions decreased from the level of 48,058 to the level of 48,016. This led to the preservation of the negative value of the non-commercial net position at the level of -337 versus -5,809. The weekly closing price dropped to 1.3422 against 1.3592. Signals of indicators: Moving averages Trading is conducted above 30 and 50 daily moving averages, which indicates the beginning of an upward correction for the pair. Note. The period and prices of moving averages are considered by the author on the hourly chart H1 and differ from the general definition of the classic daily moving averages on the daily chart D1. Bollinger Bands A break of the lower limit of the indicator in the area of 1.3138 will increase the pressure on the pound. A break of the upper limit of the indicator in the area of 1.3194 will lead to the growth of the pair. Description of indicators
|
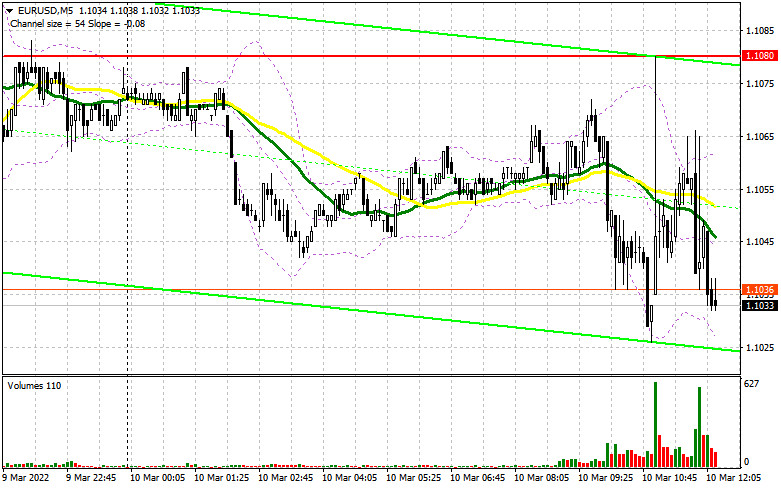
| Posted: 10 Mar 2022 03:27 AM PST To open long positions on EURUSD, you need: In my morning forecast, I paid attention to the level of 1.1080 and recommended making decisions on entering the market. Let's look at the 5-minute chart and figure out what happened. There were no fundamental statistics in the first half of the day, so the focus shifted to the meeting of the European Central Bank, the results of which will be known this afternoon. Despite a serious surge in volatility during the European session, it was not possible to achieve a normal false breakdown from the level of 1.1080. For this reason, I have not seen any deals on the pair. For the second half of the day, the technical picture has not changed in any way. And what were the entry points for the pound this morning?
As I said this morning, traders will focus all their attention on the meeting of the European Central Bank. And let no one expect changes in monetary policy, much less an increase in interest rates, but the ECB's decision today will be greatly influenced by the latest inflation data in the eurozone. And we are talking not only about the general inflation indicator but also about the basic one. Do not be surprised if the president of the European Central Bank, Christine Lagarde, makes several rather harsh statements, which will lead to the continuation of the euro's growth. In the afternoon, we are also waiting for very important data on inflation in the US, which may lead to another major surge in volatility. An important task of the bulls for the American session remains to protect the support of 1.1017, which is where the euro is heading now. The decline of the euro and the formation of a false breakdown there after Christine Lagarde's press conference and the release of data on the consumer price index in the United States - all this will lead to a buy signal. It is possible to count on a larger recovery of EUR/USD only after the smoothing of geopolitical tensions following the meeting of representatives of Russia and Ukraine, which is currently taking place in Turkey, as well as after the breakthrough of the 1.1080 level, above which it was not possible to get out in the first half of the day. A breakdown of this range will cross out the bearish trend and clamp the pair in a wide side channel. The reverse test of 1.1080 from top to bottom during the release of US data will give a buy signal and open up the possibility of recovery to the area of 1.1139. A more distant target will be the 1.1164 area, where I recommend fixing the profits. In the event of an aggravation of the geopolitical situation and the soft rhetoric of the president of the European Central Bank, pressure on the euro will quickly return. With a decline and lack of activity at 1.1017, and there are moving averages, traders will begin to close long positions, which will only increase the pressure on the pair. Therefore, it is best to postpone purchases until a false breakdown in the support area of 1.0947. You can buy immediately for a rebound from the minimum of 1.0879, or even lower - around 1.0810 with the aim of an upward correction of 20-25 points within the day. To open short positions on EURUSD, you need: Although the bears showed themselves in the area of 1.1080, so far there are no active actions to compensate for yesterday's fall. The return of demand for the dollar may occur if Christine Lagarde takes a soft stance on monetary policy at today's press conference after the meeting of the European Central Bank. In the meantime, sellers need to continue to think about how to protect the resistance of 1.1080, since by releasing a pair above this range, demand for the euro will return. The formation of a false breakdown after the ECB meeting will lead to a sell signal and the opening of new short positions to reduce the euro to the first important support of 1.1017. A breakdown of this area and a reverse test from the bottom up can take place very quickly, which will give an additional signal to open short positions already with the prospect of falling to the lows: 1.0947 and 1.0879. The downward movement will be fast, as a large number of buyers' stop orders are concentrated at these levels. The farthest target will be the 1.0810 area, where I recommend fixing the profits. However, such a large sell-off is possible only with very strong US inflation, which will simply force the Federal Reserve System to act more aggressively this month. In the case of the growth of the euro and the absence of bears at 1.1080, it is best not to rush with sales. It is possible that, as yesterday, the bulls will begin to act more aggressively in the event of changes in the rhetoric of the president of the European Central Bank, and a breakthrough of this level will pull the sellers' stop orders. Therefore, the optimal scenario will be short positions when forming a false breakdown in the area of 1.1139. You can sell EUR/USD immediately on a rebound from 1.1184, or even higher - around 1.1229 with the aim of a downward correction of 15-20 points.
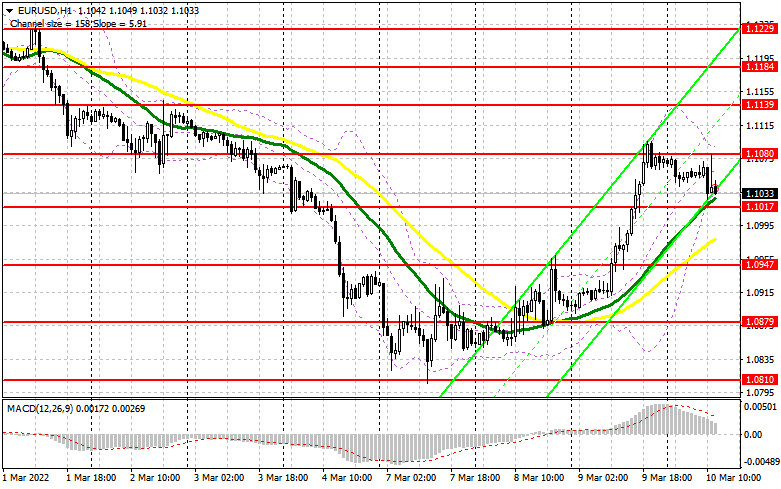
The COT report (Commitment of Traders) for March 1 recorded an increase in both long and short positions. The first ones turned out to be more, which led to an increase in the positive delta. In the context of the ongoing tough geopolitical conflict that has affected almost the whole world, it makes no sense to talk about what position investors held a week ago since everything is changing at lightning speed. The data yesterday no longer have any significance today, since no one knows how the sanctions imposed by the United States and EU countries will affect the Russian economy, as well as what the conflict between Russia and Ukraine will eventually lead to. The main question is how long it will all last. Against this background, it does not matter much what the policy of the European Central Bank or the Federal Reserve System will be since, in the event of an aggravation of the military conflict, the markets will fly down again. Now Russia and Ukraine have sat down at the negotiating table, and much will depend on the results of these meetings - there will be a lot of them. This week, the European Central Bank will also hold a meeting and important February data on US inflation will be released, which will lead to a surge in volatility but is unlikely to correct the situation in favor of buyers of risky assets. I recommend continuing to buy a dollar. I advise you to be quite careful about risky assets and buy euros only as the tense relations between Russia, Ukraine, the EU, and the USA weaken. Any new sanctions actions against the Russian Federation will have serious economic consequences, which will affect the financial markets, as well as affect not only the Russian ruble but also the European currency. The COT report indicates that long non-commercial positions increased from the level of 214,195 to the level of 228,385, while short non-commercial positions increased from the level of 154,163 to the level of 163,446. At the end of the week, the total non-commercial net position increased to 64,939 against 59,306. The weekly closing price dropped from 1.1309 to 1.1214. Signals of indicators: Moving averages Trading is conducted slightly above 30 and 50 daily moving averages, which indicates the continuation of the upward correction of the pair. Note: The period and prices of moving averages are considered by the author on the hourly chart H1 and differ from the general definition of the classic daily moving averages on the daily chart D1. Bollinger Bands A breakthrough of the lower limit of the indicator in the area of 1.1017 will increase pressure on the euro. A breakthrough of the upper limit of the indicator in the area of 1.1080 will lead to a new wave of growth of the pair. Description of indicators
|
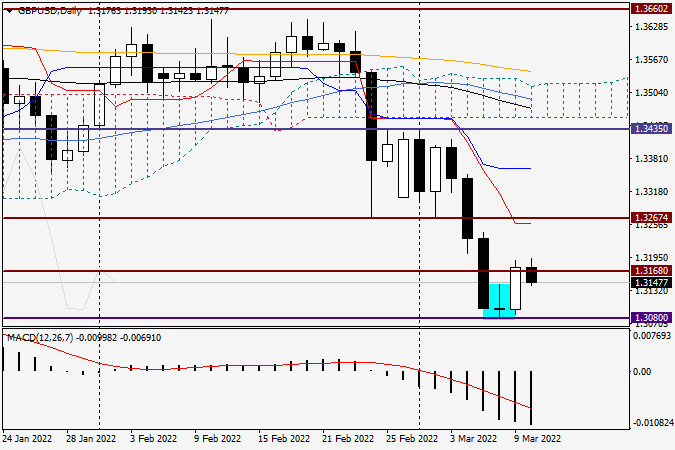
| Analysis and forecast for GBP/USD on March 10, 2022 Posted: 10 Mar 2022 03:27 AM PST The military special operation in Ukraine continues to excite the minds of investors and influence the course of trading. It would seem that the COVID-19 pandemic has only begun to decline, so a new attack is a conflict between Russia and Ukraine. At the same time, it is completely unclear how long it will last and what troubles it will bring. This military special operation and isolation of Russia further aggravate the supply chain already disrupted by the COVID-19 epidemic, and in general, may lead to another economic crisis. As recently as the day before yesterday, US President Joe Biden has already announced an embargo on Russian hydrocarbons, including oil and gas. But many European countries are completely dependent on Russian gas, for example, Bulgaria. And British Prime Minister Boris Johnson said that it is not possible to immediately abandon energy resources from Russia. In general, the situation is quite complicated, and the current year seems to be very stressful. Daily
Today's economic calendar contains a lot of important macroeconomic data that can affect the price dynamics of the GBP/USD currency pair. I would like to draw the attention of traders that often the British pound supports the price dynamics of the single European currency and moves with it in unison. The euro is having a hell of a day today. Let me remind you that at 12:45 the ECB will make its decision on interest rates, and at 13:30 (London time) Christine Lagarde's press conference will begin. Most likely, the rates in the eurozone will remain unchanged, so the main attention of investors will be turned to the rhetoric of the speech of the head of the ECB. This all means that the "Briton" can reach for the euro, but in which direction will depend on the market reaction to Lagarde's speech. In the case of more "hawkish" notes, the GBP/USD will likely continue the rise that started yesterday in the wake of the euro/dollar. But there is one very important point here. The US dollar will also not remain without fundamental influence today, and this will directly affect the price dynamics of the pound/dollar pair, even if the sterling ignores the results of the ECB meeting and the speech of its president. I strongly recommend paying attention to the American data on applications for unemployment benefits and especially the US consumer price index, which will be published today at 13:30 London time. As for the technical picture, it is undoubtedly a very important factor. I advise you to pay attention to two points. First, it is a reversal in its form and essence, highlighted on the daily chart, the Doji candle for March 8. Second, this is the beginning of its development and yesterday's bullish candle with a closing price above 1.3168. The second point allows us to conclude that the support level of 1.3168 was falsely broken, which means that with the highest probability the pair has every chance of continuing the upward dynamics. Today, at the time of writing, we see that the attempts of the sterling bear to return trading on GBP/USD under their control are failing. After a slight decline and attempts to return the quote under 1.3168, the pair found strong support at 1.3142 and turned up. The daily candle has already started to form a bullish body, but right now the rate has returned to the opening price of today's trading. Today is a very difficult day for making trading decisions, so for beginners and those who do not want to take risks, I recommend staying out of the market and watching what is happening from the outside. I recommend other traders to look for options for purchases at current market prices or after short-term declines in the price zone 1.3168-1.3160. I would like to note once again that today's events planned in the economic calendar can seriously affect the price orientation of the pound/dollar pair, so be careful and attentive. The material has been provided by InstaForex Company - www.instaforex.com |
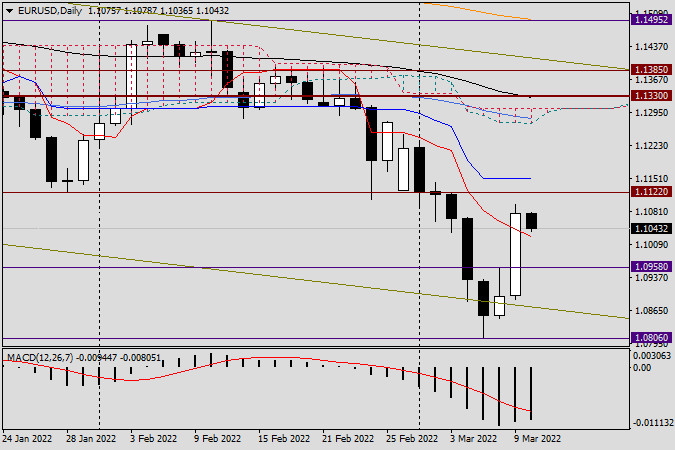
| EUR/USD analysis and forecast for March 10, 2022 Posted: 10 Mar 2022 03:27 AM PST At yesterday's trading, the main currency pair of the Forex market showed impressive growth. And this is on the eve of the meeting of the European Central Bank (ECB), followed by a press conference by the head of this department, Christine Lagarde, as well as with Russia's ongoing military special operation in Ukraine. Did the market believe in changing the ECB's rhetoric in the direction of tightening it and settling the conflict between the two fraternal, Slavic peoples? Let's speculate. As for the ECB, there are still no clear signals from the European regulator about the timing of the start of tightening its monetary policy. Meanwhile, inflation in the area of circulation of the single European currency is still too high, and something needs to be done about it. It is already clear that it will not work just to sit and wait for inflation by itself to fall to the target drop of the European Central Bank of 2%, because it is completely unknown when this will happen, and indeed whether it will happen by itself, without tightening the ECB monetary policy. Moreover, now the situation is complicated by the situation in Ukraine, where the Russian Federation is conducting its military special operation. Regarding the situation in Ukraine, if the author's memory does not change, another round of negotiations between the two sides should take place today. It is difficult to say whether it will bring any positive results. In this situation, it will be very difficult for the parties to find a compromise acceptable to all. This requires a special political will and a great desire. However, let's hope for the best. Everyone needs peace, including European partners, who themselves will suffer to a large extent from the sanctions imposed against Russia at the behest of the United States. First of all, this concerns the cessation of the use of Russian gas and oil. Nevertheless, I would like to emphasize once again that, since the current situation does not suit anyone, everyone is interested in establishing relations between Kyiv and Moscow as soon as possible and ending the military special operation. However, let's return to the main event of today, and, perhaps, the whole week. So, at 12:45 London time, the ECB will make its decision on interest rates. Since no changes are expected here, the main moment for market participants will be the press conference of ECB President Christine Lagarde, which will begin at 13:30 (London time). The tightening of the rhetoric of the head of the European Central Bank will support the single currency, and it will continue its yesterday's growth against the US dollar. Otherwise, the euro may come under selling pressure. But that's not all of today's events. Simultaneously with Lagarde's press conference, important reports on initial applications for unemployment benefits and much more important releases on changes in consumer prices will be received from the United States. So, as you know, today will be another day. There is no doubt that these events will have a serious impact on the price dynamics of EUR/USD, but for now, we will see what is happening on the price charts at the time of writing this article. Daily
Yesterday's rather strong growth of the pair can be called corrective with a big stretch. A hefty bullish candle with a closing price above the Tenkan red line, at 1.1076, clearly demonstrates that the euro bulls have come to their senses and are ready for further confrontation with their opponents. At the end of this article, the euro/dollar is trading with a slight decrease, near the level of 1.1062. If the upward dynamics continue, the pair will head to the previously broken support level at 1.1122, and the blue Kijun line of the Ichimoku indicator, which is located at a strong technical level of 1.1150, will be the longer-term goal of the players to increase the rate. In a downward scenario, EUR/USD may return to the resistance broken yesterday and the highs of March 8, 1.0958. On such eventful days, it is always difficult to give any specific trading recommendations. And yet, judging by the technical picture, at the moment, the continuation of growth seems most likely. For those who want to open new positions on EUR/USD today, I recommend taking a closer look at purchases after short-term declines in the areas of 1.1035 and 1.1010. If bearish reversal candles appear in the price zone 1.1090-1.1110 at smaller time intervals, this will be a signal to open deals for sale. The material has been provided by InstaForex Company - www.instaforex.com |
| Daily Video Analysis: XAUUSD, H4 Strong Buying Opportunity For Gold Posted: 10 Mar 2022 02:18 AM PST Today we take a look at XAUUSD. Combining advanced technical analysis methods such as Fibonacci confluence, correlation, market structure, oscillators and demand/supply zones, we identify high probability trading setups. The material has been provided by InstaForex Company - www.instaforex.com |
| Forex forecast 03/10/2022 EUR/USD, EUR/JPY, Gold and Oil from Sebastian Seliga Posted: 10 Mar 2022 01:43 AM PST Let's take a look at the technical picture of EUR/USD, EUR/JPY, Gold and Oil. The material has been provided by InstaForex Company - www.instaforex.com |
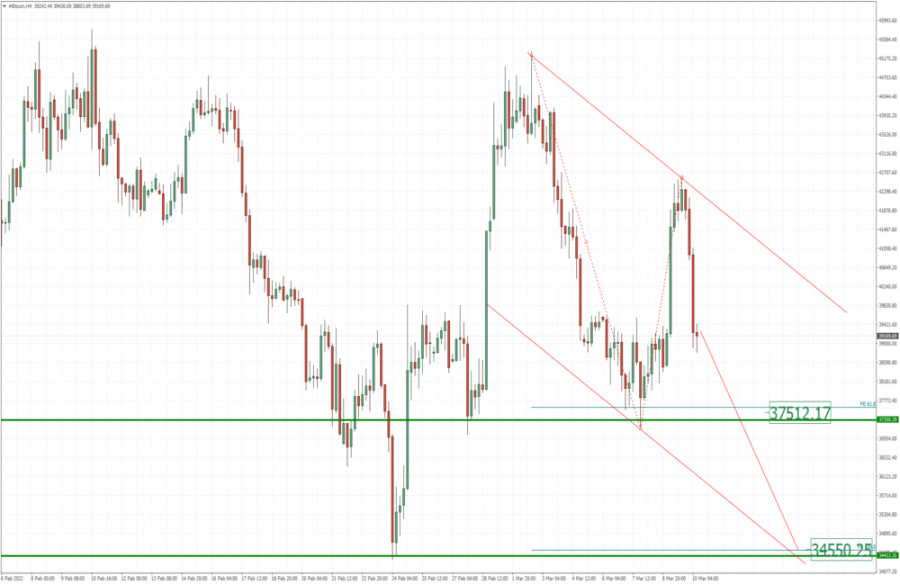
| BTC update for March 10,.2022 - Second downside wave in creation Posted: 10 Mar 2022 01:35 AM PST Technical analysis:
BTChas been trading downwards with strong momentum in the background. I see potential for further downside continuation. Trading recommendation: Due to strong downside momentum in the background, I see potential for the second downside wave to develop. Watch for selling opportunities on the rallies using intraday charts. Downside objectives are set at the price of $37.500 (pivot low and FE 61.8%) and $34.500 (pivot low and FE 100%) Key resistance pivot is set at the price of $42.600 The material has been provided by InstaForex Company - www.instaforex.com |
| European Central Bank decision may surprise Posted: 10 Mar 2022 01:32 AM PST Rate hike signals from the European Central Bank are becoming increasingly difficult to read, making it harder for investors to decide when the regulator will tighten monetary policy amid ongoing global geopolitical tensions and excessively high inflation. The ECB's decisions today will depend in part on the so-called underlying price trends that policymakers are monitoring. We are talking about core inflation, which does not take into account food and energy prices. However, the consequences of logistical difficulties due to sanctions and the rapid rise in oil and gas prices can lead to a complete distortion of the picture and clarity of how to proceed and what to do. Don't be surprised if European Central Bank President Christine Lagarde again comes up with a number of rather hawkish statements, as she did quite recently, even before the aggravation of relations between Russia and Ukraine.
In my other review, I touched on a recent speech by Chief Economist Philip Lane, who noted that current data may be too unreliable to rely on them to guide future monetary policy. It seemed that the ECB was ready to curtail economic support measures and move away from stimulus programs and bond purchases, but the geopolitical situation and EU sanctions against Russia confused all the cards. Along with the threat to economic growth, the chances of interest rate hikes in 2022 have sharply declined, but inflation is immediately coming to the fore with a post mark of 6.0%, which is three times the European Central Bank's official target of 2%. Inflation that includes food and energy prices—unlike wage-driven inflation—drastically reduces the purchasing power of the population, as most of the spending is spent on housing, utilities, basic necessities, food and gasoline, and then the expenses are directed to something else. High prices for these groups sharply reduce demand and slow down the economy. The same will happen with the eurozone. Economists are optimistic, saying that growth in the eurozone will slow by 0.3-0.4 percentage points this year. And while ECB officials promise to act on the data coming in, they also say a gradual stimulus cut remains the most appropriate plan. The latest forecasts, which will be published after the end of today's ECB meeting, are likely to take into account a steady increase in prices in line with the official target of 2%. Notably, core inflation hit a record 2.7% in February this year as businesses continued to raise prices at the fastest pace in a decade, adjusted for supply chain disruptions and the pandemic. The ECB's preferred measure of inflation expectations hit 2.4% on Tuesday.
In a recent interview, Executive Board member Isabel Schnabel highlighted the broad nature of inflation, which extends well beyond energy prices, but expressed concerns about the risks of reacting too late to price changes. The head of the Finnish central bank thinks a little differently. In his opinion, geopolitical tensions delay, but do not negate the desire of the ECB to abandon the program of large-scale asset purchases. Austrian colleague Robert Holtzmann also recently said in an interview that the central bank is moving towards normalization, although expected ECB policy changes may be delayed until later. Mario Centeno of Portugal also supports the new policy direction, but warns of possible stagflation. ECB policymakers also insist that asset purchases must stop before interest rates rise. Bond purchases under the Pandemic Emergency Purchase Program are expected to close this month. Economists expect that in June the ECB will also announce the termination of the regular program of buying bonds, which will end in September, and then rates will be raised towards the end of the year. Expectations that the ECB will actually act more aggressively today are reflected in the euro quotes. Prices too attractive to buy have done their job. As for the technical picture of the EURUSD pair The euro reacts with growth to the expected data on inflation in the United States and the actions of the ECB, and traders are rapidly taking profits in one asset, switching their attention to riskier ones. Although the euro bulls have returned to resistance around 1.1100, which keeps the demand for the trading instrument, however, geopolitical tensions around Russia and Ukraine will limit the upward potential of the pair. Euro buyers need to consolidate above 1.1140, which will allow the correction to continue to the highs: 1.1230 and 1.1310. The decline of the trading instrument will be met with active purchases in the area of 1.1000. However, the key support level remains the 1.0880 area. As for the technical picture of the GBPUSD pair The buyers of the pound showed themselves after the recent major fall of the pair, and are now focused on the resistance of 1.3194. The return to control of this range will allow us to count on a more powerful correction of the pair in the area of 1.3240 and 1.3320. However, the prospects for growth are overshadowed by Russia's military operation on the territory of Ukraine. If we go below 1.3140, then the pressure on the trading instrument will increase. In this case, we can expect a repeated fall to 1.3085 and the exit of the trading instrument to new lows: 1.3030 and 1.2920. The material has been provided by InstaForex Company - www.instaforex.com |
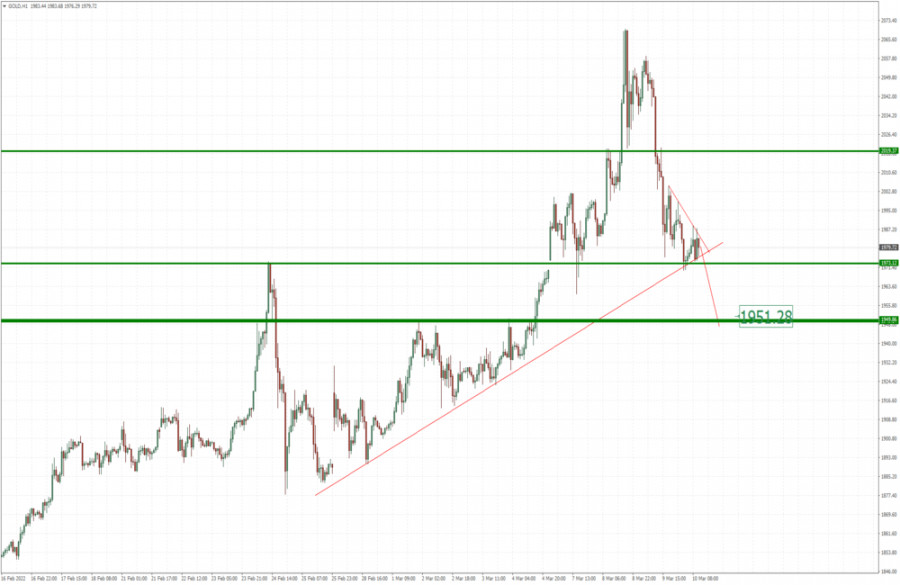
| Analysis of Gold for March 10,.2022 - Key pivot at $1.973 on the test Posted: 10 Mar 2022 01:26 AM PST Technical analysis:
Gold has been trading downwards but key confluence support is on the test at $1.973. In case of the downside breakout, there is potential for bigger drop. Trading recommendation: Rising trendline is on the test and Gold is at the key pivot. I would like to see the breakout of key support at $1.973 to confirm further continuation. My advice is to watch for selling opportunities below the pivot at $1.93 with the downside objective at $1.950. Resistance level is set at the price of $2.000 The material has been provided by InstaForex Company - www.instaforex.com |
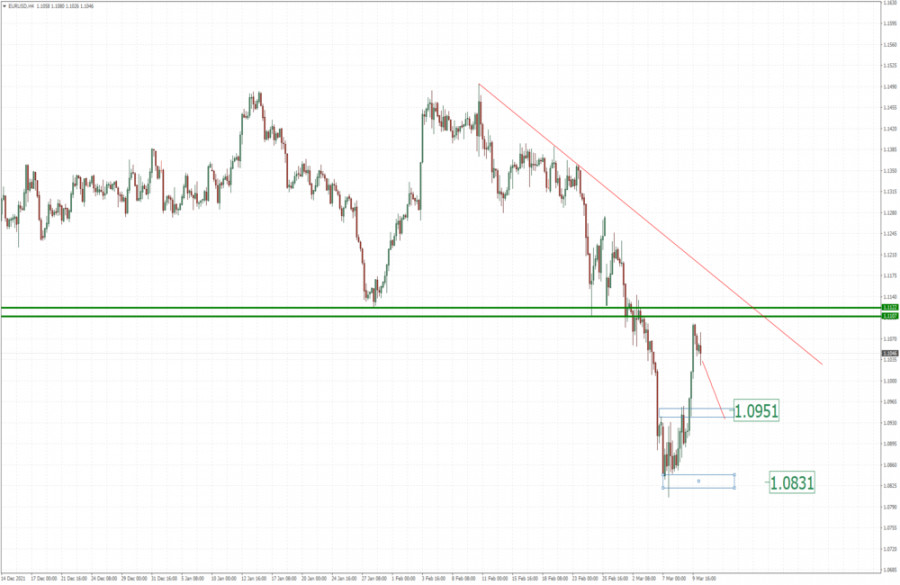
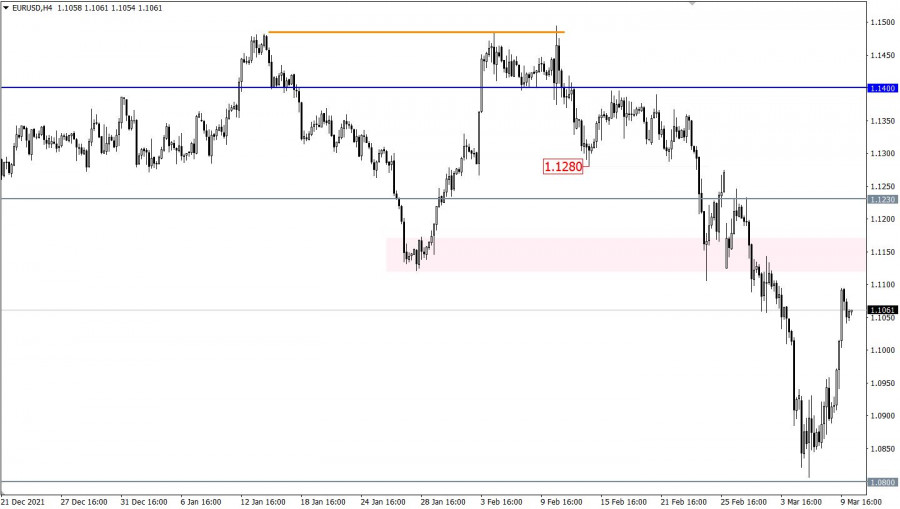
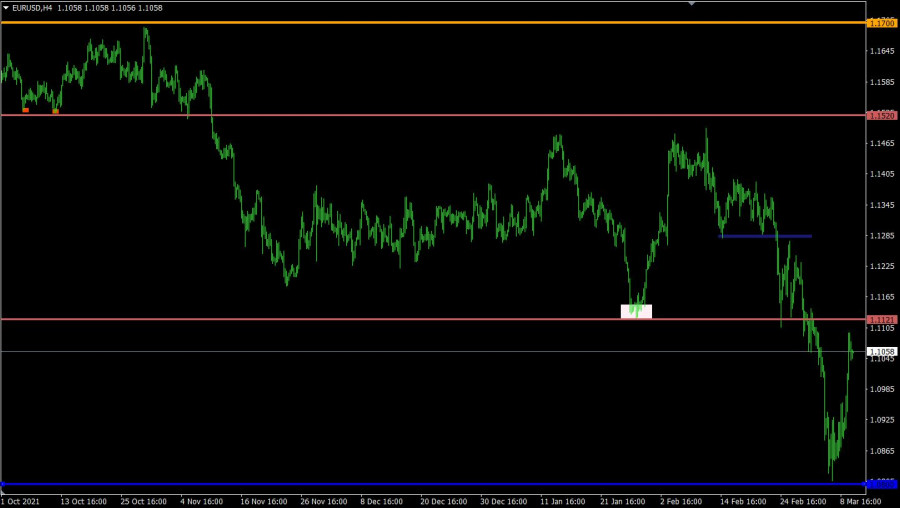
| EUR/USD analysis for March 10, 2022 - Potential for the downside continuation Posted: 10 Mar 2022 01:19 AM PST Technical analysis:
EUR/USD has been trading upwards yesterday but I see potential downside continuation today due to short-term downside cycle in the background. Trading recommendation: Due to strong down-cycle in the background and open drive to the downside today, I see potential for the downside continuation. My advice is to watch for selling opportunities with the downside objectives at 1.0950 and 1.0830. Price is still trading below the supply trend-line, which is good sign for further downside continuation. Key resistance is set at the price of 1.1120 The material has been provided by InstaForex Company - www.instaforex.com |
| Video market update for March 10,,2022 Posted: 10 Mar 2022 01:11 AM PST Watch for potential upside continuation patterns on USD/CAD The material has been provided by InstaForex Company - www.instaforex.com |
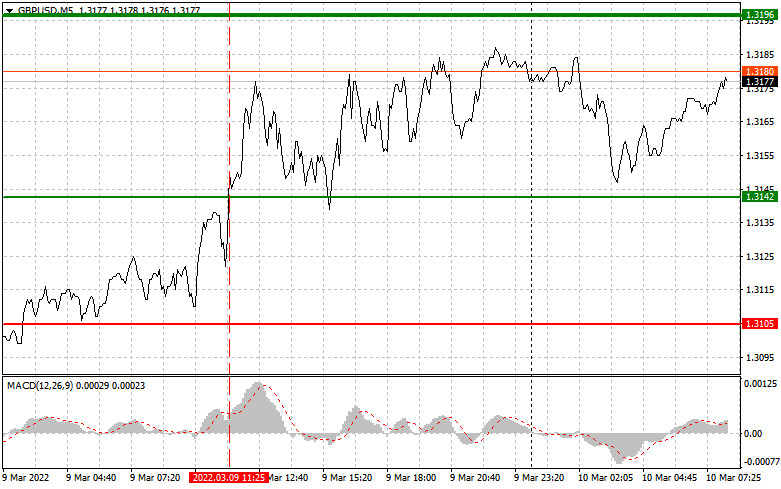
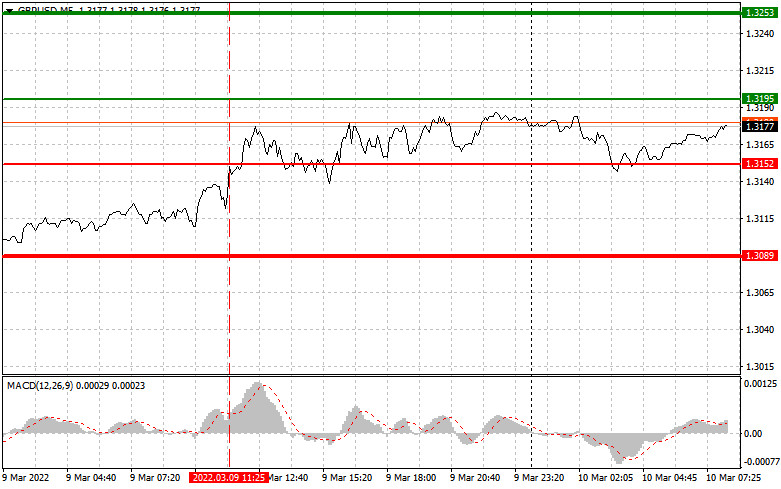
| Analysis and trading tips for GBP/USD on March 10 Posted: 10 Mar 2022 01:06 AM PST Analysis of transactions in the GBP / USD pair A signal to buy emerged after GBP/USD hit 1.3142. However, there was no increase as the MACD line being far from zero limited the upside potential of the pair. No other signal appeared for the rest of the day.
Everyone is focused on the upcoming US inflation data, but much also depends on the actions of the Bank of England to combat the high consumer price index, which is now destroying the UK economy. The fact that energy prices are close to their historical highs will create even more problems for the central bank in the future. A report on UK house prices will be released today, but it will not affect the markets as it is not that important. In the afternoon, the US will publish its latest data on inflation, and that could return demand to dollar provided that the figure is higher than expected. The report on US jobless claims could also influence the direction of EUR/USD. For long positions: Buy pound when the quote reaches 1.3195 (green line on the chart) and take profit at the price of 1.3253 (thicker green line on the chart). However, there is little chance for a rally today, except if bulls successfully push the pair above 1.3195. In any case, before buying, make sure that the MACD line is above zero, or is starting to rise from it. It is also possible to buy at 1.3152, however, the MACD line should be in the oversold area as only by that will the market reverse to 1.3195 and 1.3253. For short positions: Sell pound when the quote reaches 1.3152 (red line on the chart) and take profit at the price of 1.3089. Pressure could return at any moment, but a lot depends on the latest US inflation data. Also, before selling, make sure that the MACD line is below zero, or is starting to move down from it. Pound can also be sold at 1.3195, however, the MACD line should be in the overbought area, as only by that will the market reverse to 1.3152 and 1.3089.
What's on the chart: The thin green line is the key level at which you can place long positions in the GBP/USD pair. The thick green line is the target price, since the quote is unlikely to move above this level. The thin red line is the level at which you can place short positions in the GBP/USD pair. The thick red line is the target price, since the quote is unlikely to move below this level. MACD line - when entering the market, it is important to be guided by the overbought and oversold zones. Important: Novice traders need to be very careful when making decisions about entering the market. Before the release of important reports, it is best to stay out of the market to avoid being caught in sharp fluctuations in the rate. If you decide to trade during the release of news, then always place stop orders to minimize losses. Without placing stop orders, you can very quickly lose your entire deposit, especially if you do not use money management and trade large volumes. And remember that for successful trading, you need to have a clear trading plan. Spontaneous trading decisions based on the current market situation is an inherently losing strategy for an intraday trader. The material has been provided by InstaForex Company - www.instaforex.com |
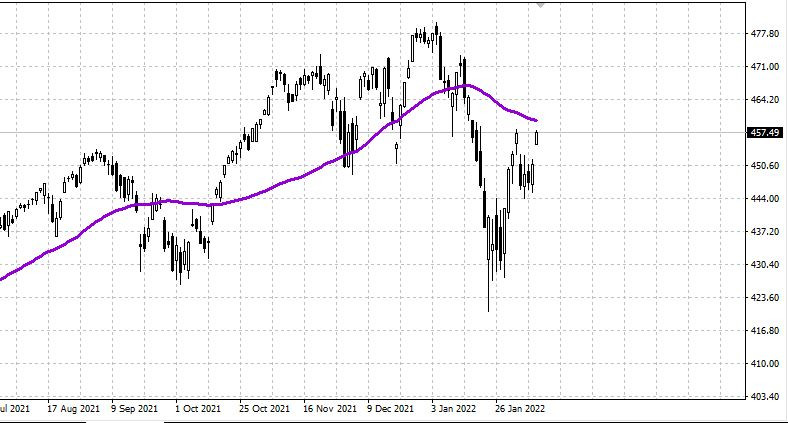
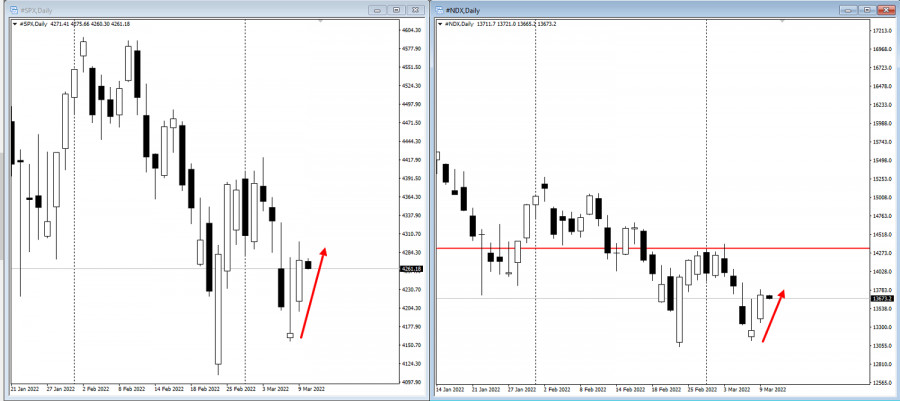
| US stock market on March 10, 2022 Posted: 10 Mar 2022 01:02 AM PST
S&P500 The US market rose on anticipation of an end to the crisis in Ukraine. The Dow added 2%, the NASDAQ rose by 3.6%, and the S&P 500 gained 0.7% on Wednesday. It was the first day of growth for the US market after four days of decline. Developments in Ukraine remain a major topic for politicians and investors. Russian and Ukrainian foreign ministers Lavrov and Kuleba are scheduled to negotiate in Turkey today. The main topics are ceasefire, neutral status of Ukraine, security guarantees for Ukraine, status of DNR/LNR and residents of these regions. According to our source, the issue of Crimea will not be discussed. This increases the chances of progress in the negotiations. Ukraine already has a huge humanitarian crisis after 2 weeks of "special operations". According to the UN, the number of refugees is over 2 million. More than 2,000 civilians have been killed. There is a huge humanitarian disaster in Mariupol. Video and photos of a children's hospital and a maternity hospital destroyed by an aerial bomb are all over the Western media. The situation on the special operations map remains unchanged for almost a week. Oil was down $20, or 15%, yesterday. As of Thursday, Brent is trading at $114. The IEA countries have probably started selling oil from reserves, as promised for a week now. The S&P 500 trades at 4,278 and is expected to be in the range between 4,240 and 4,320. Investors in the US have started to boost the market. Low prices and the good state of the economy are supporting growth. The market hopes that Western efforts to end the conflict in Ukraine will bear fruit after all. A new inflation report for February will be released in the US today. Inflation is expected to be 0.6 to 0.8%. The market is preparing for a Fed rate hike as early as March 16. Gas on the ICE exchange was also down sharply yesterday, to $1,700. However, this is still a critically high price for consumers. The G7 countries are expected to hold an emergency meeting today on energy, oil and gas supply and price. The US remains extremely cautious about removing it from direct involvement in the Ukraine-Russia conflict. The Pentagon has officially denied Poland's plan to hand over obsolete Soviet-era MIG-29 fighter jets to Ukraine, despite repeated requests from Ukraine. USDX is at 98.10 and is likely to trade in the range between 97.80 and 98.30. Yesterday there was a strong pullback not only in oil, but also in the dollar and the euro to the dollar (up). All this gives the impression that secret agreements on Ukraine have been reached and this has leaked into the markets. USD/CAD trades at 1.2815 and is seen moving in the range of 1.2700-1.2900. The pair moved back into range on the dollar and oil retracement. Traders expect the US market to rise again, especially if there is progress in ending the crisis in Ukraine. The material has been provided by InstaForex Company - www.instaforex.com |
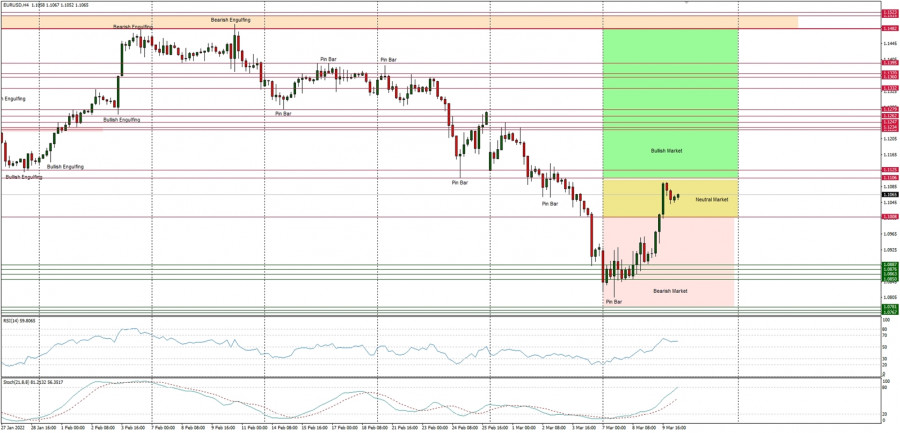
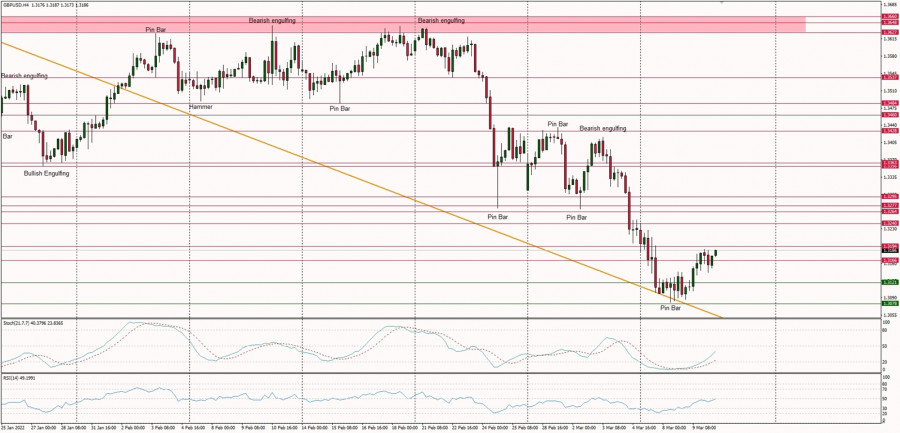
| Trading plan for starters of EUR/USD and GBP/USD on March 10, 2022 Posted: 10 Mar 2022 12:54 AM PST Details of the economic calendar of March 9:Data on open vacancies in the U.S. labor market (JOLTS) were published, the volume of which decreased in January, but this did not play any role in the market. The main driver in the market is still the information and news background related to the current situation in the world. Analysis of trading charts from March 9The technical correction from the support level of 1.0800 managed to return the EURUSD quote above 1.1050. This movement has led to a fairly strong strengthening of the euro in recent days, which removed the oversold status. During the downward movement, the GBPUSD currency pair found a foothold near the upper border of the psychologically important level 1.2950/1.3000/1.3050. As a result, there was a stagnation followed by a price rollback.
March 10 economic calendar:The ECB Governing Council is scheduled for a meeting today, where, given the rapid growth of inflation, it is quite possible to expect a decision to raise the refinancing rate. This step would be logical, however, due to the current situation in the world, the regulator can be expected to be even more cautious in terms of actions. Thus, it will turn out that the ECB will refuse to tighten monetary policy, as a result, this will put even more pressure on the euro. During the American trading session, data on inflation in the United States will be published, which may again reflect an increase in consumer prices from 7.5% to 7.9%. This once again confirms the words of Fed Chairman Jerome Powell that there is no need to expect any slowdown in inflation this year. Time targeting Results of the ECB meeting - 12:45 Universal time ECB press conference - 13:30 Universal time U.S. inflation - 13:30 Universal time Trading plan for EUR/USD on March 10:It can be assumed that the corrective move has already reached the desired scale and soon the market will again see an increase in the volume of short positions. This move will lead to the recovery of the U.S. dollar, followed by an update of the local minimum. Traders consider the price area 1.1120/1.1180 as resistance on the way to correction.
Trading plan for GBP/USD on March 10:A price pullback is seen as a temporary movement in the market. The general mood of traders indicates the prevailing interest in short positions. Thus, holding the price below 1.3100 will most likely lead to a continuation of the downward trend and touching the level of 1.3000.
What is reflected in the trading charts?A candlestick chart view is graphical rectangles of white and black light, with sticks on top and bottom. When analyzing each candle in detail, you will see its characteristics of a relative period: the opening price, closing price, and maximum and minimum prices. Horizontal levels are price coordinates, relative to which a stop or a price reversal may occur. These levels are called support and resistance in the market. Circles and rectangles are highlighted examples where the price of the story unfolded. This color selection indicates horizontal lines that may put pressure on the quote in the future. The up/down arrows are the reference points of the possible price direction in the future. The material has been provided by InstaForex Company - www.instaforex.com |
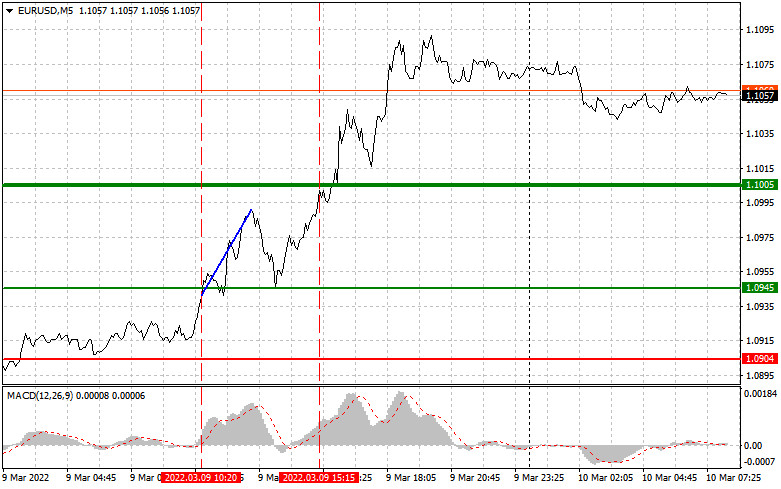
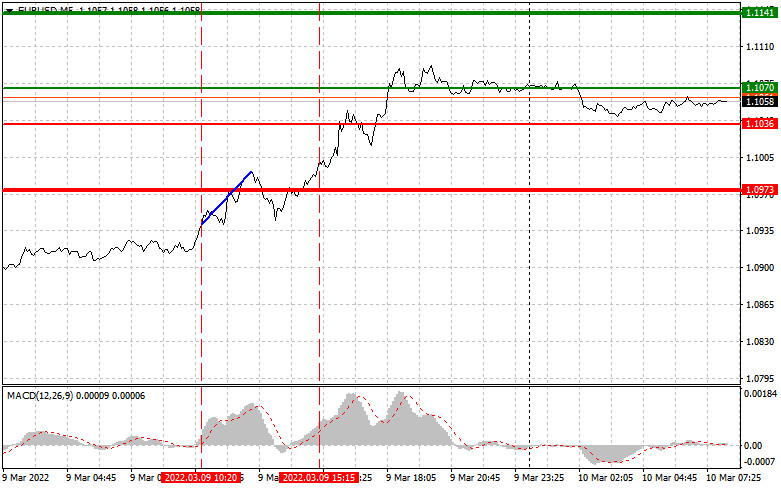
| Analysis and trading tips for EUR/USD on March 10 Posted: 10 Mar 2022 12:51 AM PST Analysis of transactions in the EUR / USD pair A signal to buy emerged after EUR/USD hit 1.0945. Coincidentally, the MACD line was above zero, so the pair rose by 40 pips. The same thing happened in the afternoon, around 1.1005. After a short pause, buyers continued to push euro up, making sellers lose profit. No other signal appeared for the rest of the day.
As expected, the latest employment data in France and industrial production in Italy did little change to the market. There was also no reaction to the labor market report from the US as traders bought euro ahead of the ECB meeting scheduled for today. In light of high inflation, many are expecting the central bank to take a tougher stance on support measures and interest rates. That will be very favorable for the euro. However, the US will also release its latest data on inflation, which could return demand to dollar provided that the figure is higher than expected. Many experts said February will be the peak of consumer inflation in the US, but after recent events, especially in the energy market, an inflation of 8.0% can only be the beginning of what the US will face in the near future. There will also be a report on US jobless claims, and its figure could also influence the direction of EUR/USD today. For long positions: Buy euro when the quote reaches 1.1070 (green line on the chart) and take profit at the price of 1.1141 (thicker green line on the chart). A rally will occur if the ECB takes a more aggressive approach on monetary policy. But before buying, make sure that the MACD line is above zero or is starting to rise from it before taking long positions. It is also possible to buy at 1.1036, but the MACD line should be in the oversold area as only by that will the market reverse to 1.1070 and 1.1141. For short positions: Sell euro when the quote reaches 1.1036 (red line on the chart) and take profit at the price of 1.0973. Pressure will return if the ECB announces a soft monetary policy, and if the US releases a strong inflation report. But before selling, make sure that the MACD line is below zero, or is starting to move down from it. Euro can also be sold at 1.1070, however, the MACD line should be in the overbought area, as only by that will the market reverse to 1.1036 and 1.0973.
What's on the chart: The thin green line is the key level at which you can place long positions in the EUR/USD pair. The thick green line is the target price, since the quote is unlikely to move above this level. The thin red line is the level at which you can place short positions in the EUR/USD pair. The thick red line is the target price, since the quote is unlikely to move below this level. MACD line - when entering the market, it is important to be guided by the overbought and oversold zones. Important: Novice traders need to be very careful when making decisions about entering the market. Before the release of important reports, it is best to stay out of the market to avoid being caught in sharp fluctuations in the rate. If you decide to trade during the release of news, then always place stop orders to minimize losses. Without placing stop orders, you can very quickly lose your entire deposit, especially if you do not use money management and trade large volumes. And remember that for successful trading, you need to have a clear trading plan. Spontaneous trading decisions based on the current market situation is an inherently losing strategy for an intraday trader. The material has been provided by InstaForex Company - www.instaforex.com |
| US and European stock markets advance amid Ukraine talks, UAE oil production hike Posted: 10 Mar 2022 12:44 AM PST
The commodity market has halted its upsurge after the United Arab Emirates proposed the OPEC+ alliance to increase oil production. Although UAE energy minister Suhail al-Mazrouei have downplayed the statement, crude oil prices fell below $110 per barrel. On Wednesday, a top foreign policy aide to Ukraine's president stated that Ukraine was open to discussing its neutral status, giving some optimism to market players. Afterwards, gold decreased by $70, while oil fell by $22.
Equities continued its upwards bounce on Thursday, as traders with long positions assumed the economic impact of the war in Ukraine was finally priced in after weeks of market fluctuations. Oil prices have stabilized after dropping sharply earlier The MSCI AC Asia Pacific Index gained more than 2% in one of the biggest jumps since November 2020. European index futures have advanced, and US futures were mixed after main indexes in the USA and Europe made the biggest intraday gains since 2020. Amazon.com Inc. gained 10% at the end of the session after the company announced a 20-1 stock split and a $10 billion share buyback.
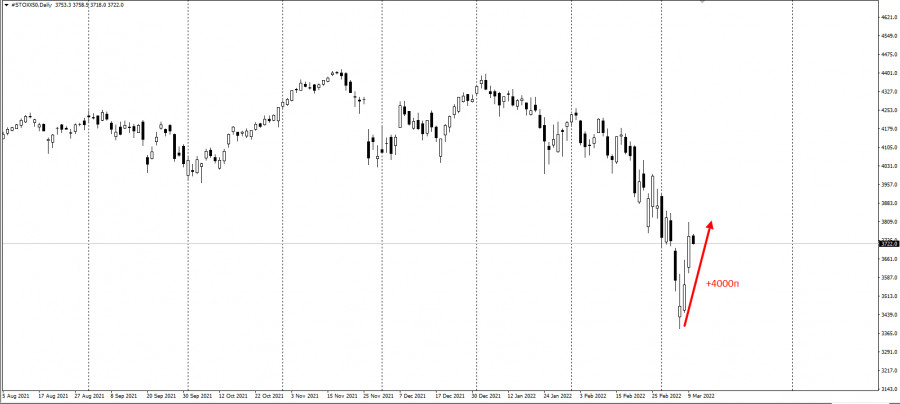
The STOXX 50 has made the biggest 3-day jump since the beginning of 2022:
Yesterday, the US House of Representatives voted in favor of banning Russian energy imports, passed the $1.5 billion spending plan and approved granting Ukraine a financial aid package of $13.6 billion. In Asia, Rio Tinto Group announced it would join other corporations and sever all ties with Russia. However, the market rally could be short-lived, as investors are gauging the risks of an inflationary shock that could jeopardize worldwide economic growth. Furthermore, the Federal Reserve System is set to raise interest rates next week. It is expected to be the first rate hike out of several. US CPI index is likely to reach another high on Thursday. While the commodity price upsurge seems to be stalled at this point, the war in Ukraine and sanctions against Russia continue to influence markets. "It's going to be a persistently higher inflation environment for the rest of 2022," Erin Browne, multi asset portfolio manager at Pacific Investment Management Co., told Bloomberg. "What you're starting to see is not only the first-degree hit of commodities, but the feed-through with some of the supply-chain challenges to be exacerbated because of the conflict." In South Korea, conservative candidate Yoon Suk-yeol won the presidential election. The return of conservatives to power signals South Korea would follow a more hawkish foreign policy towards China and North Korea. Today's main event on the economic calendar is the release of US inflation data. The material has been provided by InstaForex Company - www.instaforex.com |
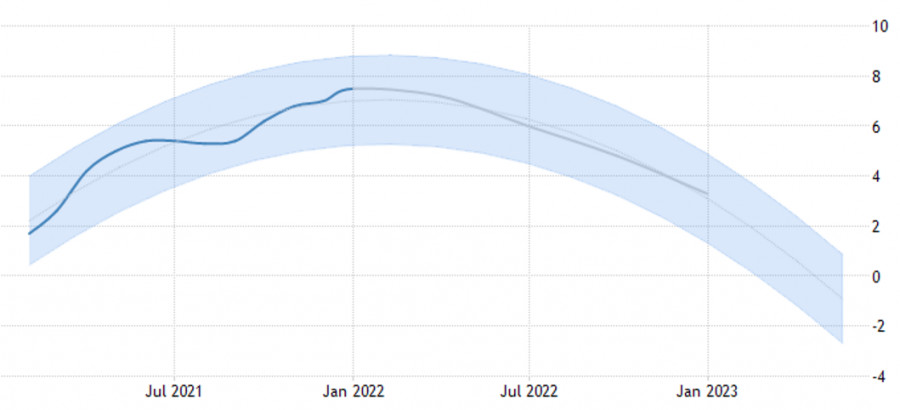
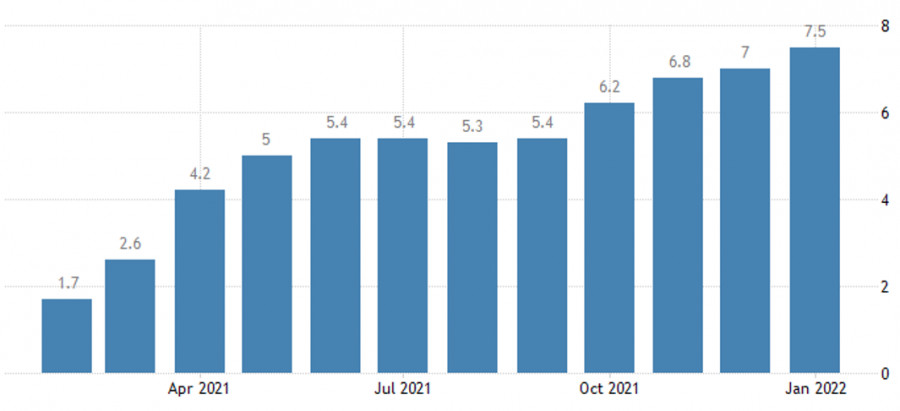
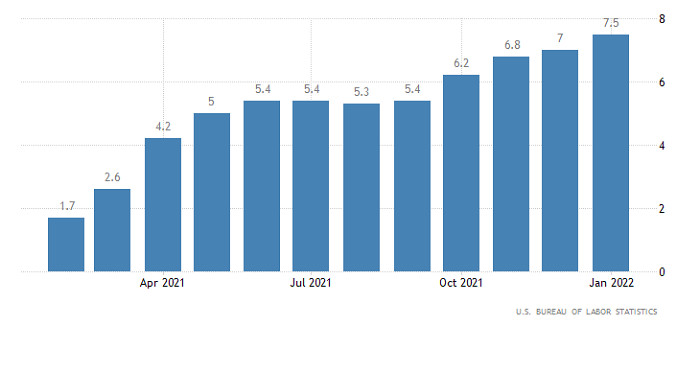
| US inflation to rise above 8.0% Posted: 10 Mar 2022 12:20 AM PST Many experts recently said that February will be the peak of consumer inflation in the U.S., but after recent events, especially in the energy market, inflation of 8.0% may be just the beginning of what the U.S. will face in the near future. A very important report on the consumer price index in the United States will be released today. Inflation is forecast to jump to 7.8% in February from last year, the highest level since 1982. But already now there are those who are confident in inflation around 8.5%, and this will not be the end, but only the beginning of problems for the Federal Reserve System and the country's economy. The military special operation of Russia on the territory of Ukraine and the sanctions that followed immediately after that from the EU, the USA and a number of other countries spurred energy prices to such highs, from which to return very quickly will be quite difficult. Strict restrictions for the Russian economy will not pass without leaving a trace for the commodity market, since practically the entire European continent is directly dependent on oil and gas supplies for the normal functioning of the economy.
It is expected that in the next six months there will be a lot of noise in the oil and gas market, in which it will become difficult to make out where the real prices are, and where the impact of sanctions and speculators. Americans are already facing multi-year inflation that is outpacing wages, and the situation is only going to get worse. Geopolitical tensions have already driven food prices to record highs, with the average gas price at $4.25 a gallon. In some states, it even exceeds $5. Fuel prices will continue to rise, as yesterday it became known that the United States is introducing a ban on the import of Russian oil. A new bill by the House of Representatives bans the import of Russian crude oil, liquefied natural gas, coal, and refined products such as gasoline and kerosene. The bill will enter into force 45 days after its adoption. According to American politicians, this was a response to the escalation of the conflict between Russia and Ukraine after the start of a military operation on its territory. Russia, in response to Biden's decision, issued an order stating that in response it would restrict trade in certain goods and raw materials, but did not mention key details of which categories of goods could be affected. Some economists are already acknowledging that an oil shock will slow U.S. growth, but it certainly won't be enough to completely undermine the recovery, which is being driven by a strong labor market and an easing of Covid-related restrictions. As early as next week, the Federal Reserve is expected to raise interest rates for the first time since 2018, and rising energy prices will only add uncertainty to the central bank's rate hike cycle this year and next. The CPI report, released on Thursday, will reflect the recent rise in oil prices, but most of it will be visible only in the coming months, since the active growth in energy products occurred just at the end of February this year. The data will also give a good indication of future prices for cars, home furnishings and housing. Already, the cost of housing, including rent, is rising steadily in the U.S., and this trend is expected to continue for the foreseeable future. Economists expect CPI growth on an annualized basis to average 7.7% per annum, compared with 7% reflected in the February survey. The consumer price index is also expected to rise by 4.5% over the past three months, more than a percentage point above the previous forecast.
Experts also note that the observed increase in food prices in itself will not have such a big impact on overall inflation as a similar increase in oil prices, however, consumer dissatisfaction is already obvious, who are clearly running out of money faster than they planned. Food and gasoline make up nearly one-fifth of the U.S. consumer basket, and that share is set to rise sharply in the near future for low-income households. In addition to higher food and gas costs, Americans are simultaneously dealing with higher rents and utility bills. Economists at Barclays Plc expect the surge in energy prices to reduce consumption growth by 0.3 percentage points year-on-year, on average for the quarter to the end of 2023. It is also expected that consumer sentiment in the U.S., fall to a new ten-year low in early March, according to the University of Michigan. The report is scheduled for release this Friday. Economists from Barclays Plc note that the U.S. economy has become much more resilient to changes in oil prices compared to past decades. Fortunately, the blow to energy prices comes at a time when the U.S. economic recovery is strong enough and on solid footing. Note that according to the U.S. Department of Labor, 678,000 jobs were created last month, and the unemployment rate approached pre-pandemic levels. And while pandemic relief programs have been phased out, consumers are still sitting on a "significant pile" of excess savings. The downside is that wages have not kept pace with inflation and could fall further. As for the technical picture of the EURUSD pair The euro is responding with growth to the expected data on inflation in the U.S., and traders are rapidly fixing profits. Although euro bulls have returned to resistance around 1.1100, which keeps the demand for a trading instrument, however, geopolitical tensions around Russia and Ukraine will limit the upward potential of the pair. Euro buyers need to consolidate above 1.1140, which will allow to continue the correction to the highs: 1.1230 and 1.1310. A decrease in the trading instrument will be met with active purchases in the 1.1000 area. However, the area of 1.0880 remains the key support level. As for the technical picture of the GBPUSD pair The buyers of the pound showed themselves after the recent major fall of the pair, and are now focused on the resistance of 1.3194. The return to control of this range will allow us to count on a more powerful correction of the pair in the area of 1.3240 and 1.3320. However, the prospects for growth are overshadowed by Russia's military operation on the territory of Ukraine. If we go below 1.3140, then the pressure on the trading instrument will increase. In this case, we can expect a repeated fall to 1.3085 and the exit of the trading instrument to new lows: 1.3030 and 1.2920. The material has been provided by InstaForex Company - www.instaforex.com |
| Trading plan for EUR/USD and GBP/USD on March 10, 2022 Posted: 10 Mar 2022 12:06 AM PST The EU refused to impose a ban on Russian oil and gas imports. This decision favored the energy market and resulted in a dramatic reduction in oil prices. Moreover, the foreign exchange market faced a sharp correction. For example, the single European currency rose significantly. This growth is evidently limited compared to its previous fall. Besides, the dollar will further strengthen. It dropped slightly yesterday, though the decline was temporary. Moreover, the local rebound was expected. The news background remains negative for the pound. The fighting escalates in Ukraine, provoking the outflow of capital from the EU. The sanctions imposed on Russia are probably more harmful to Western Europe. Besides, the situation has not changed. Therefore, yesterday's rise of the single European currency is considered a local rebound. Moreover, the European Central Bank Board meeting will unlikely improve the current situation. The ECB is not willing to change its monetary policy. However, if the European regulator decides to raise the refinance rate, it will have a temporary effect. The current events are large-scale and their consequences are unpredictable. Therefore, the level of interest rates is irrelevant. Likewise, US inflation should accelerate from 7.5% to 7.9%. However, this is February's data. It is evident that US inflation will skyrocket by the end of March. Besides, this fact is indicated by the rapid increase in gasoline prices. Moreover, this global issue is of key importance. Russia's special military operation in Ukraine and a huge number of sanctions imposed on Russia caused chaos in the world, resulting in a rapid increase in global consumer prices. Overall, as noted above, the current events are highly significant. Therefore, macroeconomic statistics are irrelevant now. Inflation (United States):
The EUR/USD pair managed to consolidate above 1.1050 due to a rapid correction from the pivot point of 1.0800. This move may indicate regrouping of trading forces, stimulating a downtrend. Therefore, the volume of short positions will probably increase soon, resulting in a price reversal. The GBP/USD pair pulled back after it temporarily consolidated at 1.3080. This move has led to the pound's partial recovery compared to its recent decline. The pullback is probably temporary. The pair resumed its downtrend. Consequently, the local low will most likely be renewed. |
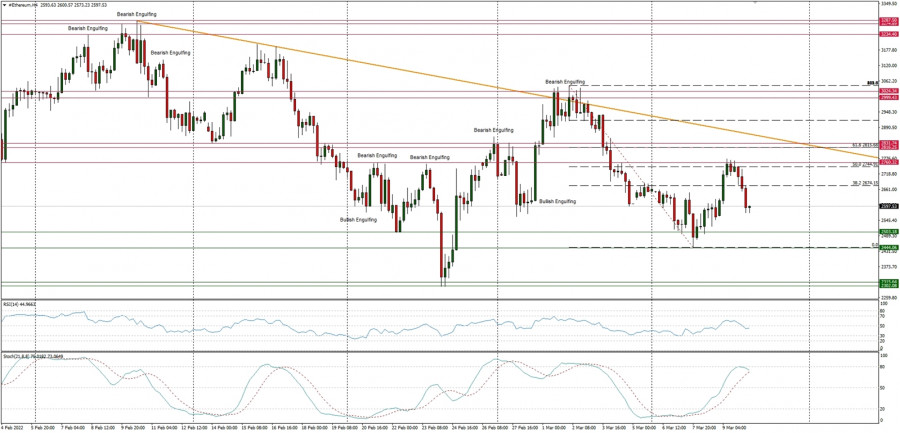
| Technical Analysis of ETH/USD for March 10, 2022 Posted: 10 Mar 2022 12:04 AM PST Crypto Industry News: Many people from around the world willingly supported Ukraine with cryptocurrencies, which allowed to avoid intermediaries and gave a guarantee that the money went where it was really needed. Despite initial concerns that the request for cryptocurrencies had been posted by hackers, it was quickly confirmed that Ukraine was indeed using new technologies to raise money. This allowed the purchase of the necessary military equipment (including bulletproof vests and food rations). So far, nearly $ 15 million has been used out of the more than $ 64 donors have deposited in cryptocurrencies. Already on March 4, it was reported that during the week it was possible to collect cryptocurrencies worth more than 50 million dollars. Ultimately, it is to be selected min. $ 100M. Collecting such an amount seems more and more real, especially as the total donation has already exceeded $ 64.6 million. The information available so far shows that Ukraine has used more than 1/4 of these funds to rearm the army. Technical Market Outlook The ETH/USD pair has bounced from the temporary bottom seen at the level of $2,444 and broke through the technical resistance seen at $2,611. Nevertheless, the bounce was capped at the 50% Fibonacci retracement level seen at $2,744 and then the market reversed due to the intense bearish pressure. Market conditions are now extremely overbought as well, so with the negative momentum on the H4 time frame the down move might be continued towards the technical support seen at $2,503 and $2,444. Weekly Pivot Points: WR3 - $3,323 WR2 - $3,179 WR1 - $2,855 Weekly Pivot - $2,718 WS1 - $2,386 WS2 - $2,240 WS3 - $1,190 Trading Outlook: The market keeps trying to bounce higher after over the 50% retracement made since the ATH at the level of $4,868 was made. The level of $3,192 is the next key Fibonacci retracement for bulls, but the bulls had failed to break through three times already. On the other hand, the next long-term technical support is located at $1,721 (61% Fibonacci retracement of the last big impulsive wave up) is still the key long-term.
|
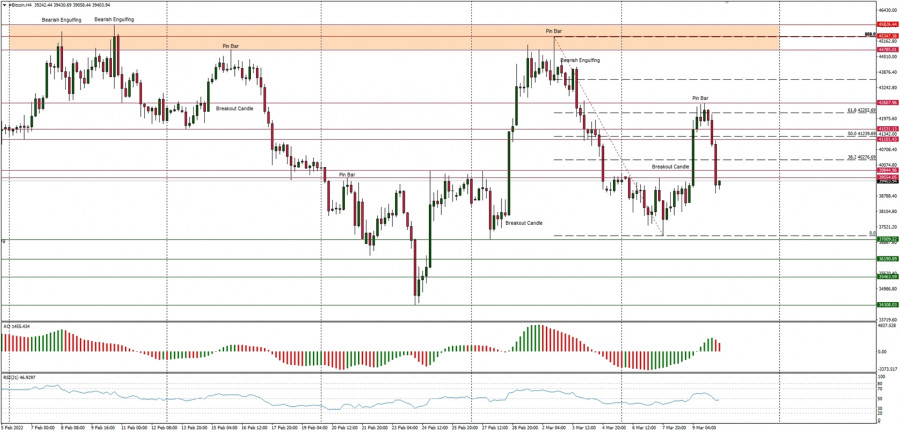
| Technical Analysis of BTC/USD for March 10, 2022 Posted: 09 Mar 2022 11:56 PM PST Crypto Industry News: The European Union explained that the sanctions imposed on Russia and Belarus cover cryptographic assets. In Wednesday's statement, the EU said cryptocurrencies fell into the "transferable securities" category and therefore clearly fell under the sanctions imposed on Russia for invading Ukraine and Belarus for its involvement. "Today's package makes it clear that crypto assets fall under the" transferable securities "scope. It has been, but today's text clarifies the point. It also confirms the common understanding that loans and credits also include crypto assets," an EU official said. The EU also announced that the existing financial restrictions would be extended to Belarus to reflect those already in place in Russia. These include sanctions in the provision of SWIFT services to three Belarusian banks and their subsidiaries, a ban on transactions with the Central Bank of Belarus, and a ban on the listing of securities for Belarusian state-owned shares in EU trading venues. US lawmakers have voiced concerns that cryptocurrencies could be used by Russia as a means of avoiding sanctions, but the extent of this is debatable. Technical Market Outlook The BTC/USD pair had been rallying back above the level of $40k and a new, local high was made at $42,607, but the rally was capped at the 61% Fibonacci retracement of the last wave down and the market has returned below $40k again. The nearest technical support is seen at the level of $39,554 and $37,009. Only a sustained breakout above the supply zone located between the levels of $44,875 - $45,826 would change the outlook to more bullish in the near term. Weekly Pivot Points: WR3 - $50,991 WR2 - $48,083 WR1 - $42,916 Weekly Pivot - $40,144 WS1 - $35,041 WS2 - $32,033 WS3 - $26,666 Trading Outlook: The market still keeps trying to bounce after over the 60% retracement made since the ATH at the level of $68,998 was made. The level of $45,427 is the key technical resistance for bulls, but the game changing technical supply zone is seen between the levels of $52,033 - $52,899. When this zone is clearly broken, the BTC is back to the up trend, otherwise the bearish pressure might push down the BTC towards the level of $29,254.
|
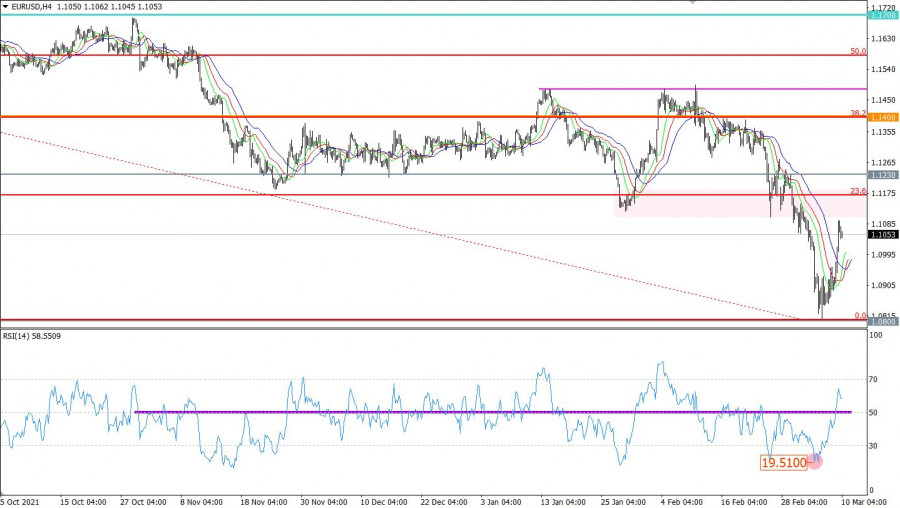
| Hot forecast for EUR/USD on March 10, 2022 Posted: 09 Mar 2022 11:50 PM PST Europe's refusal to impose a ban on the import of Russian oil and gas somewhat calmed the energy market. This led to a significant drop in oil prices. Along with it, a fairly noticeable correction took place in the foreign exchange market. In particular, the single European currency was able to demonstrate impressive growth. Of course, it fades against the background of the previous fall, but still, it is growth. However, there can be no question of any completion of the trend for the strengthening of the dollar. What happened yesterday is just a temporary respite. Moreover, a local rebound was already suggesting itself. There just wasn't a good reason. The information background for the pound was, and still is, extremely negative. War continues in Ukraine, which in itself provokes the flight of capital from the European continent. The sanctions confrontation between Russia and the West seems to cause the greatest damage to Western Europe, which only reinforces this trend. And by and large, the situation has not changed in any way so far, so yesterday's growth of the single European currency is really just a local rebound that does not change the overall picture. Just as today's meeting of the European Central Bank's Governing Council will not change it. And it's not just that the European regulator does not intend to change anything in its monetary policy. Even if they decide to unexpectedly raise the refinancing rate, this will only give a temporary effect. The events taking place are so large-scale, and the consequences are really unpredictable, that the level of interest rates does not matter now. The technical correction from the support level of 1.0800 managed to return the EURUSD quote above 1.1050. This movement has led to a fairly strong strengthening of the euro in recent days, which removed the oversold status. Now the RSI technical instrument is moving in the upper area of the 50/70 indicator in a four-hour period. This signals that the correction has a full-size view. The Alligator H4 indicator has a crossover between the MA lines, which confirms the stage of correction and signals a slowdown in the downward trend. Alligator D1 indicates a downward trend. There are no intersections between MA lines. Expectations and prospects: It can be assumed that the corrective move has already reached the desired scale and soon the market will again see an increase in the volume of short positions. This move will lead to the recovery of the U.S. dollar, followed by an update of the local minimum. Traders consider the price area 1.1120/1.1180 as resistance on the way to correction. Comprehensive indicator analysis gives a signal to buy in the short term due to a correction. Indicators in the intraday and medium-term periods give a sell signal due to a downward trend.
|
| Technical Analysis of EUR/USD for March 10, 2022 Posted: 09 Mar 2022 11:50 PM PST Technical Market Outlook The EUR/USD pair has bounced from the low made at the level of 1.0806 and had entered the neutral zone . The bulls might have a chance to continue the rally higher, but the technical resistance located at the level of 1.1106 must be broken first. The key technical resistance on the weekly time frame chart is located at 1.1245. The local demand zone seen between the levels of 1.0850 - 1.0888 might be good for a temporary bounce towards the level of 1.0935, but it will not hold the bearish pressure for long. The next long term technical support for bulls is seen at the level of 1.0726 and 1.0639 Weekly Pivot Points: WR3 - 1.1463 WR2 - 1.1348 WR1 - 1.1096 Weekly Pivot - 1.0991 WS1 - 1.0737 WS2 - 1.0618 WS3 - 1.0318 Trading Outlook: The market is still in control by bears that pushed the price way below the level of 1.1245, so a breakout above this level is a must for bulls for a trend reversal. The next long-term technical support is located at 1.0639. The up trend can be continued towards the next long-term target located at the level of 1.1494 (high from 06.02.2022) only if bullish cycle scenario is confirmed by breakout above the level of 1.1186 and 1.1245, otherwise the bears will push the price lower towards the next long-term target at the level of 1.0639 or below.
|
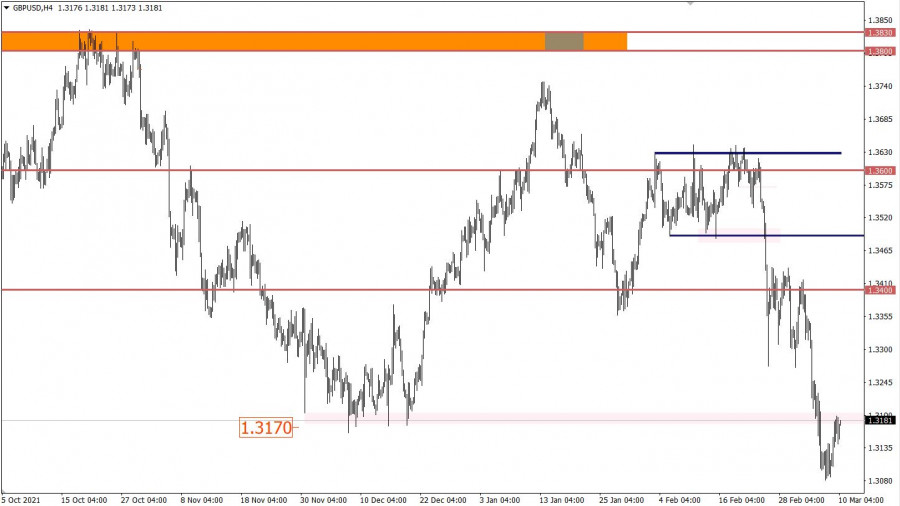
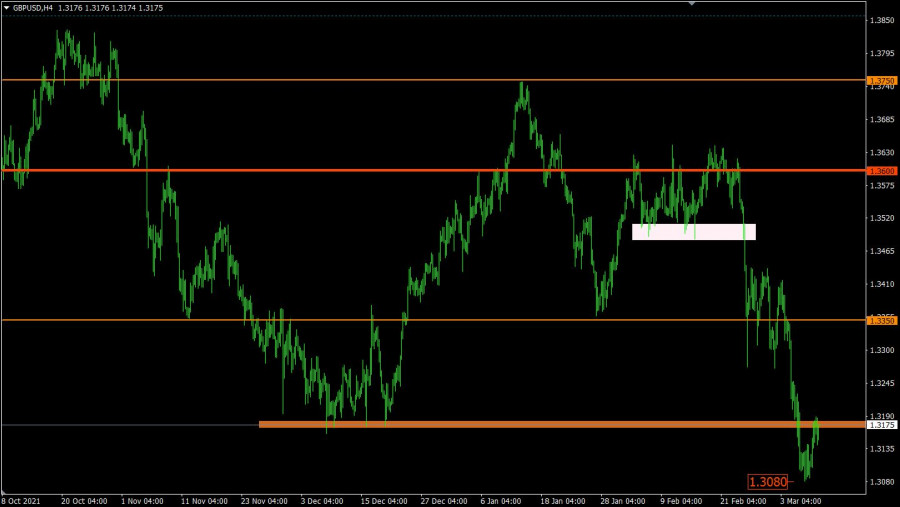
| Technical Analysis of GBP/USD for March 10, 2022 Posted: 09 Mar 2022 11:46 PM PST Technical Market Outlook The GBP/USD pair has bounced after the trend line support test and is heading towards the nearest technical resistance located at 1.3194. The key technical resistance on the weekly time frame chart is located at 1.3749. The local demand zone seen between the levels of 1.3194 - 1.3166 might be good for a temporary bounce towards the level of 1.3240 - 1.3266, but it will not hold the bearish pressure for long. The market keeps trading inside the bearish zone and only a sustained breakout above the level of 1.3294 would temporary change the outlook to neutral. In a case of a breakout to the downside, the next long term technical support for bulls is seen at the level of 1.3038 and 1.3028. Weekly Pivot Points: WR3 - 1.3574 WR2 - 1.3504 WR1 - 1.3346 Weekly Pivot - 1.3272 WS1 - 1.3112 WS2 - 1.3030 WS3 - 1.2877 Trading Outlook: If the market will break below the level of 1.3169, the up trend on the weekly time frame is terminated and the bears enforce and confirm their control over the market in the long term. The Cable is below 100 and 200 WMA already, so the bearish domination is clear. The next long term target for bears is seen at the level of 1.2751 and 1.2663. Please remember: trend is your friend.
|
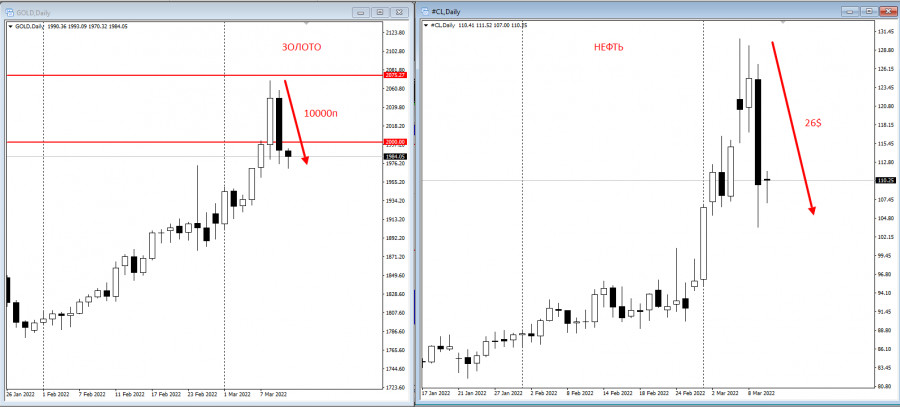
| Market participants await US CPI data Posted: 09 Mar 2022 11:26 PM PST
Gold prices traded near daily lows after losing more than $70 and falling below $2,000 per ounce. A sell-off in the gold market coincided with a 10% drop in the oil market, while risky assets such as equities and cryptocurrencies posted solid gains. On Wednesday, the rally in commodities slowed down, with oil, platinum, silver, copper, wheat, and corn losing value. West Texas Intermediate crude fell by 10%. Brent crude oil collapsed by 11%.
On the other hand, risky assets recovered. The Dow Jones Industrial Average was up by 2.35%. The S&P added 2.79%. Bitcoin also surged along with US stocks, climbing by 8%. Gold failed to extend gains after reaching a new all-time high of $2,078.80 on Tuesday. The precious metal reacted negatively to recovery in risk appetite on Wall Street, although the situation in Ukraine had not yet improved. Optimism returned to Wall Street after Ukrainian President Volodymyr Zelensky said he was no longer pressing for NATO membership for Ukraine. Like other commodities, gold is likely to remain a highly volatile asset as market participants continue to mull over developments in Ukraine and potential supply risks. Nevertheless, with geopolitical tensions brewing and uncertainty around the global economy, gold may start rising again, Exinity Group analyst Han Tan believes. As for macroeconomic indicators, traders may take notice of US consumer prices to be released today. According to economists, the inflation rate accelerated in February. The annual inflation rate is forecast to have risen by 7.9% in February after hitting a 40-year high of 7.5% in January. The latest CPI data comes just a week before the interest rate decision. Federal Reserve Chair Jerome Powell said he was inclined to propose and support a 25-basis-point rate hike at the central bank's next policy meeting. The recent surge in commodity prices has raised fears that inflation will remain high for a long time to come. DoubleLine Capital CEO Jeffrey Gundlach said inflation could rise to 10%, which would force the US Federal Reserve to act more aggressively. The material has been provided by InstaForex Company - www.instaforex.com |


| You are subscribed to email updates from Forex analysis review. To stop receiving these emails, you may unsubscribe now. | Email delivery powered by Google |
| Google, 1600 Amphitheatre Parkway, Mountain View, CA 94043, United States | |


Comments