Forex analysis review
Forex analysis review |
- Technical analysis of GBP/USD for March 17, 2022
- Technical analysis of EUR/USD for March 17, 2022
- March 17, 2021 : EUR/USD daily technical review and trading opportunities.
- March 17, 2021 : EUR/USD Intraday technical analysis and trading plan.
- March 17, 2021 : GBP/USD Intraday technical analysis and significant key-levels.
- BTC update for March 17,.2022 - Upisde continuation in play
- EURUSD pushes higher to give hopes to bulls.
- Trading signals for Bitcoin (BTC/USD) on March 17-18, 2022: buy above $39,550 (21 SMA - 200 EMA)
- EUR/USD. Fed March meeting result: hawkish but not aggressive
- Gold bulls reclaim $1,930.
- Dollar index weekly analysis.
- Analysis of Gold for March 17,.2022 - Key pivot resistance at the price of $1.960
- Cardano is providing a bullish signal.
- Solana price breaks above cloud resistance.
- Analysis of GBPUSD for March 17,.2022 - Main upside target reached and potetnial for downside rotation
- Trading plan for Gold for March 17, 2022
- EUR/USD Hot Forecast on 17 March
- GBP/USD Hot Forecast on 17 March
- Bitcoin: Friday options expiration suggests significant bull lead
- Trading signals for GBP/USD on March 17-18, 2022: buy above 1.3068 (21 SMA - downtrend channel)
- Bitcoin steadily increasing and even crypto skeptics believe in its potential
- Major Asian indices show significant gains
- Trading tips for gold
- Bank of England intends to maintain an aggressive approach to monetary policy
- The results of the Bank of England's monetary policy meeting
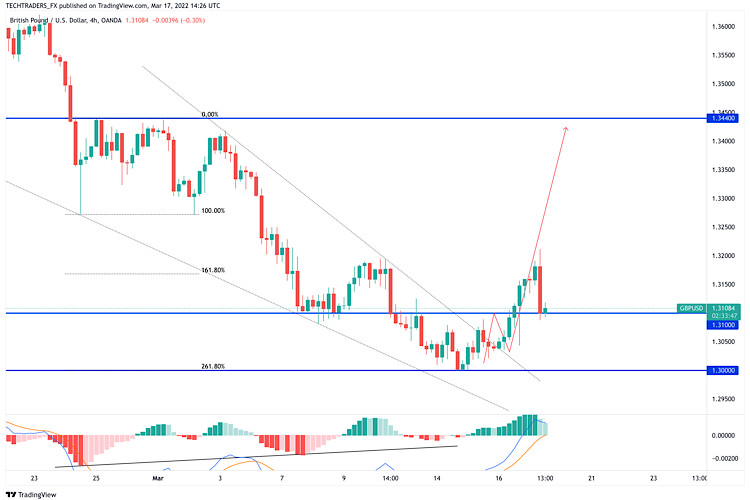
| Technical analysis of GBP/USD for March 17, 2022 Posted: 17 Mar 2022 01:01 PM PDT Overview : Resistance of the GBP/USD pair is seen at the level of 1.3207. The pair is trading below its resistance for a while. It is likely to trade in a lower range as long as it remains below resistance. Furthermore, you should bear in mind that resistance has set at 1.3207. The GBP/USD pair has not made a significant movement from yesterday. There are no changes in my technical outlook. The bias remains bearish in the nearest term testing 1.3098 or lower. If the trend can break the first target at 1.3098, the market will call for a strong bearish trend towards the next target at 1.3002 on the one-hour chart. Please, note that the prices of 1.3207 and 1.3256 coincide with the Fibonacci of 50% and 61.8% respectively. The trend is still calling for a strong bearish market from the area of 1.3207 - 1.3256. Sellers are asking for a high price (1.3207 or/and 1.3256). RSI is seeing major resistance below 60 % and a bearish divergence vs price also signals that a reversal is impending. As a result, it is gainful to sell below this price of 1.3207 with targets at 1.3098 and 1.3002. However, stop loss has always been in consideration. Thus it will be useful to set it above the last double top at the level of 1.3256 (notice that the major resistance today has set at 1.3256 ).
|
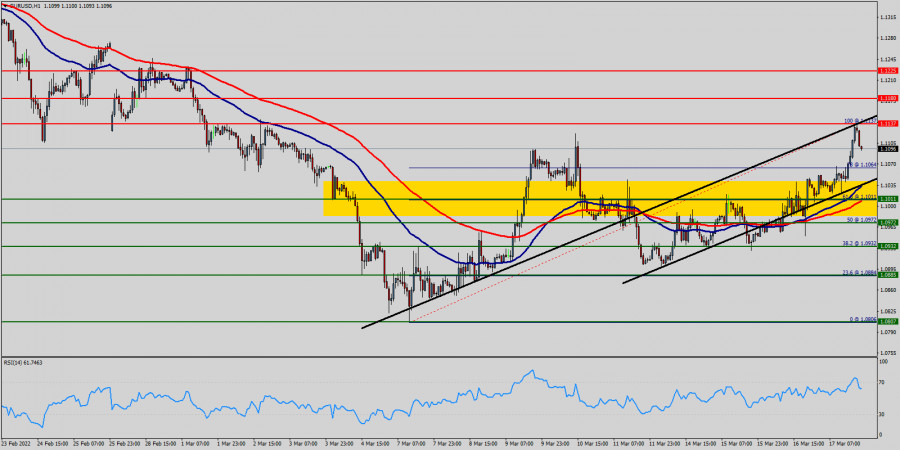
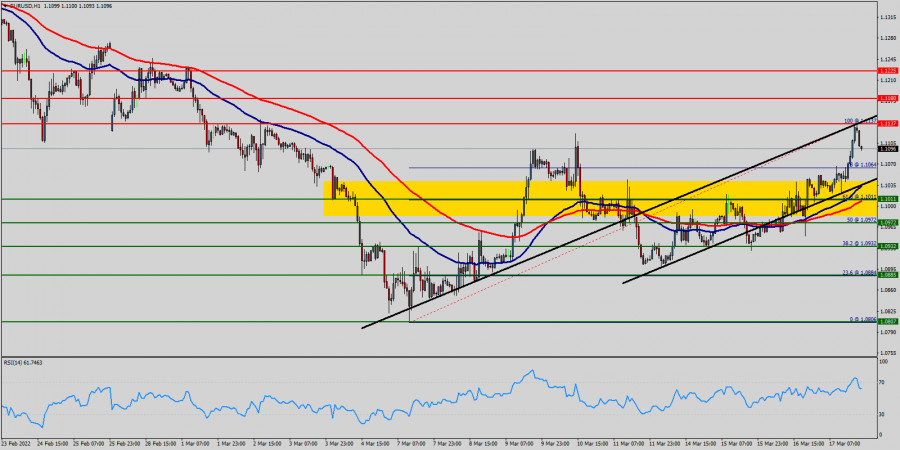
| Technical analysis of EUR/USD for March 17, 2022 Posted: 17 Mar 2022 12:44 PM PDT Overview : In the one-hour time frame, the trend is still bullish as long as the level of 1.0972 is not broken. The level of 1.0972 has been rejected several times confirming the validity of a bullish market today. The support level is seen at 1.0972 . The market is still indicating a strong bullish trend from the spot of 1.0972. Thereupon, it would be wise to buy above the level of at 1.0972 with the primary target at 1.1137, which represent the ratio of 100% Fibonacci - last bullish wave - top. We expect the EUR/USD pair to continues moving in an uptrend above the level of 1.1137 towards the second target at 1.1180, while major resistance is found at 1.1225. On the downside, a clear break below 1.1137 could trigger further bearish pressure testing 1.1011, which coincides with a triple bottom. Moreover, the RSI is becoming to signal a downward trend, as the trend is still showing strong above the moving average (100) and (50). Then, the trend is keeping its bearish momentum today. As a result, it is gainful to sell below this price with targets at 1.1137 and 1.1011. We expect a new range below the area of 1.1011 towards the daily support of 1.0972. The bias remains bearish in the nearest term testing 1.0972 and 1.0932. Consequently, the EUR/USD pair will probably be moved between the levels of 1.0932 and 1.1137. Alternatively, stop loss has always been in consideration. Hence, it will be useful to set it above the resistance of 1.1225.
|
| March 17, 2021 : EUR/USD daily technical review and trading opportunities. Posted: 17 Mar 2022 11:06 AM PDT
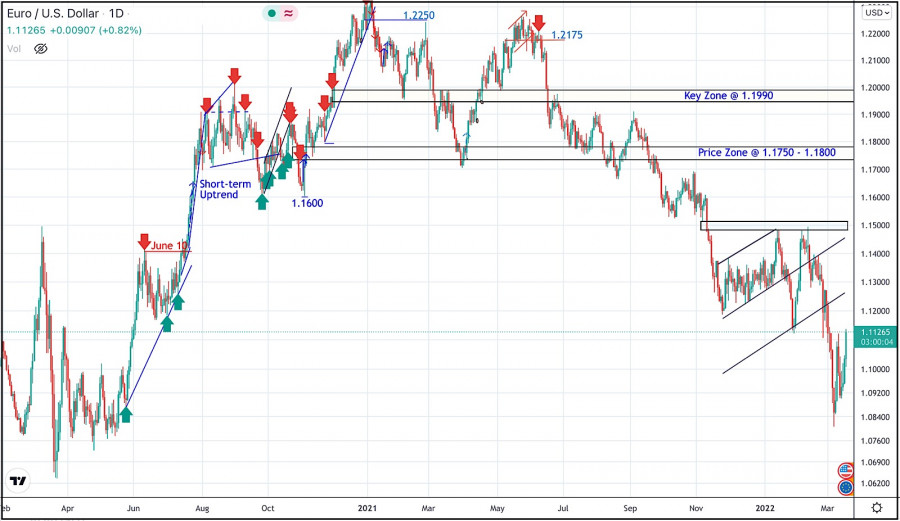
During the past few weeks, the EURUSD pair has been trapped within a consolidation range between the price levels of 1.1700 and 1.1900. In late September, Re-closure below the price level of 1.1700 has initiated another downside movement towards 1.1540. Price levels around 1.1700 managed to hold prices for a short period of time before another price decline towards 1.1200. Since then, the EURUSD has been moving-up within the depicted movement channel until bearish breakout occurred by the end of last week's consolidations. Few weeks ago, the price zone of 1.1350 failed to offer sufficient bearish rejection that's why it was bypassed until 1.1500 which applied significant bearish pressure on the pair. A possible SELL Entry was offered upon the previous ascending movement towards 1.1500 which provided significant bearish pressure. Shortly after, the EURUSD looked oversold while approaching the price levels of 1.0850. That's where the current upside movement was initiated. Any movement towards 1.1200 should be considered for another SELL trade as long as sufficient SELLING pressure is demonstrated. The material has been provided by InstaForex Company - www.instaforex.com |
| March 17, 2021 : EUR/USD Intraday technical analysis and trading plan. Posted: 17 Mar 2022 11:05 AM PDT
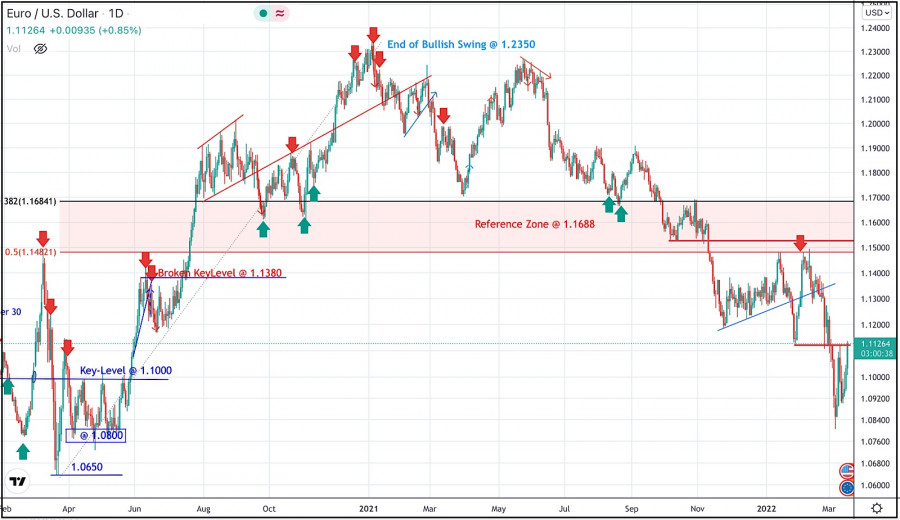
Recent bullish pullback towards 1.1650-1.1680 (upper limit of the previous consolidation range) was expected to offer bearish rejection and a valid SELL Entry. Significant bearish decline brought the EURUSD pair again towards 1.1550 levels which failed to provide sufficient BUYERS for too long period. Hence, only a short- term sideway movement was demonstrated around 1.1550 before quick bearish decline could occur towards 1.1200. On the other hand, the price levels around 1.1520 stood as a reference zone that applied significant bearish pressure upon two successive bullish visits. Recent Bearish decline below 1.1100 was considered as a bearish continuation sign. That's why, downside movement was expected to proceed towards 1.1000 then 1.0920 where the current bullish pullback was initiated. The price levels around 1.1100 should be watched upon any upcoming bullish move for bearish rejection and a possible SELL Entry. However, failure to do so will probably enable more bullish advancement towards 1.1320. The material has been provided by InstaForex Company - www.instaforex.com |
| March 17, 2021 : GBP/USD Intraday technical analysis and significant key-levels. Posted: 17 Mar 2022 11:04 AM PDT
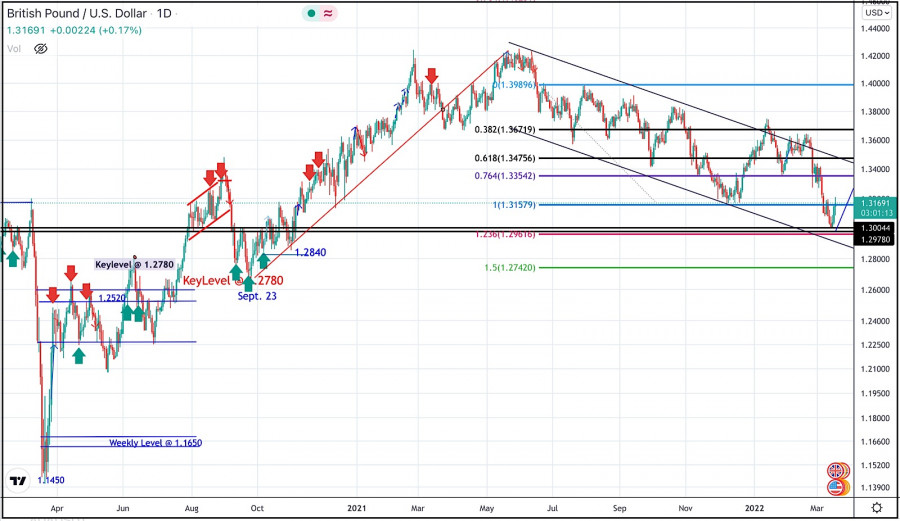
The GBPUSD pair has been moving within the depicted bearish channel since July. Bearish extension took place towards 1.3220 where the lower limit of the current movement channel came to meet with Fibonacci level. Shortly after, BUYERS were watching the price levels of 1.3730 to have some profits off their trades as it stood as a key-resistance which offered significant bearish rejection recently. The short-term outlook turned bearish when the market went below 1.3600. This enhanced the bearish side of the market towards 1.3400 which brought the pair back towards 1.3600 for another re-test. Hence, the recent bullish pullback towards 1.3600 should have been considered for SELL trades as it corresponded to the upper limit of the ongoing bearish channel. It's already running in profits. Bearish persistence below 1.3220 may enable further downside continuation towards 1.2960 (the lower limit of the movement channel). Bullish rejection was anticipated around 1.3000, please note that bullish breakout above 1.3250 enables quick bullish advancement towards 1.3400. The material has been provided by InstaForex Company - www.instaforex.com |
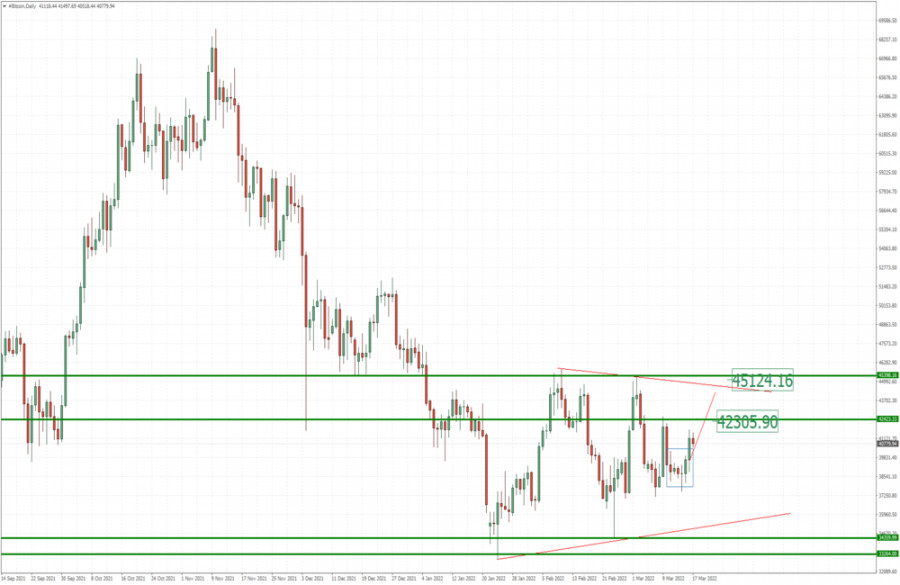
| BTC update for March 17,.2022 - Upisde continuation in play Posted: 17 Mar 2022 09:39 AM PDT Technical analysis:
BTC has been trading sideways today at the price of $40.800 but I see potential for the upside continuation due to breakout of tight consolidation in the background. Trading recommendation: Due to the breakout of the tight consolidation in the background, I see potential for further upside movement. Watch for buying opportunities on the dips with the upside objectives at $42.300 and $45.125. Key support is set at the price of $40.24 The material has been provided by InstaForex Company - www.instaforex.com |
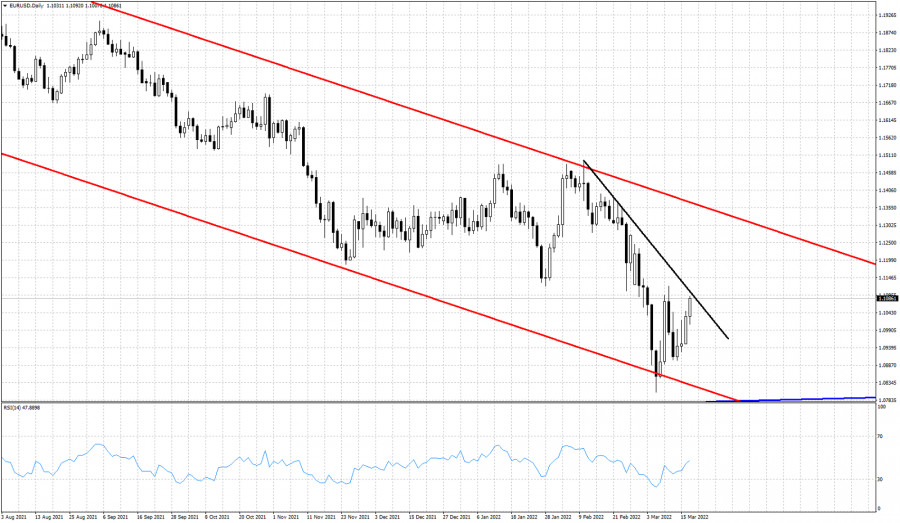
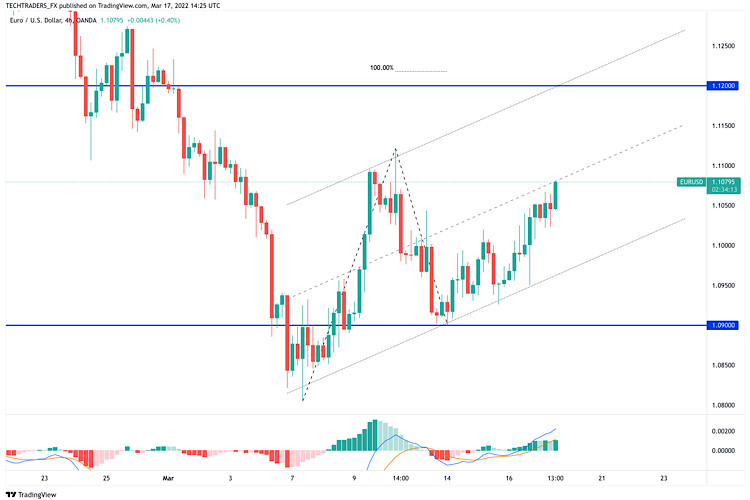
| EURUSD pushes higher to give hopes to bulls. Posted: 17 Mar 2022 08:47 AM PDT EURUSD is pushing towards 1.11 after making a higher low at 1.09 three days ago. The price structure in EURUSD is starting to begin feeling bullish. It is very possible we are at the early stages of a larger reversal but too soon to call it.
Black line -resistance In previous posts we noted that while EURUSD was trading near the lower channel boundary, the chances were in favor of a strong bounce higher. Trend remains bearish as long as price is inside the downward sloping channel, but the upside potential should not be ignored. EURUSD is bouncing higher towards the black resistance trend line at 1.11 and a break above it, will push EURUSD towards the upper channel boundary close to 1.1250-1.13. The Rsi had already given us bullish divergence signals warning bears that the downtrend was weakening. Bulls now need to defend 1.09. As long as price holds 1.09, the upside potential is bigger and we prefer to be neutral if not bullish. The material has been provided by InstaForex Company - www.instaforex.com |
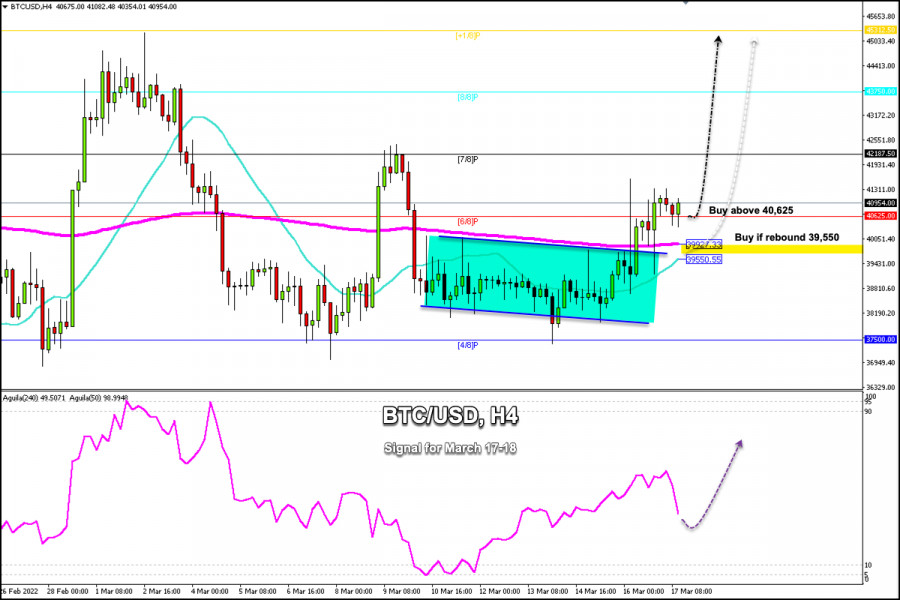
| Trading signals for Bitcoin (BTC/USD) on March 17-18, 2022: buy above $39,550 (21 SMA - 200 EMA) Posted: 17 Mar 2022 08:44 AM PDT
In recent months, Bitcoin (BTC/USD) has been bouncing above the 4/8 Murray line located at 37,500, not being able to surpass it. the price formed a downtrend channel that was broken yesterday with the Fed's decision regarding the key interest rate. Currently, Bitcoin is trading above the 21 SMA and the 200 EMA both located at 39,927. Bitcoin is hovering above this level, now consolidating above 6/8 Murray. We can see that this level where the moving averages are located for now, has become a strong bottom that coincides with the psychological level of $40,000. Since yesterday, the short-term outlook for Bitcoin has changed and has become bullish. We expect Bitcoin to continue its upward movement in the next few hours and the price could reach 7/8 Murray at 42,187. Besides, it could reach the high of March 1 around 45,312. As long as Bitcoin continues to trade and bounce above the 200 EMA, there is a chance for more buying. This will give us the opportunity to increase our long positions above 39,500. Bitcoin is expected to reach the level of 45,300 in a few days. Conversely, in case of a sharp break and close below the 21 SMA at 39,550 on the 4-hour chart, BTC is likely to drop back to the support 4/8 Murray at 37,500. Below 4/8 of Murray (37,500), if BTC trades moving away from this level, the price will accelerate the drop to 1/8 Murray at 32,812. The material has been provided by InstaForex Company - www.instaforex.com |
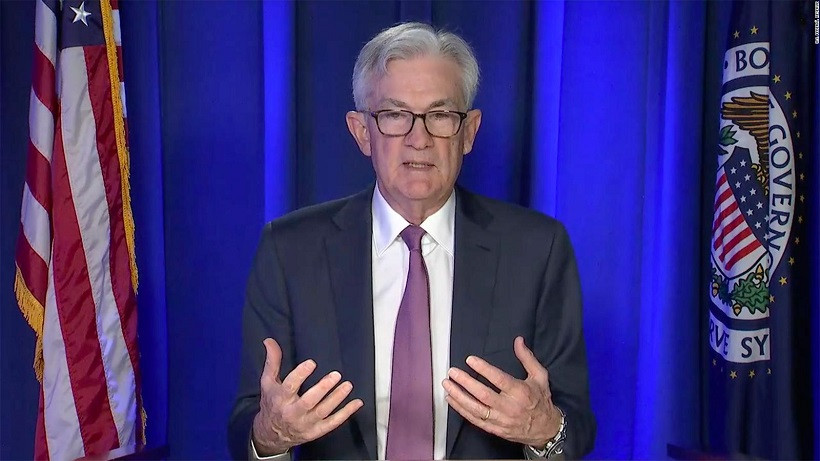
| EUR/USD. Fed March meeting result: hawkish but not aggressive Posted: 17 Mar 2022 08:36 AM PDT The contradictory results of the Fed's March meeting failed to support the U.S. currency. On the one hand, the Fed raised the interest rate and announced further steps in this direction, on the other hand, Chairman Jerome Powell voiced rather cautious comments, thereby putting pressure on the greenback. After some hesitation, the pair continued the upward march, gaining a foothold within the 10th figure.
Buyers of EUR/USD have been besieging the 1.1000 mark for several days, but could not hold their positions above this target. The vague results of the Fed's March meeting helped the pair's bulls overcome the key resistance level. Now the outlines of the 11th figure have appeared on the horizon, but it is necessary to talk about the continuation of the upward movement with great caution, since the focus of attention will now switch back to geopolitics. And geopolitical factors are known for their changeability: the news background here is changing with kaleidoscopic speed – pessimism is replaced by cautious optimism and vice versa. In other words, the buyers of EUR/USD won a situational victory ("thanks" to the Federal Reserve), but did not win the battle: it is impossible to speak with certainty about the trend reversal so far. In such conditions, longs still look risky. But let's return to the results of the next Fed meeting. Immediately after the publication of the accompanying statement, the dollar strengthened its positions throughout the market, reacting to the hawkish attitude of the regulator. Firstly, the Central Bank raised the interest rate by 25 basis points (there was no miracle - the Committee did not decide on a 50-point increase) and announced further steps to tighten monetary policy. In particular, the regulator indicated that the majority of Committee members expect 7 rate increases this year (by 25 points) - that is, at every meeting, including the December one. The voiced scenario, despite all its hawkishness, provided only formal support for the U.S. currency. It was too predictable a decision, which was discussed by experts and, accordingly, was included in the prices since the beginning of this year. The so-called dot forecast ("dot plot") also did not surprise: at the end of 2022, the federal funds rate should be 1.9%, and in 2023 it will reach 2.8% and remain at this level till 2024. In other words, there was no "hawkish surprise" (in the form of a 50-point increase and a more aggressive attitude of the Fed), so the greenback paired with the euro strengthened its position by only a few dozen points. Dollar bulls probably hoped for Powell, who could strengthen the hawkish mood, but the head of the Fed in his characteristic manner voiced rather cautious theses, thereby exerting additional pressure on the U.S. currency. Powell said that the central bank expects a significant decline in inflation in the second half of this year, despite the volatility in the oil market and increased geopolitical uncertainty. According to him, the impact of the geopolitical situation on the American economy is "highly uncertain." In light of these circumstances, the head of the Federal Reserve did not announce a more aggressive pace of tightening monetary policy (thereby not confirming rumors that in May the rate could be raised by 50 points at once). He only indicated that the decision on raising the rate and the amount of this increase "will be taken at each separate meeting, depending on the incoming statistical data." Also, Powell sounded quite streamlined signals about when the Fed will start reducing assets on its balance sheet, which has reached almost $9 trillion. He admitted that an official statement on this issue "may be made in the second half of spring, most likely in May." According to him, the regulator will reduce the volume of assets on the balance sheet "in approximately the same ways as in the previous ones, but probably at a more active pace." This suggests that the Federal Reserve will refuse direct sales of bonds, but will wait for their redemption. In general, Powell focused on high inflation, while highlighting the topic of geopolitical risks. But at the same time, he did not force things, acting within the framework of a scenario predicted and expected by traders. Such results of the March meeting did not "drown" the dollar, but did not serve as a springboard for another dollar rally. After some hesitation, EUR/USD buyers were able to seize the initiative, gaining a foothold within the 10th figure.
However, for the development of the upward movement, the bulls of the pair need to move as far as possible from the level of 1.1000, while at the moment the upward move has clearly stalled. Buyers try to move forward, but each point is difficult for them. It is important to understand that the current price growth is due solely to the weakening of the U.S. currency, while the euro does not have its own arguments for its strengthening. The dollar, in turn, retreated from previously won positions due to a decrease in the level of anti-risk sentiment. The ongoing negotiations between Russia and Ukraine allow the bulls of the EUR/USD pair to counterattack, keeping the price around the middle of the 10th figure. It should be noted here that further growth prospects for the pair are rather vague. To reverse the trend, the EUR/USD bulls need more weighty arguments. The very fact of negotiations reduced the degree of tension in the financial markets only temporarily: if in the foreseeable future (until the beginning of next week) there are no real steps to reach a compromise, the greenback will begin to gain momentum again. Not to mention the scenario of a negotiation failure - in this case, the EUR/USD bears will get back on the horse, due to a significant strengthening of the safe dollar. From the technical point of view, the ceiling of the corrective rollback is 1.1090, which is the middle line of the Bollinger Bands indicator on the D1 timeframe. If the upward momentum begins to fade around this price level, sales will again be in priority. In the very near future, the market will completely switch to geopolitics, having digested the results of the March meeting of the Fed, which, as we see, turned out to be not so sad for the greenback. The material has been provided by InstaForex Company - www.instaforex.com |
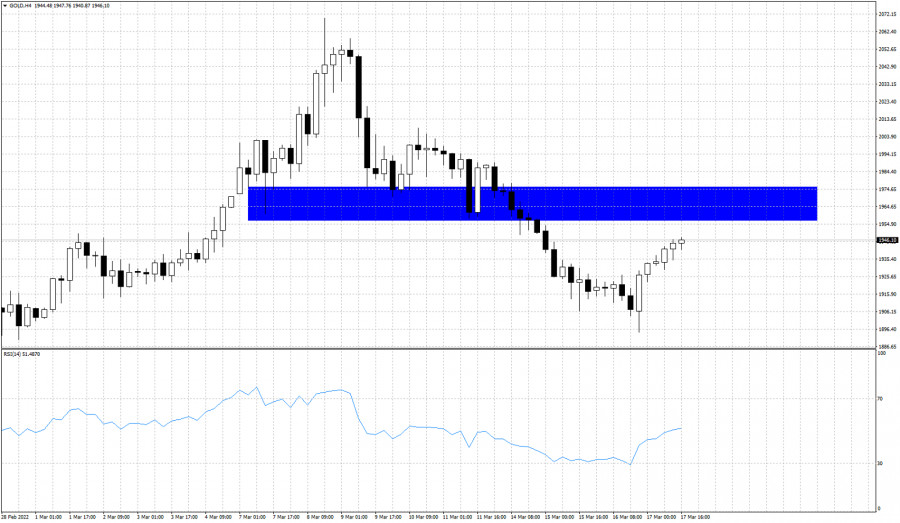
| Posted: 17 Mar 2022 08:32 AM PDT Gold price has broken out of the short-term bearish channel we talked about yesterday and provided a new short-term sign of strength. Price is bouncing higher after the strong sell off from $2,070 to $1,894. Gold price has reached all our pull back targets. What now?
Gold price is bouncing and traders are confused whether the decline is over and a new upward move to new all time highs is starting. Gold price has to overcome the blue rectangle area which is important resistance. If bulls manage to start making higher highs and higher lows while breaking above the blue resistance area, then we should expect a new all time high to come over the next few weeks. A rejection at the horizontal resistance area will be a bearish sign and could lead Gold price to new lower lows below $1,894 towards $1,870 if not $1,850. The material has been provided by InstaForex Company - www.instaforex.com |
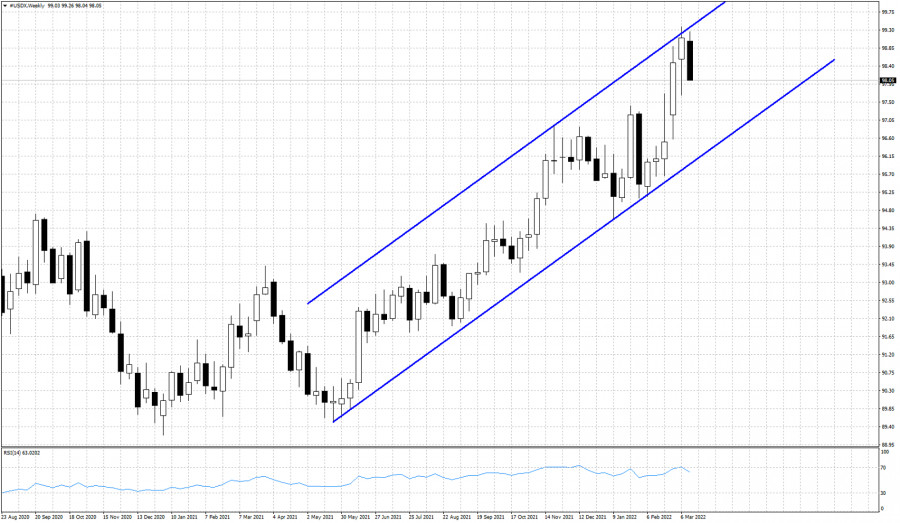
| Posted: 17 Mar 2022 08:28 AM PDT The Dollar index as expected is making new weekly lows. As we mentioned in previous posts, with the index close to the upper channel boundary and with bearish RSI divergence signals, around 99 we preferred to be neutral if not bearish.
The upside potential in the Dollar index is very limited at current levels. The risk is to the downside and we prefer to be neutral or bearish. The Dollar index is expected to make a move towards the lower channel boundary. At this lower boundary support is found at 96. Short-term trend is changing to bearish. Weekly trend remains bullish but there is danger of a 2 point pull back. The material has been provided by InstaForex Company - www.instaforex.com |
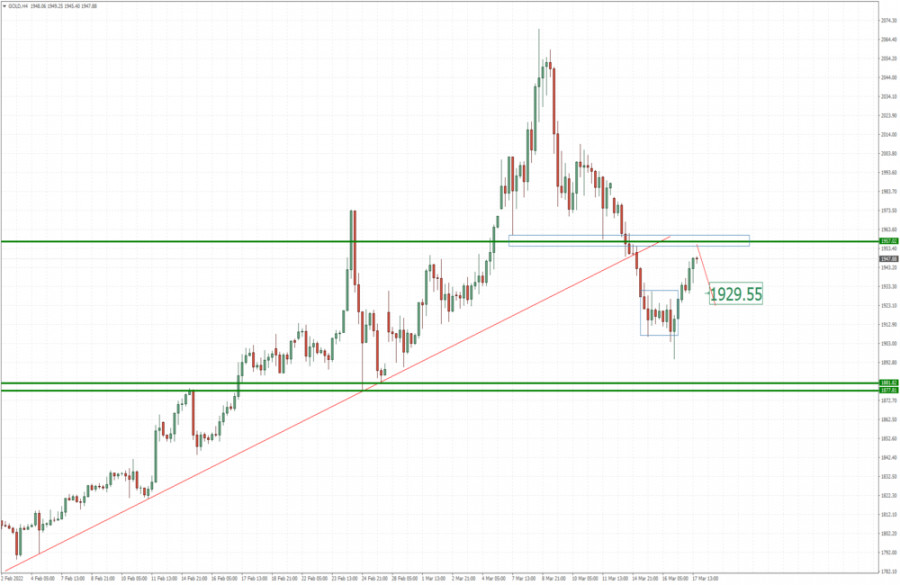
| Analysis of Gold for March 17,.2022 - Key pivot resistance at the price of $1.960 Posted: 17 Mar 2022 08:24 AM PDT Technical analysis:
Gold is trading near important pivot resistance at the price of $1.960. Watch for the price action around this key pivot to confirm further direction. Trading recommendation: Buyers are in control for today but there is important pivot at the price of $1.957. Watch for potential reversal pattern around key pivot at $1.957. Selling opportunities are preferable with the downside objective at $1.930. Support level is set at the price of $1.926 The material has been provided by InstaForex Company - www.instaforex.com |
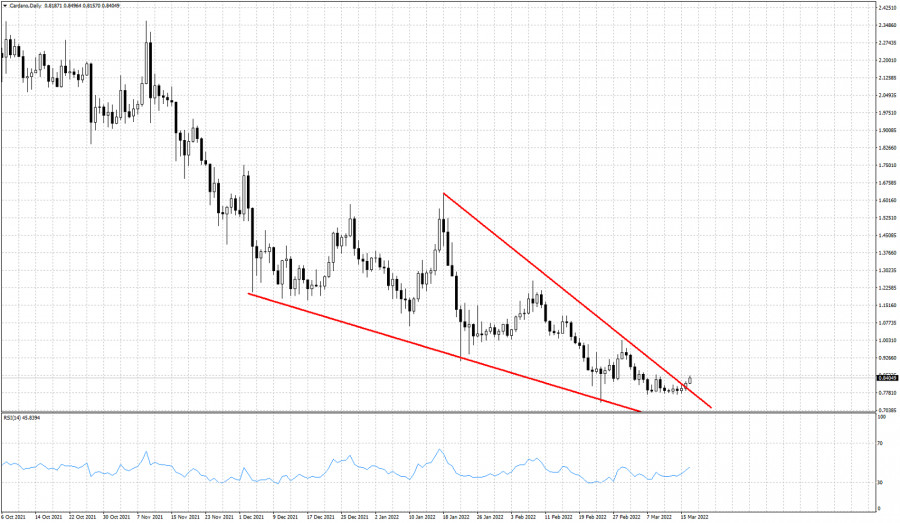
| Cardano is providing a bullish signal. Posted: 17 Mar 2022 08:20 AM PDT In previous post we mentioned the downward sloping wedge pattern Cardano price was forming. Today price is breaking above and out of the wedge pattern providing us with a bullish signal. This could be the start of a bigger bounce higher.
It is important for bulls to start making higher highs and higher lows. Technically trend has not changed to bullish yet as the latest high at $1 is still not broken. We have a first bullish signal but for trend to change to bullish, we at least need price to break above $1. Upside target is at $1.60 if this breakout is confirmed above $1. The material has been provided by InstaForex Company - www.instaforex.com |
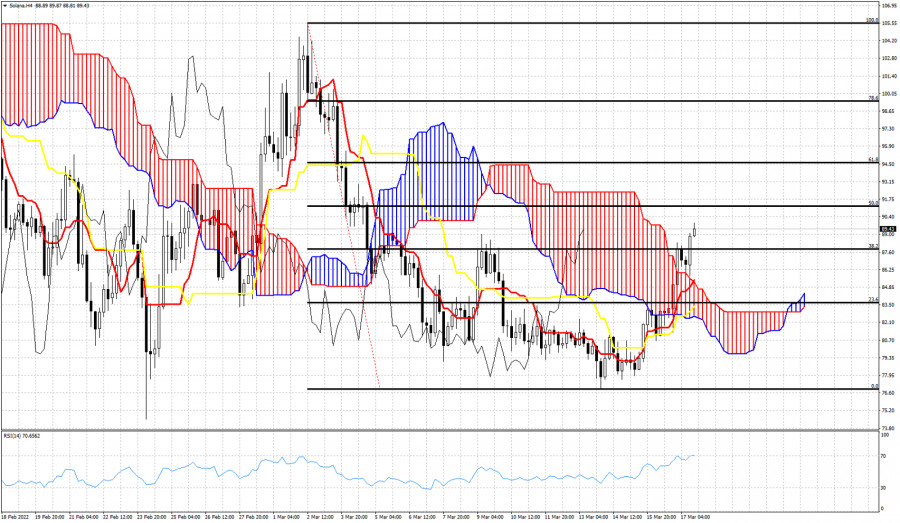
| Solana price breaks above cloud resistance. Posted: 17 Mar 2022 08:17 AM PDT In the 4 hour chart price of Solana has broken above the Kumo (cloud) resistance. This is a sign of strength. If this will change into a bigger reversal it is too soon to tell. Nevertheless this is a bullish sign after a long time.
Price is moving above the cloud and is making higher highs and higher lows. Support by the cloud is at $84.60-$84.90 area. Price is above both the tenkan-sen and kijun-sen indicators. The tenkan-sen (red line indicator) has crossed above the kijun-sen (yellow line indicator). These are bullish signals. However this is only in the 4 hour time frame so traders need to be cautious. Bulls need to defend the cloud support and not let price break below it again. Next upside target is at the 50% retracement at $91.20 and next and most important Fibonacci resistance is found at $94.65. Breaking above $94.65 would be an important bullish signal. The material has been provided by InstaForex Company - www.instaforex.com |
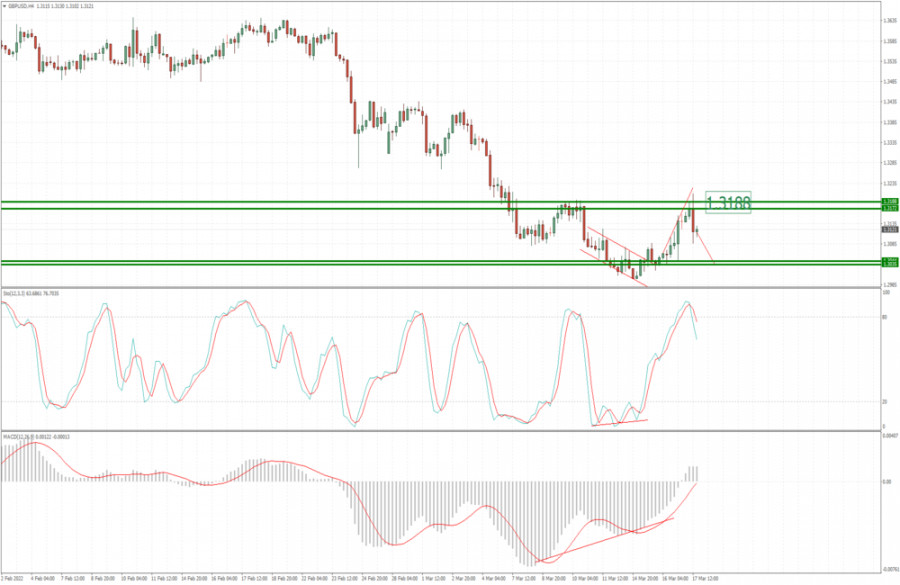
| Posted: 17 Mar 2022 08:14 AM PDT Technical analysis:
GBP/USD has been trading upside in the background and the market reached our main objective at 1.3190. Anyway, I see strong rejection of the key pivot and potential for downside rotation. Trading recommendation: Due to strong rejection in the background from key resistance at 1.3190, watch for selling opportunities on the intraday rallies. Downside objective is set at the price of 1.3040 Stochastic is showing fresh bear cross and extreme bull condition, which is another sign and confirmation for the downside rotation. The material has been provided by InstaForex Company - www.instaforex.com |
| Trading plan for Gold for March 17, 2022 Posted: 17 Mar 2022 07:45 AM PDT
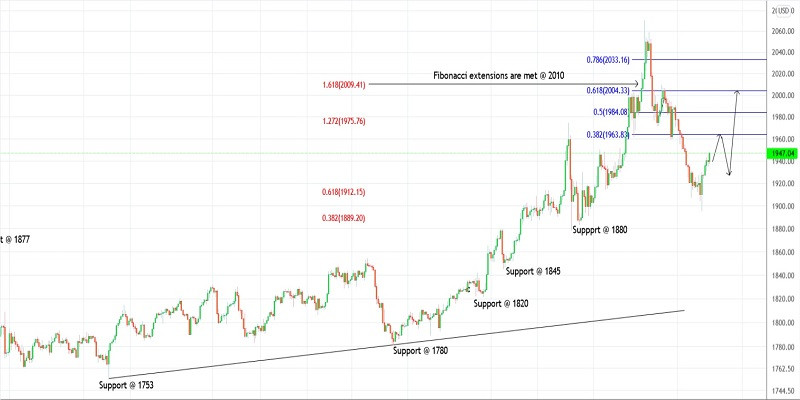
Technical outlook:Gold prices dropped through fresh lows on Wednesday post FOMC around $1,895 mark before finding support again. The yellow metal has covered quite a lost ground and is seen to be trading close to $1,950 at the time of writing. Probabilities remain for yet another drop through $1,880 mark before producing a meaningful corrective rally. Alternatively, Gold prices might have completed the initial drop at $1,895 and is underway towards $1,965 and $2,000-10 levels. Please note if the corrective wave has begun, it would ideally unfold into three waves. The first wave might terminate around $1,965-70, followed by a correction and then the next leg higher up to $2,000-10 mark. Also note that $1,965 and $2,000-10 are close to fibonacci 0.382 and 0.618 retracement of the above bearish boundary between $2,070 and $1,895 respectively. Hence probabilities remain high for a bearish reversal if prices manage to push through that zone. Bears will remain inclined to be back in control from $2,000-10 levels going forward. Trading plan:Potential counter trend rally towards $1,965 and $2,000-10 levels against $1,890 Good luck! The material has been provided by InstaForex Company - www.instaforex.com |
| EUR/USD Hot Forecast on 17 March Posted: 17 Mar 2022 07:43 AM PDT
EUR/USD continues to push higher on Thursday and trades at its highest level in a week above 1.1070. The broad-based selling pressure surrounding the dollar and the positive shift witnessed in risk sentiment helps the pair preserve its bullish momentum. The EUR/USD pair is nearing a critical Fibonacci resistance level at 1.1070, the 38.2% retracement of its latest daily slide. The daily chart shows that technical indicators have lost their bullish momentum within negative levels, while the 20 SMA heads firmly lower, now around 1.1095. The bullish potential remains limited, although a break above the Fibonacci resistance may spook sellers and favor a continuation. The near term picture is mildly bullish, as the 4-hour chart shows that technical indicators have lost their upward strength but that they remain well above their midlines. Additionally, the pair is developing above a bullish 20 SMA, while a bearish 100 SMA is acting as dynamic resistance around the aforementioned daily high. Support levels: 1.1000 1.0965 1.0900 Resistance levels: 1.1070 1.1115 1.1160 The material has been provided by InstaForex Company - www.instaforex.com |
| GBP/USD Hot Forecast on 17 March Posted: 17 Mar 2022 07:42 AM PDT
The British pound came under heavy selling pressure after the BOE adopted a cautious tone with regards to futures rate hikes. Additionally, one MPC member voted against Thursday's 25 bps rate increase. GBP/USD was last seen testing 1.3100. The technical picture suggests that the pair remains bullish in the near term with the Relative Strength Index (RSI) indicator on the four-hour chart staying near 60. Additionally, GBP/USD trades above the 20-period and the 50-period SMAs on the same chart. On the upside, 1.3200 (psychological level, Fibonacci 50% retracement of the latest downtrend) aligns as the first technical resistance. In case a four-hour candle closes above that level on a hawkish BOE hike, the next bullish target is located at 1.3250 (100-period SMA, Fibonacci 61.8% retracement) before 1.3300 (former support). Supports could be seen at 1.3150 (Fibonacci 38.2% retracement), 1.3100 (psychological level, Fibonacci 23.6% retracement, 50-period SMA) and 1.3075 (20-period SMA). The material has been provided by InstaForex Company - www.instaforex.com |
| Bitcoin: Friday options expiration suggests significant bull lead Posted: 17 Mar 2022 07:38 AM PDT The increase in the Bitcoin interest rate did not scare. Market participants, most likely, have already taken into account this price increase. The next event that investors' focus is shifting to is Friday's option expiration. Today, the cryptocurrency managed to finally rise above $40,000 per coin. At this time, according to Glassnode, the number of liquidated positions begins to decline. The analytics firm notes that liquidation sizes are shrinking as bitcoin's volatility range narrows to $38,000 to $42,000. Long liquidations continue to dominate. The next big move will be confirmed once we break the $36,000-$45,000 range. Will $40,000 per bitcoin hold?Bitcoin bulls can hold the main cryptocurrency ahead of Friday's option expiration amid the predominance of buy option positions. It is known that there are 1,700 call options (buy) and 1,300 put options (sell) in the price range from $38,000 to $40,000. This gap suggests a balance between bulls and bears. Similarly, in the $40,000 to $41,000 price range, there are 3,200 calls versus 600 puts. Clearly, the net result in favor of the bulls is $105 million. In the $41,000 to $42,000 price range, there are 4,200 calls versus 300 puts. Thus, Bitcoin bulls are trying to increase their profits to $160 million. Bitcoin bears will have to drive the price of BTC below $40,000 to avoid a $105 million loss. Bitcoin is more attractive than gold in the short termMeanwhile, locally, bitcoin seems to be looking more attractive than the precious metal, which has traditionally been a safe-haven asset. Billionaire investor and Doubleline Capital CEO, Jeffrey Gundlach, said he would buy Bitcoin instead of gold in the near future as the main cryptocurrency trades near the bottom of its range. And that means it has growth potential. Today's strength confirmed that investors do not seem to be concerned about the Fed's rate hike announcement. Now, amid the Fed's tightening monetary policy, bitcoin is more attractive than stocks, given the fact that the cryptocurrency was partially correlated with them. The Doubleline Capital CEO emphasizes, ''Stocks are oversold and will go higher in the immediate term but will roll over once a couple more rate hikes are in place.'' Given the growing correlation, this could be a positive for the cryptocurrency. Bitcoin has been compared to gold more than once. Its proponents argue that it is a hedge against inflation and an alternative investment strategy in times of crisis. The same well-known billionaire investor and crypto mogul Mike Novogratz likens bitcoin to diamonds and gold. As an argument, he calls the fact that Bitcoin is not controlled by the government. He also predicted that the main cryptocurrency could reach $500,000 in five years. Steve Wozniak, co-founder of Apple, also recently called the largest cryptocurrency "pure gold."
|
| Trading signals for GBP/USD on March 17-18, 2022: buy above 1.3068 (21 SMA - downtrend channel) Posted: 17 Mar 2022 07:37 AM PDT
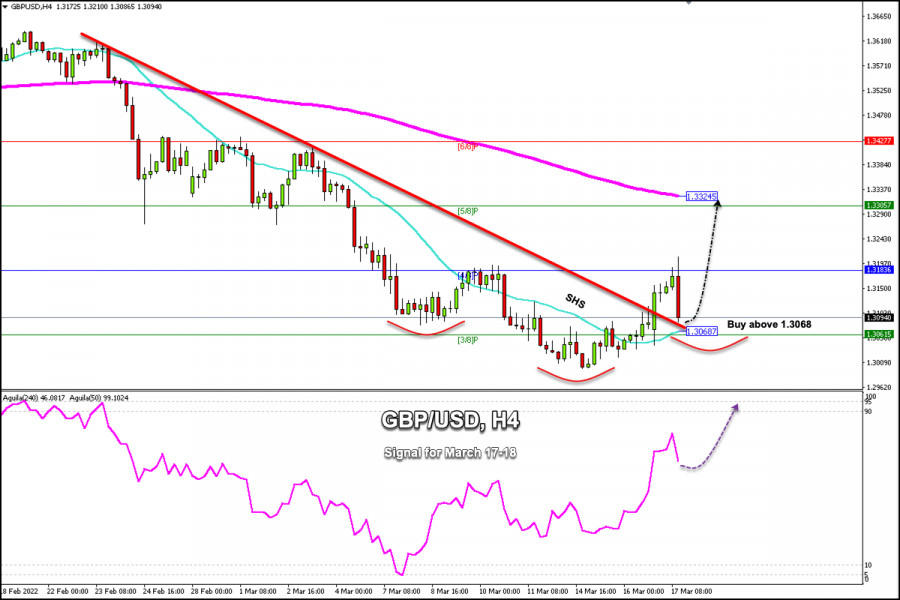
GBP/USD pair has slumped from today's high at 1.3210 and has fallen to a daily low of 1.3086 after the Bank of England announced its monetary policy decision. This sudden drop in the British pound was due to disappointment on the part of investors, as they expected an interest rate hike of 50 basis points. Another factor is the uncertainty generated about economic growth in the coming months. Tthese were details that weighed on the pound. On Wednesday, the US Federal Reserve raised its interest rate by 25 basis points. According to the policy statement, there are six more rate increases on the Fed's agenda for 2022. So, no doubt that the US dollar will continue its upward path in the coming months. However, the US dollar index (DXY) is very overbought, which could favor the recovery of the British pound in the next few days and GBP/USD could reach the 200 EMA at 1.3324. On the other hand, there are expectations of a recovery of the British pound in the short term, with the hope of an agreement between Ukraine and Russia, or at least a truce. Investors remain bullish and this could weigh on the US dollar safe-haven. According to the 4-hour chart, we can observe the formation of a head & shoulder pattern. As long as the pound trades above the 21 SMA at 1.3068, there will be a clear opportunity for it to hit its target at 1.3305. GBP/USD managed to break out of the downtrend channel that had formed since February 22nd. Now it is above this channel, making a technical correction. If GBP/USD manages to rebound and stay above this channel in the next few hours, it could resume the bullish momentum and the price could reach 4/8 Murray again at 1.3183 and even the 200 EMA at 1.3324. The eagle indicator is giving a positive signal. However, this sudden fall in the pound can be well seen as part of a correction to buy back above 1.3068. The material has been provided by InstaForex Company - www.instaforex.com |
| Bitcoin steadily increasing and even crypto skeptics believe in its potential Posted: 17 Mar 2022 06:59 AM PDT At the end of the trading session on Wednesday, BItcoin showed a sharp rise of 4%, as a result of which the asset closed near $40,100. The asset demonstrated spectacular growth and other risky assets followed suit. At the time of writing, Bitcoin is trading at $41,000. According to CoinGecko, the world's largest aggregator of data on digital assets, the total capitalization of the crypto market increased by 3.5% to $1.90 trillion over the past 24 hours. Meanwhile, the BTC Fear and Greed Index increased by 3 points to 24 points over the past 24 hours.
Since early March, the flagship cryptocurrency has shown a decline of 6%. For almost the whole month, Bitcoin has been trading sideways within a range of $37,000-$42,000, hovering without any attempts to break through its boundaries. Bitcoin lost more than 16% in January, and during February its price rose by 12%. In November 2021, BTC reached its all-time high, soaring above $69,000. Since then, the cryptocurrency has gone on a steady decline and has fallen by more than 40%. By the end of 2021, Bitcoin increased by 1.6 times to $46,200 from $28,900. On Wednesday, BTC grew for the second day in a row amid the strengthening of stock indices and the weakening of the US dollar. Yesterday, the US Federal Reserve raised its benchmark rate by 0.25%, following this news, the crypto market and other risky assets began to rise sharply. Experts make the most unexpected predictions about the future of BTC because of its unpredictable trading. The day before, well-known crypto skeptic Peter Schiff stated that the further growth of BTC depends on fluctuations in the value of gold and major stock indices (in particular, the NASDAQ stock index). According to the expert, BTC may increase if the NASDAQ index climbs, while Bitcoin's main competitor, gold, falls. The US Federal Reserve should drop inflation by 2% with a minimal rate hike and reduce government spending. By the way, back in 2021 Peter Schiff criticized every impressive bitcoin crash and predicted the imminent collapse of the cryptocurrency market. However, he talks about the growth prospects of the first digital coin under certain conditions. According to analyst firm Glassnode, investors withdrew BTC estimated at $1.2 billion from cryptocurrency exchange Coinbase during the previous week, the highest amount since the summer of 2017. Experts believe that this signals about traders willing to hold the leading digital asset in the long term. The material has been provided by InstaForex Company - www.instaforex.com |
| Major Asian indices show significant gains Posted: 17 Mar 2022 06:57 AM PDT
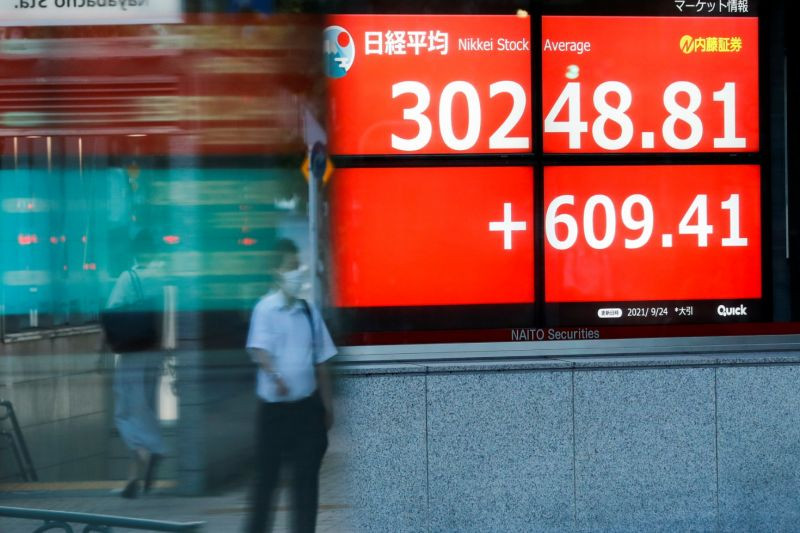
The main Asian indicators show significant gains in today's trading. The Hang Seng Index in Hong Kong was the best performer to date, closing up 9% yesterday and another 5.77% today. Other indicators also had a fairly good performance. The Shanghai Composite rose by 2.59% and the Shenzhen Composite gained 3.56%. Tokyo's Nikkei 225 added 3.46%, Korea's KOSPI climbed by 1.42% and Australia's S&P/ASX 200 jumped by 1.12%. Such a significant increase in stock indicators for the second consecutive session is due to the results of a meeting of the Financial Stability and Development Committee under the leadership of the Chinese deputy prime minister. According to news agencies, market-friendly policies are planned, as well as support from the PRC authorities for the smooth operation of capital, which will be provided to real estate and internet-based companies. It is also reported that talks are continuing and some progress has been made between the PRC and the US regarding Chinese companies trading on US exchanges. As a reminder, the US government has previously promised to delist several Chinese companies from US stock exchanges due to their non-compliance with US law. The possibility that some Chinese companies could leave US exchanges was the main reason for the decline in the value of Chinese securities. Another positive signal for investors was the results of yesterday's meeting of the US Federal Reserve. It was announced that it had decided to raise interest rates by 25 points to combat the rising rate of inflation. The Fed governor said that if necessary, the regulator is prepared to raise the rate at subsequent meetings as well. The rate hike was the first since 2018, but the market was ready for such a decision as experts had already predicted it some time ago. Among the components of the Hang Seng Index, Country Garden Holdings Co. gained the most, adding 21.9%, as did JD.com Inc., Meituan and Alibaba Group Holding, Ltd. which added 13.9%, 13.8% and 12% respectively. Among the components of the Nikkei 225 index, Japan Steel Works, Ltd. (+7.4%), SoftBank Group (+7%) and Asia Fast Retailing (+6.6%) appreciated the most. South Korea's Samsung Electronics Co. and Hyundai Motor also gained 1.4% and 1.5%, respectively. Australia's unemployment rate fell to 4% last month, down from 4.2% in January. Unemployment in the country reached its lowest level in 15 years. Meanwhile, experts predicted the rate would drop to 4.1%. Share prices of the country's biggest companies also showed gains. BHP was up by 1.1% and Rio Tinto gained 1.6%. The material has been provided by InstaForex Company - www.instaforex.com |
| Posted: 17 Mar 2022 06:26 AM PDT
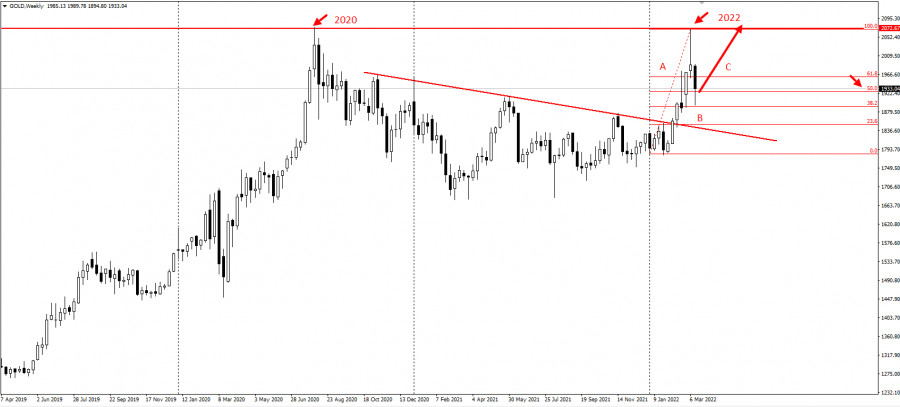
Gold was actively approaching the 2020 high, but could not overcome $2,075.
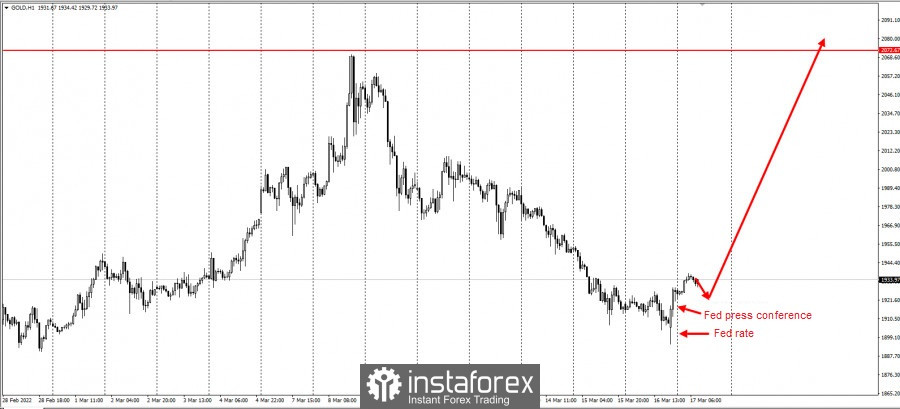
Instead, there was a 50% rollback, which lowered the quote by 17,000 pips, bringing it under $1900. But yesterday, demand for the yellow metal increased, thanks to the decision of the Fed to raise rates by 0.25 bp.
This situation calls for long positions, at least until the quote breaks through the yearly high at $2,075. Such a move offers a profit of about 15,000 pips. This idea is based on the Price Action and Stop Hunting strategies. Good luck and have a nice day! The material has been provided by InstaForex Company - www.instaforex.com |
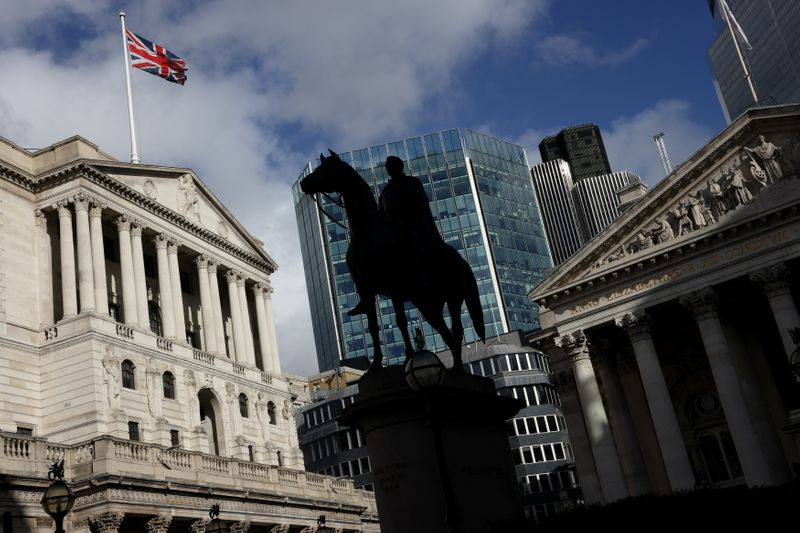
| Bank of England intends to maintain an aggressive approach to monetary policy Posted: 17 Mar 2022 06:15 AM PDT The Bank of England is one of the first to start raising interest rates after the coronavirus pandemic. It also intends to maintain an aggressive approach to monetary policy. As such, it is likely that the central bank will announce a quarter-point rate hike after its meeting today, pushing it to 0.75%. That will be a response to the persistently growing inflation in the UK. Energy prices shot up recently because of the conflict in Ukraine. It contributed to a wider increase in prices in the global economy, making economists confident that Bank of England members will push for a 50 bp increase at once, which, if happens, will prompt a rapid increase in GBP/USD.
In short, the actions of the Bank of England will be forced as no one wants to raise rates in the face of slowing economic growth. But if the central bank does not do it, the UK may face another recession because inflation already reached a three-decade high and is projected to increase further this year due to sharp jump in food and energy prices. Economists expect it to reach 10% this October, much higher than the Bank of England's 2% target. Too high inflation will lead to a crisis in living standards, which will hit the country's population very seriously. The most serious problems will be in utility and fuel. Markets expect rates to increase to 2% by the end of this year, including an unprecedented 50 basis point hike in June. They will also assess today's minutes for any signs of a change to a more aggressive direction in BoE policy. One of these signs may be comments about the consequences of the geopolitical situation for the global economy. Markets will also keep an eye on how the central bank will deal with its shrinking balance sheet. An aggressive policy change will have a positive effect on GBP/USD. Buyers already showed themselves after the pair's recent drop and are now focused at 1.3190. Its breakdown could lead to a jump to 1.3240 and 1.3275, while a dip below 1.3120 will result in a fall to 1.3080, 1.3030 and 1.2970. The material has been provided by InstaForex Company - www.instaforex.com |
| The results of the Bank of England's monetary policy meeting Posted: 17 Mar 2022 06:15 AM PDT The British pound collapsed against the US dollar after the publication of the Bank of England's decision on interest rates. Although the regulator has decided to raise rates, the situation in the economy and inflation risks outweigh all the advantages of policy changes. It is obvious that the Bank of England did not make these changes out of a good life, but to combat inflation, which it predicts to be around 8.0% or even yours by the end of this year - an economic shock in such conditions for a country that is used to seeing inflation around 2.0% per annum, obviously cannot be avoided.
As noted above, the Bank of England today raised interest rates for the third time in a row, but adopted a more dovish tone, as it is expected that the Russian-Ukrainian conflict will continue to support inflation at a high level. The Bank's Monetary Policy Committee voted 8-1 in favor of further raising the main interest rate by 0.25 percentage points, bringing it to 0.75%. Inflation in the UK has already reached a 30-year high even before the start of the conflict between Russia and Ukraine, which led to a sharp increase in energy prices. Current energy prices are expected to put even more upward pressure on the central bank's inflation forecasts in the future. Let me remind you that during the February meeting, the monetary policy committee introduced a consistent increase in interest rates since 2004 and raised its inflation forecast to a peak of 7.25%, which is expected in April not only due to strong energy growth but also due to a record recovery in the labor market. The regulator also stated that any further tightening of monetary policy will depend on the medium-term prospects for inflation, which have worsened due to a sharp increase in geopolitical tensions, which led to a jump in energy prices. "Global inflationary pressures will increase significantly in the coming months, while growth in countries that are net importers of energy, including the UK, is likely to slow down," the Bank said in a report published on Thursday. Currently, the bank expects further inflation growth in the coming months to about 8% in the second quarter and possibly even higher at the end of the year. Given the tension in the labor market and the constant pressure of domestic prices, the committee also noted that some further moderate tightening of monetary policy may be appropriate in the coming months, although the risks are two-sided depending on the development of the situation in the economy. Thus, the Bank of England is trying to sit on two chairs: not to harm economic growth, which is slowing down very quickly, and also to do everything possible to combat inflationary pressure, which can cause a more crushing blow to the economy if it gets out of control. Against this background, the British pound collapsed against the US dollar, dropping from an intraday high of 1.3202 to 1.3080 - completely losing the advantage gained after yesterday's growth against the backdrop of the Federal Reserve meeting. Yesterday, the Federal Reserve also raised interest rates by a quarter of a percentage point and announced plans to hold six more such increases this year. Thus, the Fed launched a campaign to combat the highest inflation in four decades. It has already been saying a lot that such actions create quite serious risks for future economic growth, but for the central bank, inflation is the number 1 problem right now. As for the technical picture of the EURUSD pair Euro bulls, though, aimed at 1.1060, but every time they approach this level, activity decreases. It seems that the geopolitical tensions around Russia and Ukraine have eased a little, but today's statements by Kremlin representatives prevented this. Dmitry Peskov denied reports that the warring parties are approaching a settlement of the conflict, accusing Kyiv of slowing down negotiations. Euro buyers need to consolidate above 1.1060, which will allow the correction to continue to the highs: 1.1120 and 1.1165. The decline of the trading instrument will be met with active purchases in the area of 1.1020. However, the key support level remains the 1.0960 area. As for the technical picture of the GBPUSD pair The British pound has already fallen into the support area of 1.3080 and is not going to adjust up yet. The dovish rhetoric of the Bank of England puts the British pound in a difficult position against the US dollar again. Now the bulls need to think about how to bring the 1.3140 level back under control. Only this will allow us to count on a more powerful correction of the pair in the area of 1.2190 and 1.3240. If we go below 1.3080, then the pressure on the trading instrument will increase: in this case, we can expect a fall to 1.3030 and the output of the trading instrument to a new annual minimum of 1.2960. The material has been provided by InstaForex Company - www.instaforex.com |
| You are subscribed to email updates from Forex analysis review. To stop receiving these emails, you may unsubscribe now. | Email delivery powered by Google |
| Google, 1600 Amphitheatre Parkway, Mountain View, CA 94043, United States | |





Comments