Forex analysis review
Forex analysis review |
- Trading plan for GBP/USD on November 3, 2021
- Trading plan for EUR/USD on November 3, 2021
- Forecast and trading signals for GBP/USD for November 3. Detailed analysis of the movement of the pair and trade deals. The
- Forecast and trading signals for EUR/USD on November 3. Detailed analysis of the pair's movement and trade deals. Total flat
- Polkadot: Not having time to celebrate yesterday's record price mark, DOT swung to new all-time highs
- USD/JPY. "Follow me": the yen will follow the greenback
- Gold vulnerable to drop again
- EUR/USD ends its temporary rebound
- USD/JPY downside could be invalidated
- Trading plan for EUR/USD on November 3. Simple tips for beginners. Swing moves brought the pair back to a sideways channel
- Major crypto market news for November 2, 2021
- November 2, 2021 : EUR/USD daily technical review and trading opportunities.
- November 2, 2021 : EUR/USD Intraday technical analysis and trading plan.
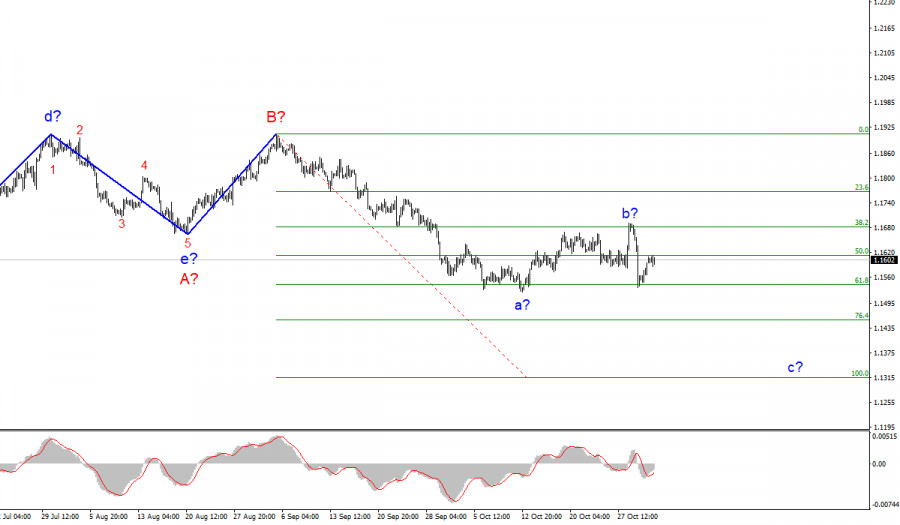
- Wave analysis of GBP/USD for November 2: Business activity indices, ADP report, Fed meeting
- November 2, 2021 : GBP/USD Intraday technical analysis and significant key-levels.
- Short-term analysis on Bitcoin.
- GBPUSD approaching second target.
- USDCHF reversal from our target zone.
- Short-term technical analysis on Gold for November 2, 2021.
- Ichimoku cloud indicator analysis on EURUSD for November 2, 2021.
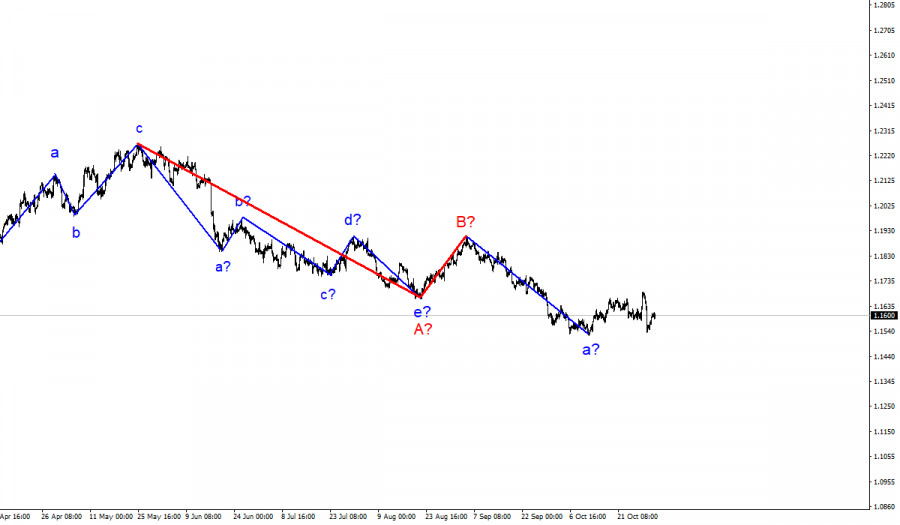
- Wave analysis of EUR/USD for November 2: US dollar declines ahead of Fed meeting
- Bitcoin: Encouraging Statistics and Technical Uncertainty
- Trading signal for Bitcoin Cash (BCH) on November 02 - 03, 2021: sell below $593,75 (EMA 200)
- Oil refuses to follow the White House
- Trading signal for DOW JONES 30 (#INDU) on November 02 - 03, 2021: sell below 35,937 (8/8)
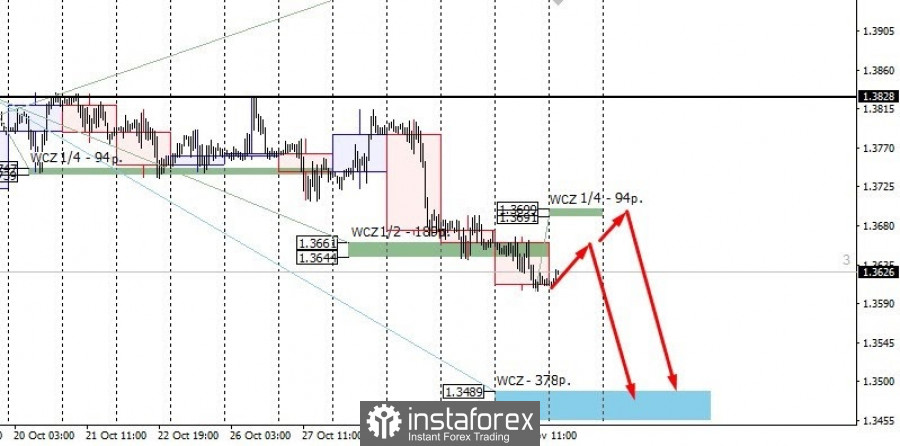
| Trading plan for GBP/USD on November 3, 2021 Posted: 02 Nov 2021 08:15 PM PDT The GBP/USD pair closed yesterday below the defining support zone of the Weekly Control Zone 1/2 1.3661-1.3644. This allows us to consider today's growth as an opportunity to search for selling prices. The opening level of yesterday's trading is decisive, so it can be used as the most favorable selling price for this instrument in the case of today's upward movement. The maximum correction zone is the WCZ 1/4 1.3699-1.3691. The target of the bearish impulse was the Weekly Control Zone 1.3489-1.3455. There is a 75% probability of testing these levels.
It is not profitable to consider buying options, since the downward movement is a medium-term impulse, which increases the probability of repeated updates of the weekly minimum to 80%. This week's main task is to find favorable prices for sale. The material has been provided by InstaForex Company - www.instaforex.com |
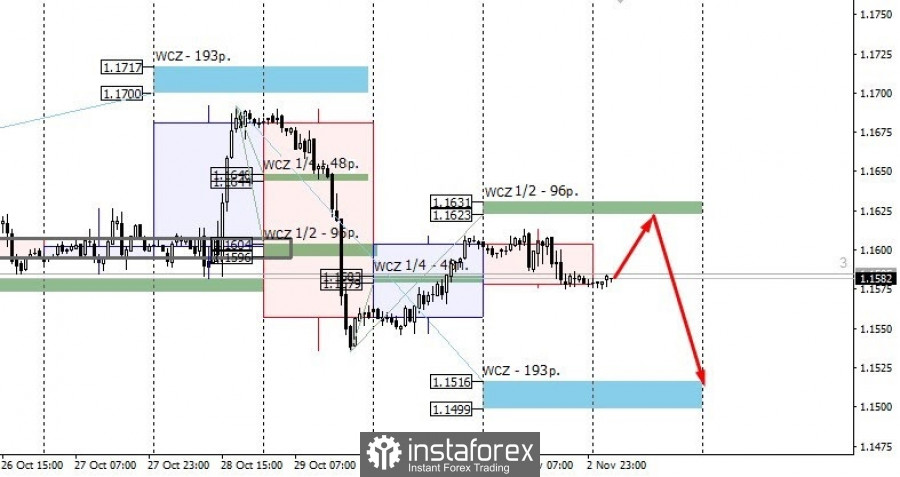
| Trading plan for EUR/USD on November 3, 2021 Posted: 02 Nov 2021 07:50 PM PDT The basis of the downward momentum is the descending daily candlestick of the EUR/USD pair, which formed on October 29. The growth of the instrument to the Weekly Control Zone 1/2 1.1623-1.1631 is corrective, so testing this zone will allow us to get favorable prices to sell. The main focus in trading is to decline, although the upward movement may still continue as part of the downward correction of the pair, which occurred on October 29. Moreover, Friday's momentum remains a priority as long as the pair trades below the WCZ 1/2. Testing this zone will be decisive. The downward target is the Weekly Control Zone 1.1516-1.1499.
To cancel the downward movement, it will be necessary to close daily trading above the level of 1.1631. This will create conditions for changing the momentum to an upward one. The descending target will no longer be relevant. In the meantime, the probability of forming an upward reversal remains within 25%. The material has been provided by InstaForex Company - www.instaforex.com |
| Posted: 02 Nov 2021 07:40 PM PDT GBP/USD 5M
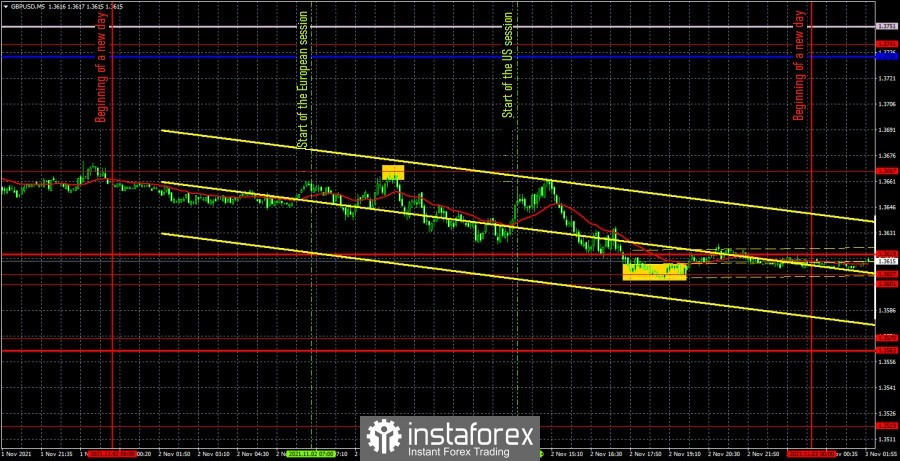
The GBP/USD pair was traded as if at the "wake" on November 2. Despite the fact that, unlike the euro/dollar pair, the downward movement persists, we can clearly see on the 5-minute TF that it is formal. The price was between the levels of 1.3607 and 1.3667 during the European and US trading sessions (as well as Asian), which is in the 60-point horizontal channel. Consequently, even the intraday trend movement was completely absent for the pound/dollar pair yesterday. Also, there was not a single important macroeconomic event in either the UK or the US during the day. Thus, the fundamental background could not encourage traders to be more active. In general, the markets are presumably waiting for two meetings of central banks at once and, perhaps, therefore, they are in no hurry to force events and take risks. Why should they do this if it becomes absolutely clear on Thursday afternoon what changes will be made to the monetary policy of the Federal Reserve and the Bank of England? We remind you that during the publication of important reports or important events, you should not enter the market or always set Stop Loss. Therefore, there may just be few opportunities to enter the market today and tomorrow, since there will be a lot of foundation and reports. And yesterday there were practically no such reasons and opportunities, since only one trading signal was formed during the day. The price bounced off the extremum level of 1.3667, which became a sell signal, which should have been worked out by a short position. After its formation, the pair managed to go down about 30 points, but from the first time it failed to work out the support level of 1.3619. Therefore, the trade was closed by Stop Loss at breakeven, as the price returned to the level of 1.3667 before starting the second round of decline, during which it reached the level of 1.3619. No signal was generated near the level of 1.3619, since signals are formed only near extreme levels (thin red lines). A little later, the price dropped to the level of 1.3607, but this signal should not have been worked out, as it was formed too late. GBP/USD 1H
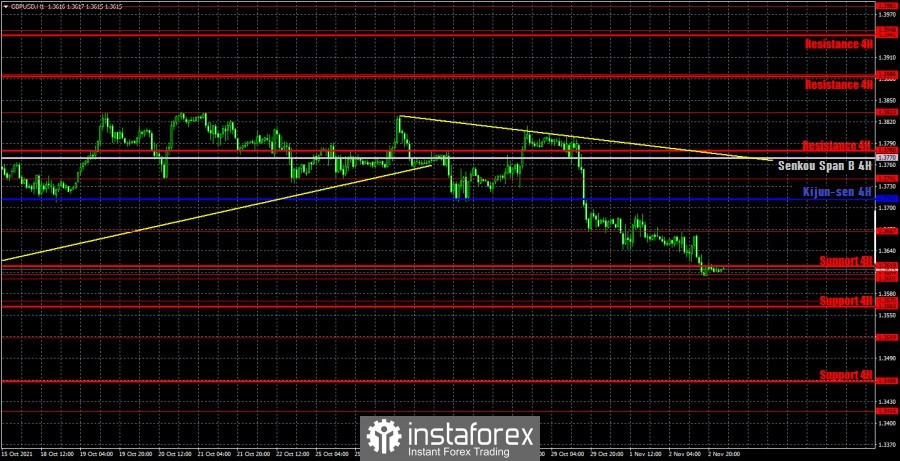
On the hourly timeframe, the pound/dollar pair is trying with all its might to continue the downward movement and even a downtrend line was formed, which, however, has a very small slope and is weak. However, the downward movement of the pair itself is also weak now. Thus, there is formally a downward trend, but it is so inaccurate, and the price is already very far from the trend line, so it is unlikely that it will be possible to get any benefit from the presence of this line. We distinguish the following important levels on November 3: 1.3519, 1.3570, 1.3601 - 1.3607, 1.3667, 1.3741. Senkou Span B (1.3770) and Kijun-sen (1.3713) lines can also be signal sources. It is recommended to set the Stop Loss level at breakeven when the price passes 20 points in the right direction. The Ichimoku indicator lines can move during the day, which should be taken into account when looking for trading signals. On Wednesday, only a minor index of business activity in the services sector will be published in the UK. All the most interesting things planned in the United States - the Fed meeting, a press conference with Jerome Powell, the ADP report on changes in the number of employees in the private sector, as well as the index of business activity in the ISM services sector. Each of these events can have at least a small impact on the US dollar. We recommend you to familiarize yourself: Overview of the EUR/USD pair. November 3. Will the Fed surprise the markets? What to expect from the Fed meeting? Overview of the GBP/USD pair. November 3. France changed its mind to develop a "fish conflict" with Great Britain. Forecast and trading signals for GBP/USD for November 3. Detailed analysis of the movement of the pair and trade deals. COT report
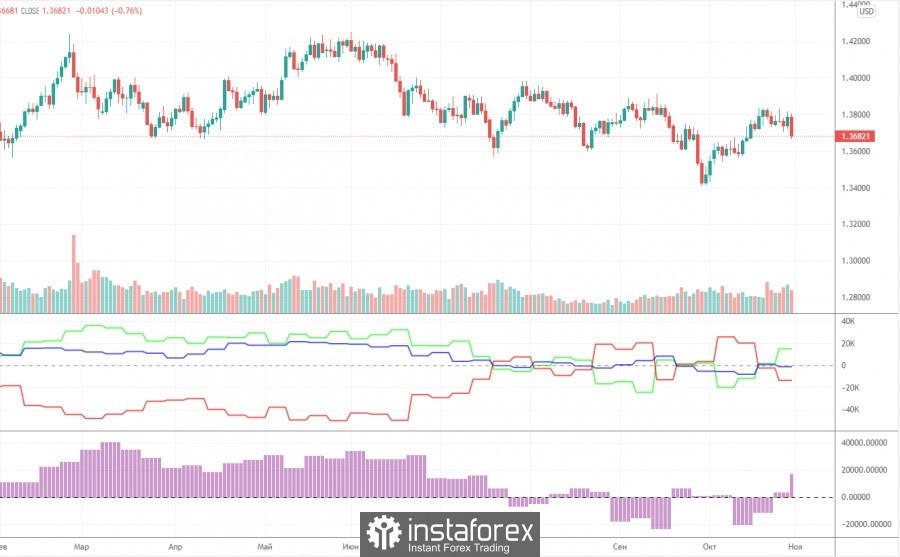
The mood of professional traders became more bullish during the last reporting week (October 19-25). The situation with the COT reports is now even more ambiguous than with the technical picture. And if we compare the COT reports for the euro and the pound, the situation becomes even stranger. Both indicators in the chart above show that the major players still do not have any clear, precise and understandable mood. Consequently, it simply does not make sense to make any forecasts based on COT reports now. The chart above clearly shows the pair's entire movement over the past six months. It is rather difficult to call it a trend or even a trend. The mood of the big players has been constantly changing in the last couple of months. The green and red lines of the first indicator (net positions of groups of traders "commercial" and "non-commercial") are constantly changing the direction of movement, constantly crossing the zero mark. This means that the two largest groups of traders are constantly increasing and decreasing their net positions. During the reporting week, professional traders opened 2.8 thousand buy contracts (longs) and closed 10.7 thousand sell contracts (shorts). Thus, their net position increased by 10,000 contracts. This is in line with what has been happening with the pound in recent weeks (it is growing). Nevertheless, it is impossible to make a long-term forecast, since the net position may fall already by the end of next week. Especially considering the fall of the pound itself on Friday. Explanations for the chart: Support and Resistance Levels are the levels that serve as targets when buying or selling the pair. You can place Take Profit near these levels. Kijun-sen and Senkou Span B lines are lines of the Ichimoku indicator transferred to the hourly timeframe from the 4-hour one. Support and resistance areas are areas from which the price has repeatedly rebounded off. Yellow lines are trend lines, trend channels and any other technical patterns. Indicator 1 on the COT charts is the size of the net position of each category of traders. Indicator 2 on the COT charts is the size of the net position for the non-commercial group. The material has been provided by InstaForex Company - www.instaforex.com |
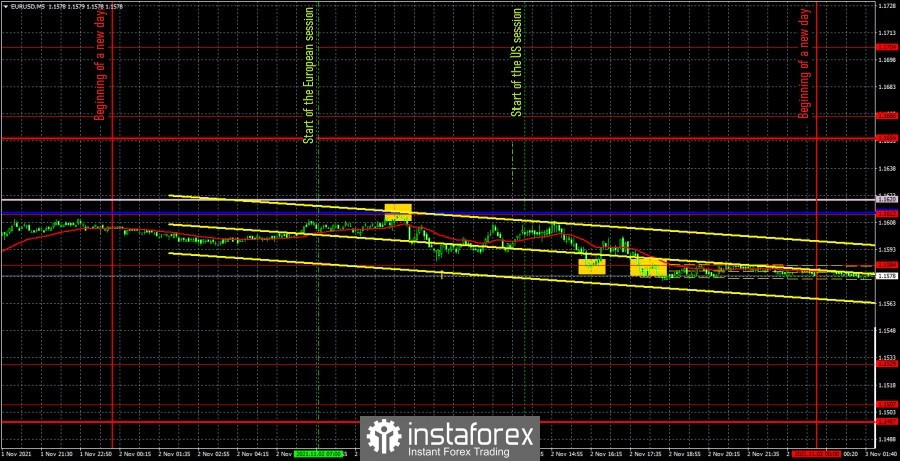
| Posted: 02 Nov 2021 07:40 PM PDT EUR/USD 5M
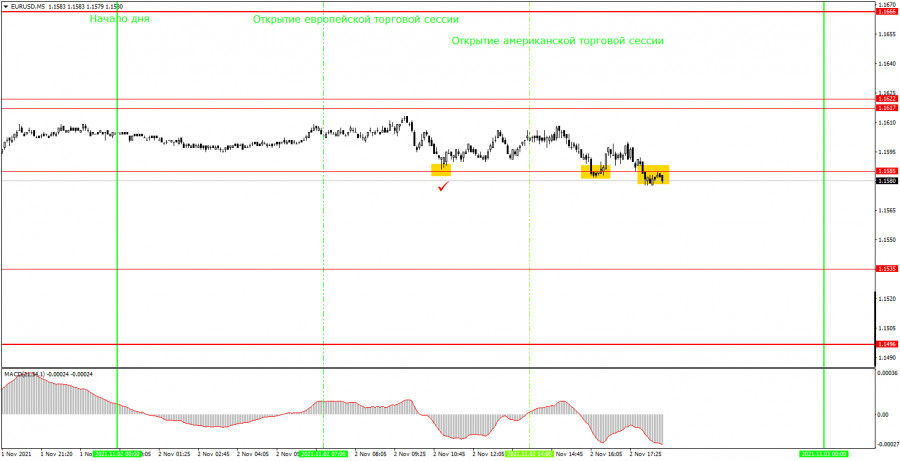
The EUR/USD pair showed volatility equal to 40 points on Tuesday. That is how much the pair passed during the entire Asian trading session, European and US. Needless to say, such a movement is called not just "flat", but a "total flat"? No important macroeconomic reports released in either the United States or the European Union on Tuesday. Thus, traders, in fact, had nothing to react to during the day. A single report on business activity in the manufacturing sector of the eurozone (figure "1" in the chart) did not provoke any reaction, as its value did not differ from the forecast. It should also be noted that on the eve of the day when the results of the Federal Reserve meeting will be announced, the markets did not find any reason to trade actively. This means that they prefer not to force things or take unnecessary risks. Although in the case of the euro/dollar pair, the markets have not been taking unnecessary risks for several consecutive months. All that remains for us is to analyze all the trading signals that were generated during the past day. Fortunately, there were few of them. The first signal - to sell - was formed at the beginning of the European session, when the price bounced off the critical line of the Kijun-sen. Subsequently, the price managed to fall about 20 points and even reach the nearest target extremum level of 1.1584. It was the rebound from this level that allowed to close the deal in profit of about 12 points. However, with such "crazy" volatility, it was possible, in principle, not to enter the market. A short position could also be closed in zero profit if traders set Stop Loss to breakeven after 15 points down, according to our recommendations. In any case, either no profit or minimal profit. A buy signal from the level of 1.1584 could also be worked out with a buy trade, but it did not bring profit, since the price went below this level a little later, "eating" the profit on the first trade. EUR/USD 1H
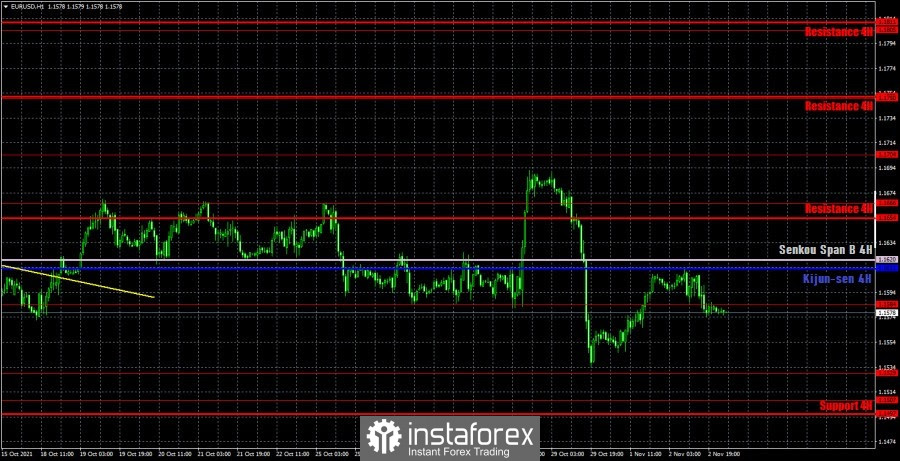
The hourly timeframe also clearly shows that the euro/dollar pair was in absolute flat on Tuesday and practically did not move. However, in addition to this, the chart above clearly shows the absence of a trend. Not just the absence of a trend line or channel, but the absence of even a horizontal channel. That is, now neither flat nor trend have formed for the pair. This is an absolutely confusing situation and, given the macroeconomic and fundamental background this week, it is unlikely that it will become clearer. We highlight the following levels for trading on Wednesday - 1.1507, 1.1529, 1.1584, 1.1666, 1.1704, as well as the Senkou Span B (1.1620) and Kijun-sen (1.1613) lines. The Ichimoku indicator lines can change their position during the day, which should be taken into account when looking for trading signals. Signals can be rebounds or breakthroughs of these levels and lines. Do not forget about placing a Stop Loss order at breakeven if the price moves 15 points in the right direction. This will protect you against possible losses if the signal turns out to be false. The European Union will publish the unemployment rate, and European Central Bank President Christine Lagarde will give a speech. The results of the Fed meeting will be announced in America, and during the day - the ADP report on the state of the labor market, as well as the index of business activity for the ISM services sector. Both of these reports, under certain circumstances, can cause a reaction from the market, as they are "relatively important". We recommend you to familiarize yourself: Overview of the EUR/USD pair. November 3. Will the Fed surprise the markets? What to expect from the Fed meeting? Overview of the GBP/USD pair. November 3. France changed its mind to develop a "fish conflict" with Great Britain. Forecast and trading signals for GBP/USD for November 3. Detailed analysis of the movement of the pair and trade deals. Analysis of the COT report
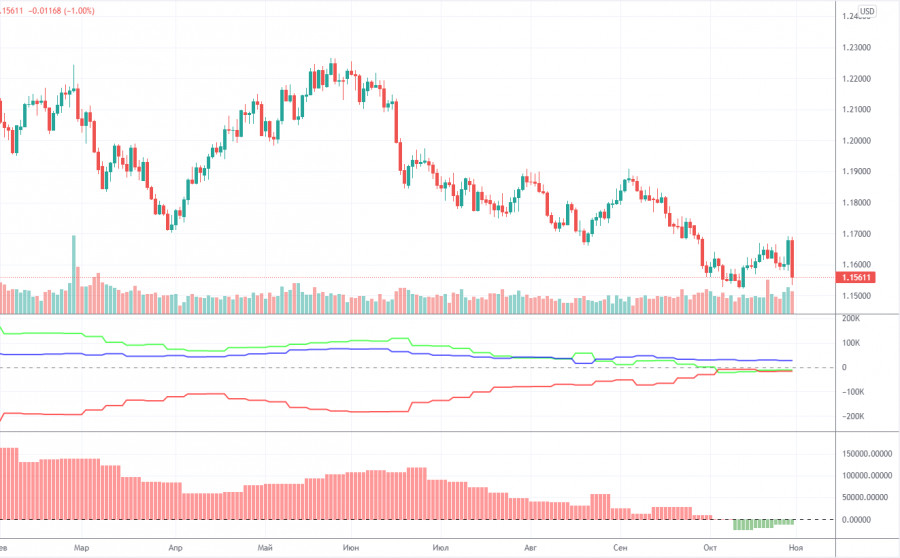
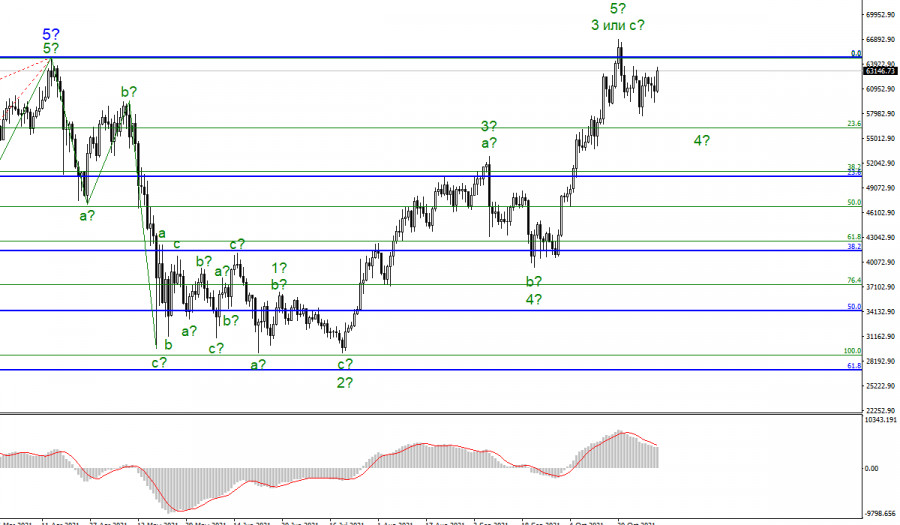
The mood of non-commercial traders practically did not change during the last reporting week (October 19-25). A group of non-commercial traders opened 4,000 sell contracts (shorts) and 4,000 buy contracts (longs). Consequently, the net position of professional players has not changed. And if so, then the mood of the large traders remained... bearish. Yes, exactly bearish, as evidenced by both indicators in the chart above. The green and red lines of the first (net positions of non-commercial and commercial players) continue to move towards each other, which still means that the upward trend is ending. Or the downward correction is delayed. Recall that the process of convergence of these lines began at the beginning of the year, when the upward movement stopped. At this time, this whole process does not even fit into a chart - the downward movement continues for so long, which we still consider to be a correction. The most interesting thing is that the last two trading days this week did not make it into the latest COT report. That is, we do not know how the major players traded on Thursday and Friday, when the pair passed about 250 points. It should also be noted that the net position of non-commercial traders remains below zero. That is, the number of short positions exceeds the total number of long positions. Consequently, based on the COT reports, the fall of the European currency may continue. The nearest target, as we have already said, is the important level of 1.1490. So far, the COT reports absolutely do not provide a conclusion about a change in trend. Explanations for the chart: Support and Resistance Levels are the levels that serve as targets when buying or selling the pair. You can place Take Profit near these levels. Kijun-sen and Senkou Span B lines are lines of the Ichimoku indicator transferred to the hourly timeframe from the 4-hour one. Support and resistance areas are areas from which the price has repeatedly rebounded off. Yellow lines are trend lines, trend channels and any other technical patterns. Indicator 1 on the COT charts is the size of the net position of each category of traders. Indicator 2 on the COT charts is the size of the net position for the non-commercial group. The material has been provided by InstaForex Company - www.instaforex.com |
| Posted: 02 Nov 2021 02:17 PM PDT
Polkadot is one of the most discussed and desired crypto assets for investors. Its fundamental features and innovativeness allow the crypto asset to take a swing at new historical highs. Well-known analyst Michael Van De Poppe said that Polkadot has very good prospects for a long bull run, and it will be able to grow to $75 by the end of the 4th quarter of this year if the current levels remain the same and there are no breakouts and corrections. Yesterday, Polkadot reached its all-time high and was trading at $50.87. Polkadot (DOT) is already ready to launch parachains in the near future, which is the reason that the price of the token has reached a record high, and will also grow further after the launch of the parachain. Analysts are confident that if investors want to seriously invest in Polkadot, then they should wait for a local correction to the level of $45, and then to $43 - these two levels are the key levels that can be viewed for entry for institutional investors. Today Polkadot is trading at $48.7, it has fallen by more than 10% in a day. The coin is steadily moving towards profitable entry points for many investors. It is also known that this upward movement of the crypto asset is associated with the resolution of the registration of parachains. Now this decision will be put to a public referendum. If this decision is approved at this referendum, then parachain-startart will be able to register their parachain and open crowdsames on November 4. Back in early October, the developers announced that investors will be able to trade parachains for the first time, and the long-awaited first auction takes place on November 11. Now many competing startups can use this crowdsourcing loan method to obtain funding in Dot tokens to launch their blockchain auctions. Moonbeam is a platform that is compatible with the Ethereum virtual machine, this platform allows developers to transfer their code from Ethereum to Polkadot without any problems. The material has been provided by InstaForex Company - www.instaforex.com |
| USD/JPY. "Follow me": the yen will follow the greenback Posted: 02 Nov 2021 02:17 PM PDT The USD/JPY pair has been trading in the 100-point price range of 113.50-114.50 for almost the last three weeks, briefly leaving the boundaries of this echelon. Bulls have not implemented an ambitious plan to conquer the 115th figure: the pair has been actively growing since the end of September, but after reaching a local price peak of 114.70, it turned down. However, USD/JPY bears also cannot boast of any decent result. The corrective downward momentum faded away near the support level of 113.50, which corresponds to the average line of the Bollinger Bands indicator on the daily chart. As a result, the pair got stuck within this range in anticipation of a powerful information driver.
Obviously, the US Federal Reserve can act as such a driver, which will announce the results of the November meeting tomorrow. The Bank of Japan has already said its word, which traditionally turned out to be not in favor of the yen. Now it's the turn of the US central bank. And if the market is by and large accustomed to the dovish rhetoric of BOJ Governor Haruhiko Kuroda, then in the case of the Federal Reserve, the rates are much higher. However, everything will be discussed in order. The Japanese central bank held its penultimate meeting this year last week. The BOJ did not present any surprises: all the parameters of the monetary line remained the same, and Kuroda's rhetoric was of a familiar nature. Kuroda once again stated that the central bank is "without any hesitation" ready to continue easing monetary policy "if necessary." But at the same time, he did not announce the specific conditions under which the central bank will decide on further easing. This phrase is already standard, and rather formal, so traders tend to ignore it. However, this time Kuroda commented on the significant weakening of the national currency with a "bonus". Let me remind you that the yen, paired with the dollar, has been actively losing its positions for six weeks. If at the end of September USD/JPY was in the area of 109.10-109.20, then on October 20, traders updated the multi-year high, ending up at 114.71. The more than 500-point march was primarily due to the devaluation of the Japanese currency, and secondly, the strengthening of the greenback. It is noteworthy that Kuroda welcomed the weakening of the national currency. On the one hand, he acknowledged that the devaluation of the yen is hitting imports, also inflating household costs. But, on the other hand, he noted that, in general, he does not consider the current weakening of the Japanese exchange rate to be a "negative fact." This remark had a very indirect effect on the dynamics of USD/JPY. The sharp upward momentum was replaced by a downward pullback, which was then once again replaced by a corrective wave. All this suggests that the yen has demonstrated a formal reaction to the announced results of the penultimate meeting of the BOJ this year and Kuroda's subsequent comments. In general, USD/JPY bulls are clearly "exhausted" after weeks of consistent growth. Bears, in turn, cannot reverse the situation for the pair against the background of strong greenback positions. In recent weeks, the Japanese currency has completely ignored its "own" fundamental factors, while reacting weakly to the external fundamental background. For example, the yen has actually remained indifferent to the escalation of tensions between Beijing, Taipei and Washington. After Joe Biden's words that the United States would defend Taiwan in the event of Chinese intervention, the Japanese currency showed only a formal reaction, despite the surge of anti-risk sentiment in the market. The greenback, in turn, has also been demonstrating a passive position over the past weeks. Dollar bulls react reflexively to the current news flow (for example, to the growth of the RCE), but at the same time they do not dare to launch a full-scale offensive. The USD/JPY pair has been growing for six weeks mainly due to the divergence of the rates of the Fed and the Bank of Japan. And now the dollar bulls need additional feeding of a fundamental nature. Therefore, traders froze in anticipation of the key event of the week and, most likely, of the month.
Thus, the prevailing fundamental background suggests that the yen will continue to move in the wake of the US currency. Before the announcement of the results of the November Fed meeting, the pair will certainly not leave the above price range: traders will not dare to bet on the growth or decline of the price on the eve of such an important event. But according to the results of tomorrow's meeting, the pair will follow the greenback, which will either continue its ascent or will be under strong pressure. Therefore, in my opinion, at the moment it is advisable to take a wait-and-see position on the pair. If the results of the November meeting disappoint dollar bulls (the Fed will begin to curtail QE, but at the same time refrain from hawkish hints about the fate of the interest rate), the pair may sink not only to the lower limit of the above range (113.50), but also to the next support level of 112.70 (Kijun-sen line on the D1 timeframe). However, if we consider medium-term trading (not to mention long-term), it is advisable to use this decline to open longs. The uncorrelation of the rates of the Fed and the Bank of Japan (which will undoubtedly remain) will not allow the USD/JPY bears to break the upward trend for the pair. For this reason, long positions with price declines to the above support levels look quite attractive. The material has been provided by InstaForex Company - www.instaforex.com |
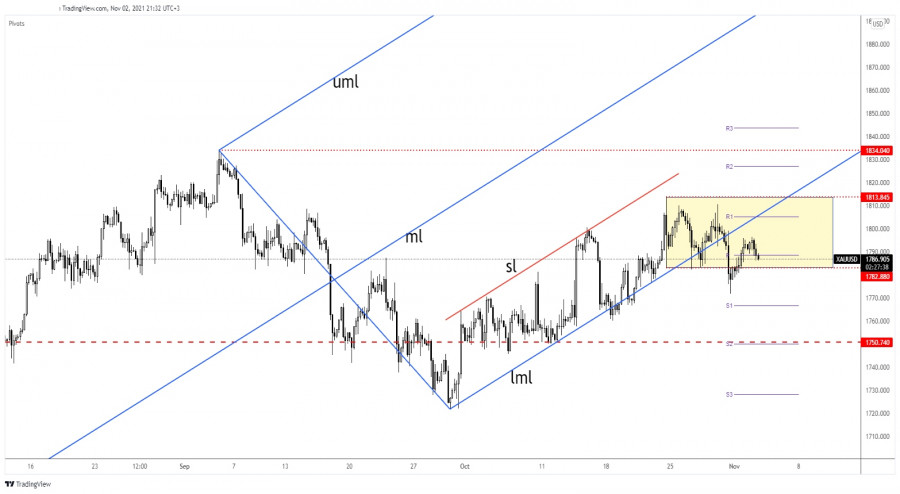
| Posted: 02 Nov 2021 01:27 PM PDT At the time of writing, Gold was trading in the red at the 1,787.17 level far below 1,796.43 today's high. In the short term, the pressure is still high as the Dollar Index has started to grow again. DXY's further growth could force the yellow metal to drop deeper. Technically, the rate is located in the seller's territory, so a further drop is possible. Tomorrow, the FOMC, ISM Services PMI, and the ADP Non-Farm Employment Change could be decisive. These are seen as high-impact events and could bring high volatility. The Federal Reserve is expected to maintain its monetary policy unchanged in the November meeting. In the short term, XAU/USD plunged after Euro-zone reported higher inflation. Yesterday, it has increased, even if the US ISM Manufacturing PMI has come in better than expected. XAU/USD upside seems limited
As you can see on the H4 chart, XAU/USD has rebounded but it has failed to approach and reach the Ascending Pitchfork's lower median line (lml). Gold failed to stay within the Ascending Pitchfork's body signaling that the buyers are exhausted and that the rate could develop a downside movement. It has also dropped below 1,782.88 static support, from the temporary range, signaling a potential deeper drop. Gold forecastIts failure to approach and reach 1,813.84 high and its drop below the lower median line (lml) and under 1,782.88 signaled that the sellers could take the lead anytime. Failing to stabilize above 1,788.61 weekly pivot point and dropping under 1,782.88 could announce potential drops. Only making a new higher high, a bullish closure above 1,796.43 may signal potential further growth. The material has been provided by InstaForex Company - www.instaforex.com |
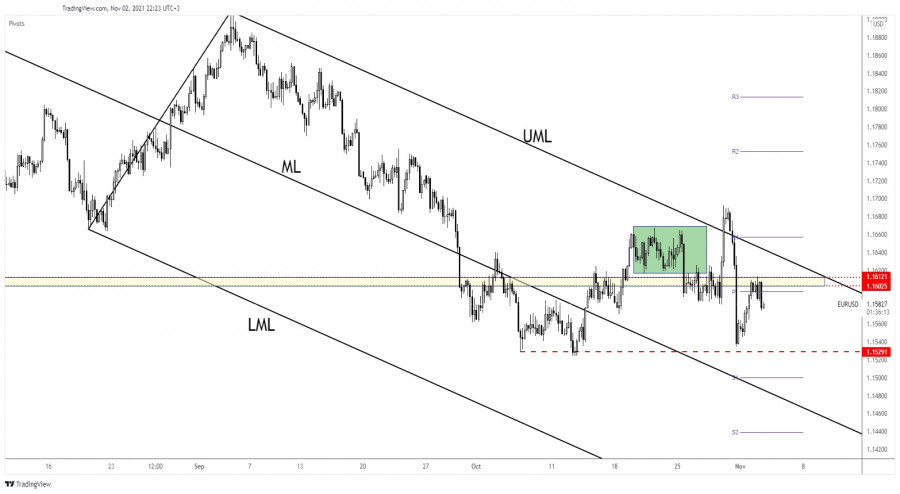
| EUR/USD ends its temporary rebound Posted: 02 Nov 2021 01:26 PM PDT EUR/USD plunged after reaching 1.1613 today's high. It was traded at the 1.1581 level above the 1.1575 daily low. The pair registered a rebound only because the Dollar Index dropped after its amazing rally. Fundamentally, the euro took a hit from the eurozone economic data today. The Final Manufacturing PMI dropped from 58.5 to 58.3 points, the German Final Manufacturing PMI was reported at 57.8 below 58.2 estimates, while the Spanish Manufacturing PMI fell from 58.1 to 57.4, though experts expected potential growth to 58.2 points. EUR/USD more declines in view
EUR/USD has increased a little to retest the 1.1602 - 1.1616 resistance area, where support has turned into resistance. Failing to stay above the weekly pivot point (1.1596) signaled strong sellers. In the short term, EUR/USD could still come back to retest the weekly pivot point before resuming its sell-off. EUR/USD predictionAfter its failure to stabilize above the upper median line (UML), EUR/USD signaled a larger downside movement. It is likely to drop deeper as long as it stays below the 1.1596 weekly pivot point. The level of 1.1529 stands as an important downside target if the rate drops further. It could approach and reach new lows if the Dollar Index jumps higher. The material has been provided by InstaForex Company - www.instaforex.com |
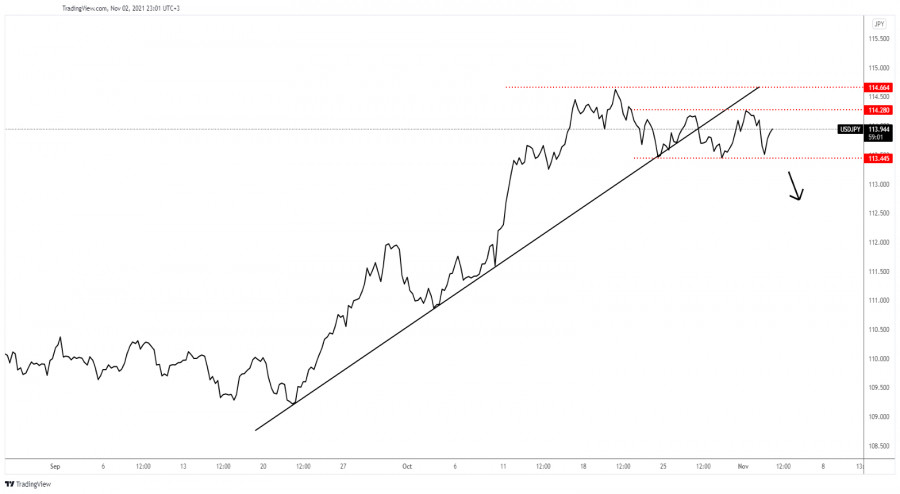
| USD/JPY downside could be invalidated Posted: 02 Nov 2021 01:24 PM PDT
USD/JPY range patternThe USD/JPY pair moves sideways between 113.44 and 114.28 levels. Technically, a drop below the uptrend line signaled that the pair could develop a corrective phase. Still, as long as it stays above 113.44 low, the bias remains bullish, and the rate could climb higher. So, only a drop below 113.44 is likely to announce a larger downside movement. On the other hand, jumping and staying above 114.28 and 114.66 former high may signal further growth. USD/JPY trading conclusionA drop below the 113.44 former low is seen as a selling opportunity. On the other hand, climbing above 114.66 higher high could announce an upside continuation. The material has been provided by InstaForex Company - www.instaforex.com |
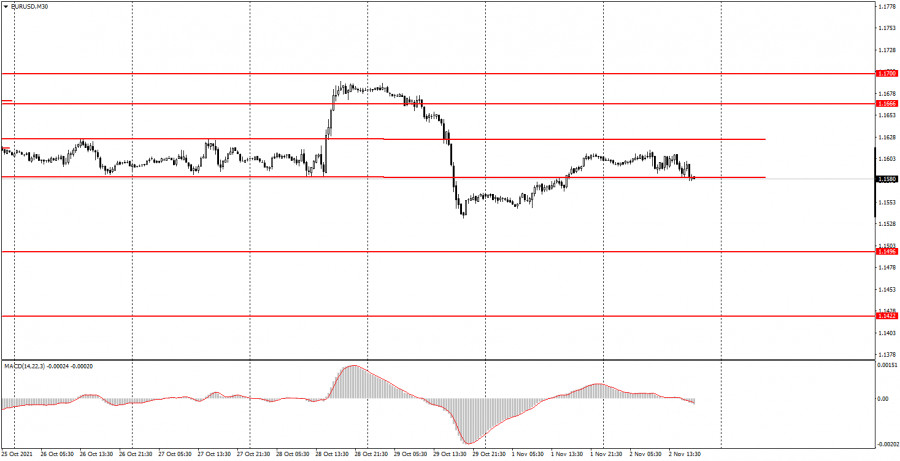
| Posted: 02 Nov 2021 12:31 PM PDT Analysis of Tuesday's trades:EUR/USD 30M Chart
On Tuesday, November 2, EUR/USD went 38 pips from the low to high which is characteristic behavior of this pair. In addition to low volatility that has become a frequent occurrence, the pair returned to a sideways channel where it had been stuck for several days before breaking out of it at the end of the last week. Today in late trades, EUR/USD was making attempts to breach the lower boundary of the channel, but the trend remained flat due to low volatility. Given the above factors, we still recommend ignoring the MACD signals. As for the macroeconomic statistics, the only event that was worth attention on Tuesday was the Services PMI from the eurozone. The index reading came in a bit lower than expected, so this report caused little reaction from market participants. EUR/USD 5M Chart
As seen on the 5M time frame, the movement was rather sluggish on Tuesday. Most of the time, the pair was fluctuating between 1.1585 and 1.1617, i.e. in a 30-pips channel. It even failed to break the channel's upper boundary. In addition to bad dynamics, there were almost no trading signals. Those signals that were formed turned out to be false. Unfortunately, it often happens in a flat trend. Let us remind you that the optimal place to set a Take Profit is 30 pips away from an opening price. Is there any chance that it will be triggered given that the pair moved by just 40 pips? But let us get back to the trading signals that were formed after all. The first one appeared during the European session - it was a buy signal after the price rebounded from 1.1585. Then the price managed to rise by about 16 pips that were barely enough to set a Stop Loss. So, when the price moved lower, my buy trade was closed with no losses. The next signal was formed near the same level of 1.1585 as the price rebounded from it again. But this time, it moved by just 10 pips, so I had to close my buy deal manually after the price went below 1.1585. The last sell signal was useless, as it became clear that the pair is trading flat and two false signals were formed near 1,1585. Trading plan on Wednesday, November 3As seen on the 30M time frame, volatility fell to the recent levels, and there is neither any definite trend nor a sideways channel. So it is rather difficult to define the current movement. Trading on the 30M time frame is still inconvenient, and the MACD signals are still better to be ignored. It would be a sound idea to wait for the formation of a trend line or a sideways channel. On the 5M time frame, the key levels for November 3 are 1.1535, 1.1585, and 1.1617 – 1.1622. The Take profit should be set at a distance of 30-40 pips as usual while the Stop loss can be placed at 15 pips away from a current price. On the 5M timeframe, the nearest level can serve as a target unless it is located too close or too far. Otherwise, use the Take Profit. The economic calendar on Wednesday is full of important reports. The United States will unveil the Non-farm Payrolls data and the Services ISM index. At the same time, the EU unemployment report will see the light. Later in the day, the Federal Reserve will announce its decision which will be the key event of the day. The basic principles of the trading system1) The strength of the signal depends on the time period during which the signal was formed (a rebound or a break). The shorter this period, the stronger the signal. 2) If two or more trades were opened at some level following false signals, i.e. those signals that did not lead the price to the Take Profit level or the nearest target levels, then all consequent signals near this level should be ignored. 3) In a flat trend, any currency pair may form a lot of false signals or do not produce any signals at all. In any case, the flat trend is not the best condition for trading. 4) Trades are opened in the time period between the beginning of the European session and until the middle of the American one when all deals should be closed manually. 5) We can pay attention to the MACD signals in the 30M time frame only if there is a good measure of volatility and a definite trend confirmed by a trend line or a trend channel. 6) If two key levels are too close to each other (about 5-15 pips), then this is a support or resistance area. How to read charts:Support and Resistance price levels can serve as targets when buying or selling. You can place Take Profit levels near them. Red lines are channels or trend lines that display the current trend and show which direction is better to trade. The MACD indicator (14,22,3) is a histogram and a signal line that signal to enter the market when they cross. This indicator is better to be used in combination with trend channels or trend lines. Important speeches and reports that are always reflected in the economic calendars can greatly influence a currency pair. Therefore, during such events, it is recommended to trade as carefully as possible or exit the market in order to avoid sharp price reversal against the previous movement. Beginning traders should remember that every trade cannot be profitable. The development of a reliable strategy and money management are the key to success in trading over a long period of time. The material has been provided by InstaForex Company - www.instaforex.com |
| Major crypto market news for November 2, 2021 Posted: 02 Nov 2021 11:20 AM PDT |
| November 2, 2021 : EUR/USD daily technical review and trading opportunities. Posted: 02 Nov 2021 10:58 AM PDT
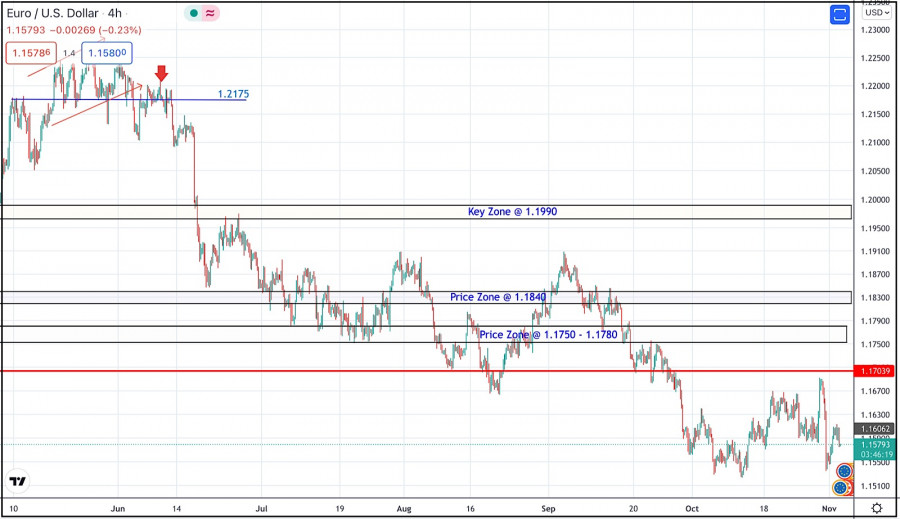
Recently, Persistence below the depicted price zone of 1.1990 indicated further downside movement towards 1.1840 and 1.1780 where a sideway consolidation range was established. During last week, the EURUSD pair has been trapped within a narrow consolidation range between the price levels of 1.1780 and 1.1840. A bullish breakout was executed above 1.1840 shortly after. Temporary Upside pullback was expected towards 1.1990. However, re-closure below the price level of 1.1840 has initiated another downside movement towards 1.1780 which failed to hold prices for a short period of time before significant upside movement was presented into market. Intraday traders were advised to wait for candlestick closure above 1.1780 - 1.1840 for another ascending swing to be initiated. However, immediate downside selling pressure brought the pair down below 1.1700. More downside movement took place towards the price level of 1.1600 where significant buying pressure existed. Bearish persistence below 1.1700 and 1.1600 has enhanced further decline towards 1.1500. Currently, the price zone around 1.1700 stands as a prominent supply-zone to be watched for SELLING pressure and a possible SELL Entry upon any upcoming ascending movement. The material has been provided by InstaForex Company - www.instaforex.com |
| November 2, 2021 : EUR/USD Intraday technical analysis and trading plan. Posted: 02 Nov 2021 10:56 AM PDT
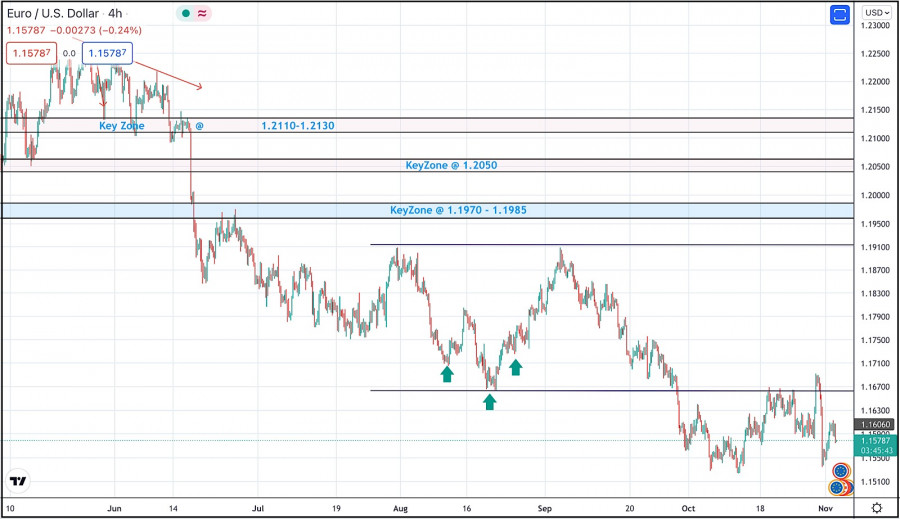
Bearish persistence below the price zone of 1.2050-1.2000 allowed the recent downtrend to be established. So, the EURUSD pair has expressed significant bearish decline while the price level of 1.1650 stood as a prominent demand level that prevented further bearish decline. The bullish pressure that originated around 1.1650 failed to push higher than the price level of 1.1900. That's why, another bearish pullback towards 1.1650 was executed. Bullish signs were expected around the price levels of 1.1650-1.1700 as it corresponded to a recent previous bottom. However, extensive bearish decline has pushed the EURUSD pair towards 1.1600 and lower levels was about to be reached if sufficient bearish momentum was maintained. Moreover, significant bullish recovery has originated recently upon testing the price level of 1.1570. The recent bullish pullback towards 1.1650-1.1680 was expected to offer bearish rejection and a valid SELL Entry. Significant bearish decline brought the EURUSD pair again towards 1.1550 levels which still stands as an Intraday Support zone. Hence, sideway movement maybe expected in the nearest future. Please note that any Bullish movement above 1.1680 should be considered as an early exit signal to offset any SELL trades. The material has been provided by InstaForex Company - www.instaforex.com |
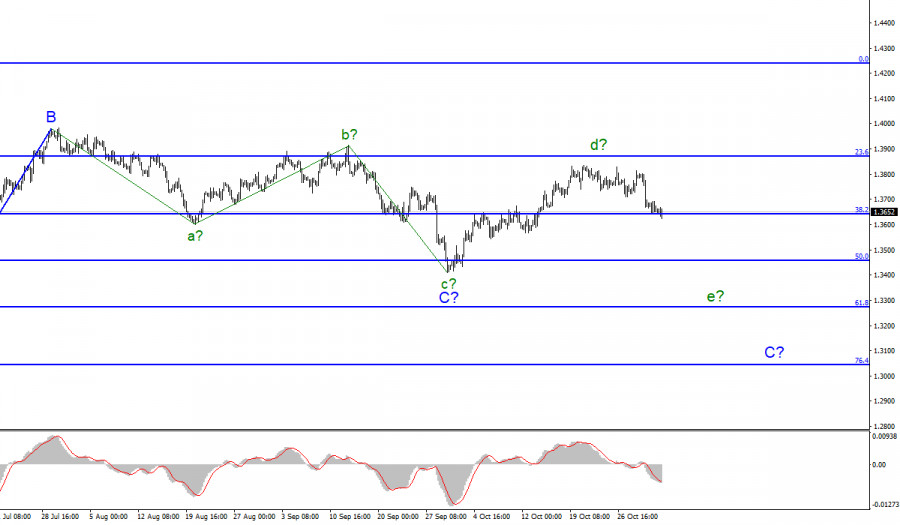
| Wave analysis of GBP/USD for November 2: Business activity indices, ADP report, Fed meeting Posted: 02 Nov 2021 10:53 AM PDT |
| November 2, 2021 : GBP/USD Intraday technical analysis and significant key-levels. Posted: 02 Nov 2021 10:52 AM PDT
The GBPUSD pair has been moving sideways with some bearish tendency while bearish breakout below 1.3600 was needed to enhance further bearish decline. On the other hand, the nearest SUPPLY level was located around 1.4000 where bearish rejection and a valid SELL Entry was anticipated. The recent bullish rejection witnessed around 1.3600 as well as the temporary bullish breakout above 1.3830 indicated a high probability that this bullish movement may pursue towards 1.4025 then 1.4100. However, the pair remained trapped within a fixed price range until significant bearish momentum emerged into the market. Bearish breakout below 1.3680 enabled further bearish decline towards 1.3400 which corresponded to 123% Fibonacci Level of the most recent bearish movement. This was a good entry level for a corrective bullish pullback towards 1.3650 and 1.3720 which was temporarily bypassed. Recently, the pair was testing the resistance zone around 1.3830 where bearish pressure originiated into the market. Currently, the short-term outlook is bearish as long as the pair maintains its movement below 1.3730. Another bearish visit is expected towards 1.3570 and 1.3400 as they correspond to significant Fibonacci Expansion Levels. The material has been provided by InstaForex Company - www.instaforex.com |
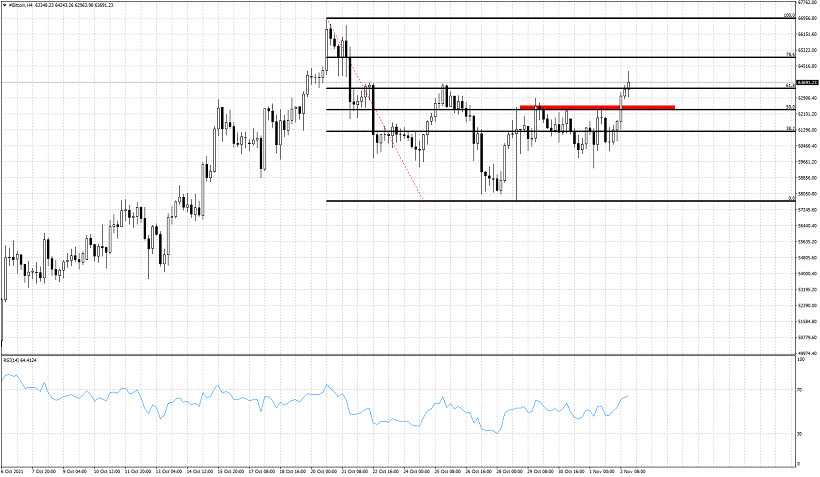
| Short-term analysis on Bitcoin. Posted: 02 Nov 2021 10:39 AM PDT Bitcoin is trading at $63,000 having broken above the horizontal resistance of $62,400. Price has started making higher highs and higher lows in the 4 hour chart. This is an important step in order to build up the next upward move. Bulls need to defend $59,700-$60,000 price level.
Red rectangle -horizontal resistance Bitcoin is climbing higher. Will this be a lower high? Resistance is at $63,380 and next at $64,900. A rejection at any of these levels will be a sign of weakness. Short-term trend is reversing to bullish as price has started making higher highs. Failure to hold above $59,700-$60,000 will signal another trend reversal back to bearish and will imply that our next target should be below the $57,700 lows. The material has been provided by InstaForex Company - www.instaforex.com |
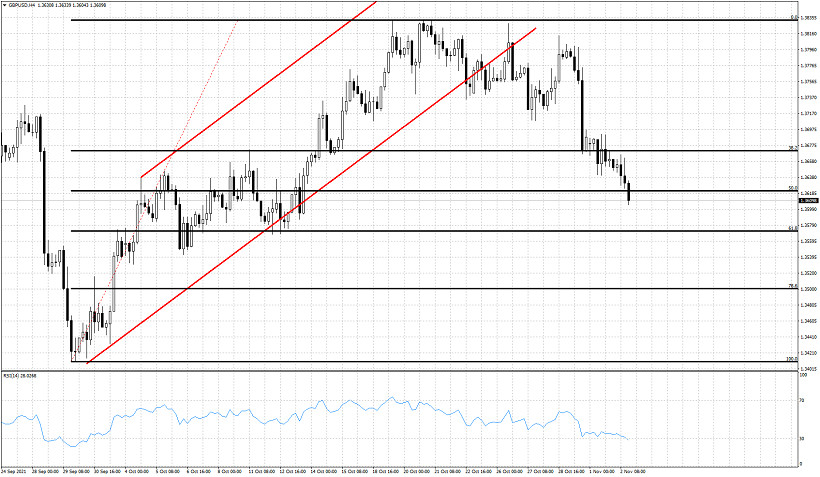
| GBPUSD approaching second target. Posted: 02 Nov 2021 10:33 AM PDT GBPUSD remains in a bearish trend. Price failed to hold the first key support at the 38% Fibonacci level. Price has now reached our second target the 50% Fibonacci retracement level at 1.3620. Price has broken this support level and is moving lower.
Black lines - Fibonacci retracements GBPUSD is clearly in a bearish trend making lower lows and lower highs. The RSI continues making lower lows and has just reached the oversold area. A bounce from current levels is justified but a move lower towards the 1.3570 level is highly probable as long as price is below 1.3665. The material has been provided by InstaForex Company - www.instaforex.com |
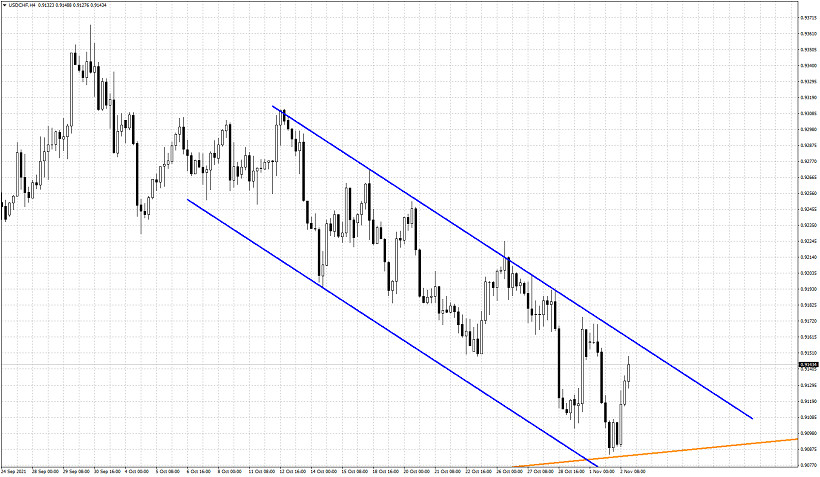
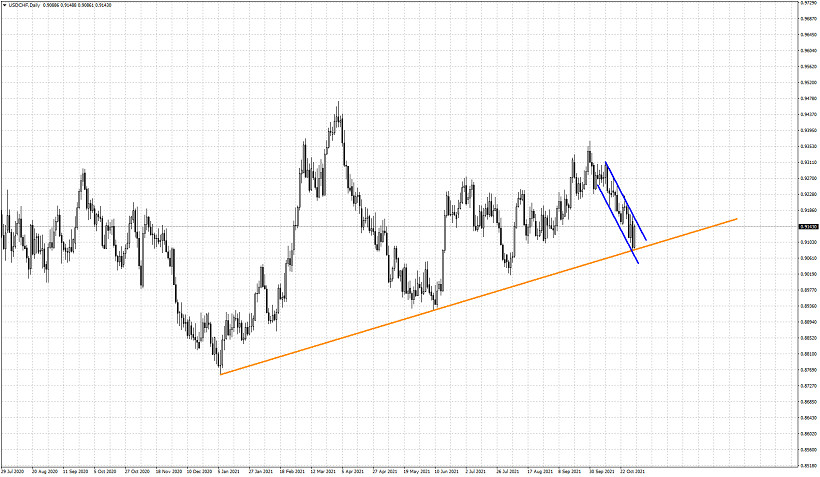
| USDCHF reversal from our target zone. Posted: 02 Nov 2021 10:29 AM PDT USDCHF earlier today reached our target trend line. Support was at 0.9080 and price reached and tested this support trend line. Price is now bouncing off this support and we could see a major reversal unfolding. As we mentioned yesterday, breaking below the orange trend line would be an added bearish signal.
USDCHF is in a short-term bearish channel. Short-term has not changed to bullish yet despite the bounce from 0.9280. Price has resistance at 0.9162-0.9175. Bulls need to break above this level in order for short-term to change to bullish. A rejection at 0.9160 area will most probably bring price back towards 0.91-0.9080.
Blue lines - bearish channel USDCHF as we said above has reached the major support trend line coming from the lows of January 2021. Breaking below this trend line would be a medium-term bearish signal and sign of weakness. The material has been provided by InstaForex Company - www.instaforex.com |
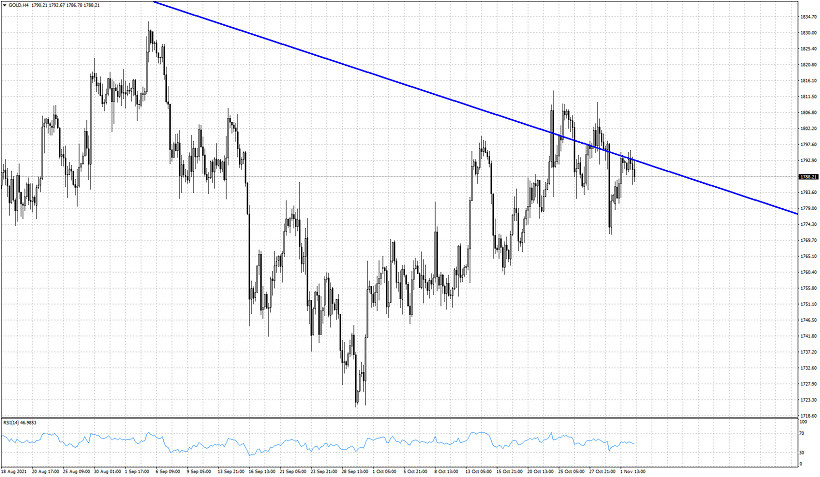
| Short-term technical analysis on Gold for November 2, 2021. Posted: 02 Nov 2021 10:24 AM PDT Gold price reached $1,795 earlier today but price is now back below $1,790. Short-term support at $1,788 remains intact but bulls need to be cautious. Price has formed a lower high after the sell off that brought price from $1,809 to $1,771 last week.
The time spent above the blue resistance trend line was short. Price action the last couple of sessions increases the chances that the break out above the blue resistance trend line was a false one. Price is making lower highs and lower lows after the high on October 22 at $1,813. Gold price is vulnerable to a move below $1,770 as long as price is below $1,810. I'm bearish Gold as long as price is below $1,810. The material has been provided by InstaForex Company - www.instaforex.com |
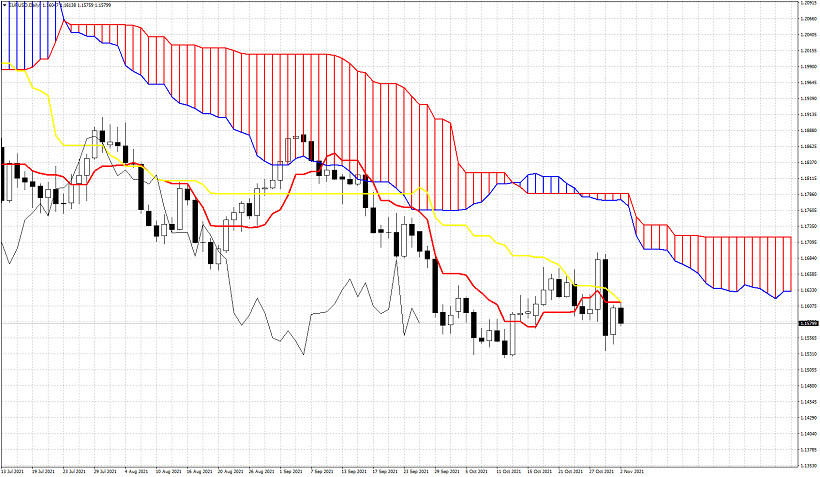
| Ichimoku cloud indicator analysis on EURUSD for November 2, 2021. Posted: 02 Nov 2021 10:20 AM PDT EURUSD reached as high as 1.1613 today and got rejected at the tenkan-sen indicator resistance. As we mentioned in our previous analysis using Ichimoku clouds, trend remains bearish as long as price is below the Kumo and any bounce is considered a selling opportunity. Price is now at 1.1581.
|
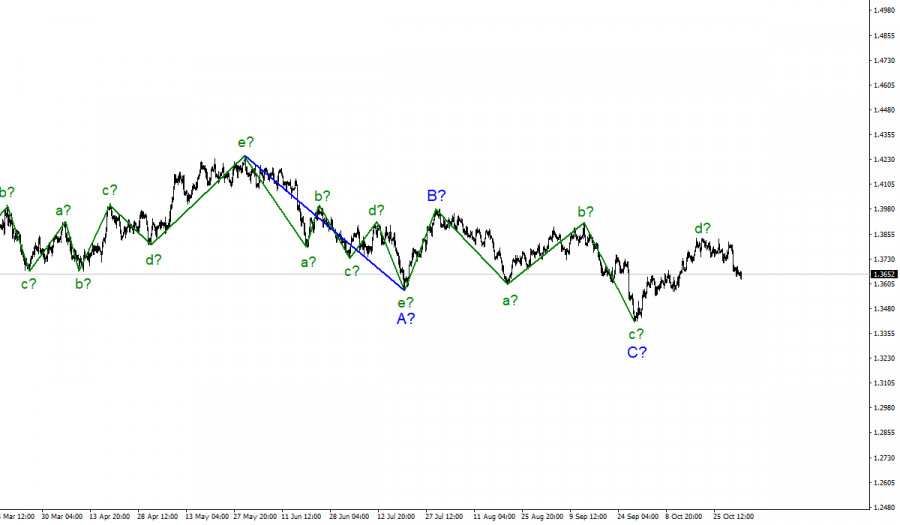
| Wave analysis of EUR/USD for November 2: US dollar declines ahead of Fed meeting Posted: 02 Nov 2021 09:56 AM PDT |
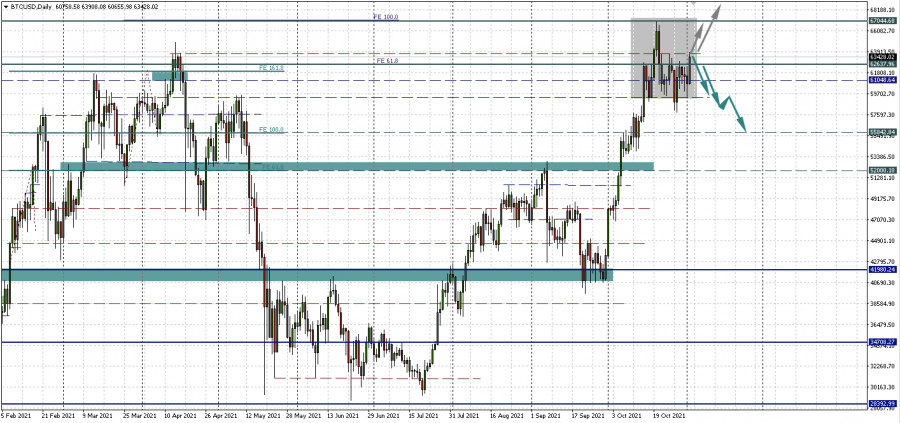
| Bitcoin: Encouraging Statistics and Technical Uncertainty Posted: 02 Nov 2021 08:57 AM PDT The approval of the Bitcoin ETF, as expected, has ushered in a record flow of institutional money into investment products based on the main cryptocurrency. The total value of bitcoin assets has reached $53 billion. Billion-dollar investment inflow into the crypto market - the result of UptoberOver the last week of October, institutional inflows into Bitcoin totaled $269 million. In general, during this period, the volume of investments in crypto products reached $288 million. And if we take into account the entire time of the bullish period, including before the appearance of funds, then the investments of institutions are measured in billions of dollars. Of all cryptocurrencies, investors choose bitcoinA recent report from CoinShares on Digital Asset Fund Flows highlights that Bitcoin remains the preferred choice for large institutional investments. In the first 10 months of 2021, BTC investment products received $6.3 billion. It should be noted that this is already 30% higher than in 2020. In terms of market capitalization, Bitcoin retains its dominant position and remains the preferred crypto asset for large market participants. And the total value of global crypto assets under management exceeded $78.7 billion last week. Bitcoin accounts for almost 70% of this volume. CoinShares Altcoin Demand StatisticsData from CoinShares shows that investors are choosing a single-line exposure strategy and are very interested in Bitcoin. In addition to BTC, other digital assets have been popular among institutional investors over the past week: Solana, Cardano, and Polkadot. The CoinShares report noted that the inflows of Solana, Cardano, and Polkadot amounted to $15 million, $5 million, and $6.2 million, respectively. And for investment products with several assets, the outflow of funds amounted to a record $23 million. Now we are talking about the third week of the outflow from altcoins. How to Interpret Institutional Inflow DataAs expected, it can be seen that bitcoin is in demand among large investors. On the one hand, the reason is inflation, which makes the assets of the traditional sector unprofitable. On the other hand, it is an indicator of prospects - institutions expect the main cryptocurrency to continue to rise. And if you look at it from a different angle, the demand from large organizations suggests that the market is maturing. This means that volatility is likely to decrease slightly. Institutional will not panic to sell coins with minimal price fluctuations, and in the event of rollbacks, they will most likely buy more at cheaper prices. Deep correction: canceled or not?Today, the consolidation of bitcoin in the range of 59,000 and 62,500 continues. BTCUSD is trading under the resistance at 62,637.96. Does this mean that the head and shoulders pattern has lost its relevance? It is hard to say. If the price breaks the level of 62,637.96 from the bottom up and even consolidates above it, it will be possible to say that the reversal is canceled and wait for growth to $67,000 and above. But if now the price turns sideways again, then, most likely, it will go to the support at 59,383.67, near which we will probably again talk about a possible deepening of the correction.
|
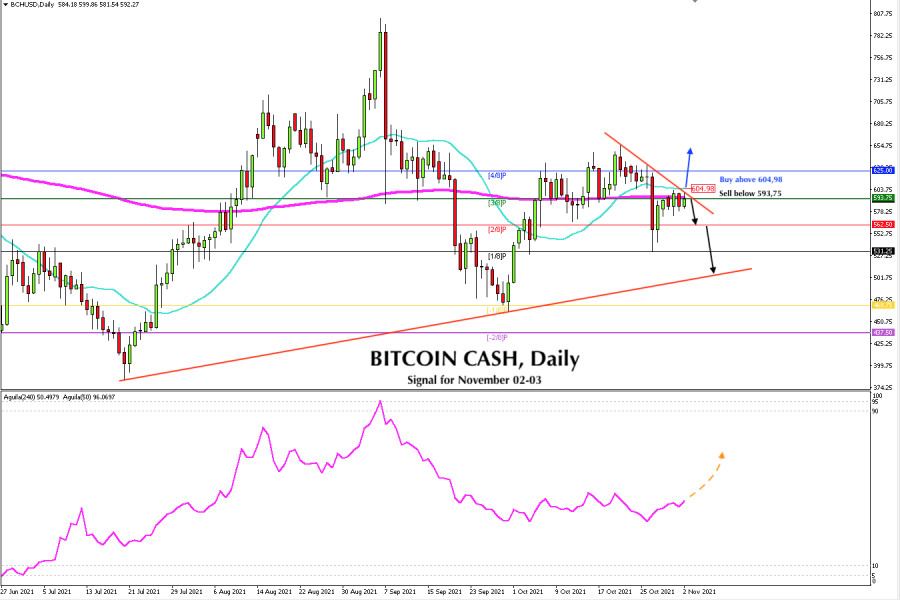
| Trading signal for Bitcoin Cash (BCH) on November 02 - 03, 2021: sell below $593,75 (EMA 200) Posted: 02 Nov 2021 08:39 AM PDT
On the daily chart, Bitcoin Cash (BCH) is trading below the 200-day moving average and below the 21 SMA. Please be aware that a bearish pressure line is projected from October 21 and the BCH has not been able to break it more than 3 times. As long as the crypto remains below 604.98, we expect a bearish move to 2/8 of a murray. BCH could fall to the psychological level of 500 which coincides with the uptrend channel formed since July 20. On October 27, BCH fell to the 1/8 murray support around 531.25. After this point, it managed to bounce back to the 200 EMA level. It has been testing this zone for more than 5 days, trying to consolidate above, but with no success. This level has now become strong resistance for Bitcoin cash, a daily close above this 20-day average could be the beginning of a new bullish scenario with targets at 656 (5/8) and up to 687 (6/8). If in the coming days, BCH consolidates above the 21 SMA and 200 EMA, this would mean that long-term investors have probably taken advantage of the drop to accumulate. It would give BCH strong bullish momentum and push it towards its annual high of 1639. Our trading plan is to continue selling below 593, where the EMA of 200 is located. Our targets will be 562 and 531. On the other hand, if in the next few days BCH consolidates above 604, we should avoid selling. Therefore, we should wait for the buy signal with targets at 625 and 654. The eagle indicator is showing a slightly bullish signal. We could confirm this signal when BCH breaks the level of 604, then it will be an opportunity to buy. Support and Resistance Levels for November 02 - 03, 2021 Resistance (3) 625,00 Resistance (2) 608,33 Resistance (1) 596,16 ---------------------------- Support (1) 566,29 Support (2) 554,12 Support (3) 543,61 *********************************************************** A trading tip for Bitcoin Cash for November 02 - 03, 2021 Sell below 593,75 (EMA 200) with take profit at 562,50 (2/8) and 531,25 (1/8), stop loss above 604,50. The material has been provided by InstaForex Company - www.instaforex.com |
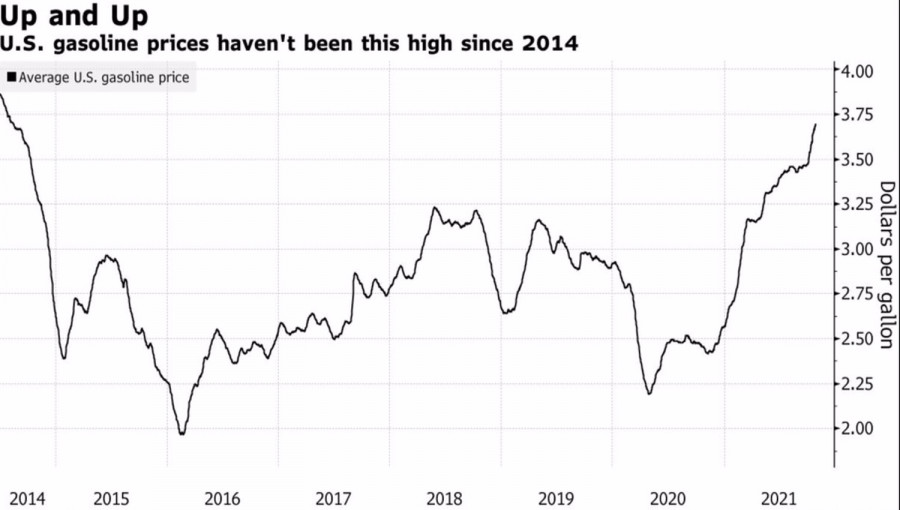
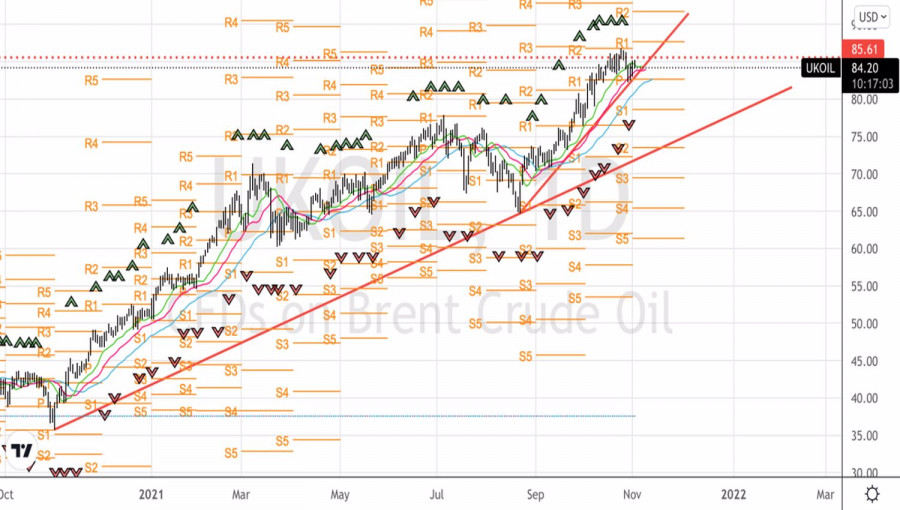
| Oil refuses to follow the White House Posted: 02 Nov 2021 08:38 AM PDT Global demand is healthy, and supply is trying to catch up. But so far, it is not doing well. Unsurprisingly, oil prices, after a slight pullback, are trying to return to 7-year highs. And $85-86 per barrel for the North Sea variety is still in the bud. Bank of America predicts that prices will reach $120 by the end of June 2022. According to British Petroleum (BP), global demand for oil has returned to the pre-pandemic level of 100 million b/d. The multinational oil and gas company believes that the moment is near when the indicator will exceed the levels that took place before COVID-19, and OPEC+ is effectively managing the market. Therefore, BP remains constructive about oil prices. Indeed, if the Alliance continues to stick to its plan to increase production by a modest 400,000 b/d, supply will find it extremely difficult to keep up with demand. And the oil-importing countries will not like this circumstance. First of all, we are talking about the United States after President Joe Biden criticized the OPEC+ policy, calling it wrong. If Saudi Arabia, Russia, and other countries are not going to pump more oil so that people can use gasoline on the way to and from work, then this is wrong. It is obvious that the continuous growth of Brent and WTI leads to an increase in the cost of gasoline, costs for it on the part of households, which reduces the amount of money spent on other purposes. As a result, the GDP slows down. Gasoline price dynamics
Despite calls from the White House, the Alliance is not going to follow its lead. Bloomberg experts believe that OPEC+ is going to adhere to the previous course, especially since Russia, Iraq, Angola, Algeria, Nigeria, and Kuwait have already stated that there is no need to deviate from previously approved plans. Even the US dollar cannot stop the bulls on Brent and WTI. Since oil is quoted in the US currency, an increase in the USD index should contribute to its decline. However, the gap in the rate of recovery between supply and demand is so large that this scheme does not work. Expectations of a $120 billion QE tapering at the November FOMC meeting, as well as market belief in a federal funds rate hike twice in 2022, pushed the dollar index to 14-month highs. Because of this, oil is in no hurry to fall. Thus, if we proceed from the assumptions that the growth in oil demand will increase as winter approaches, including due to the replacement of very expensive gas with oil products, and the supply will remain the same, then the price of $120 per barrel for the North Sea grade does not look like anything unreal. Technically, as suggested in the previous material, the achievement of the target by the Wolfe Waves pattern on the weekly chart led to a pullback. At the same time, the rebound from the dynamic resistance in the form of moving averages on the daily time frame made it possible to form long positions. The targets for them are the pivot levels of $89.7, $92.6, as well as the previously identified mark of $102 per barrel. The recommendation is to keep longs and increase them periodically. Brent, Daily chart
|
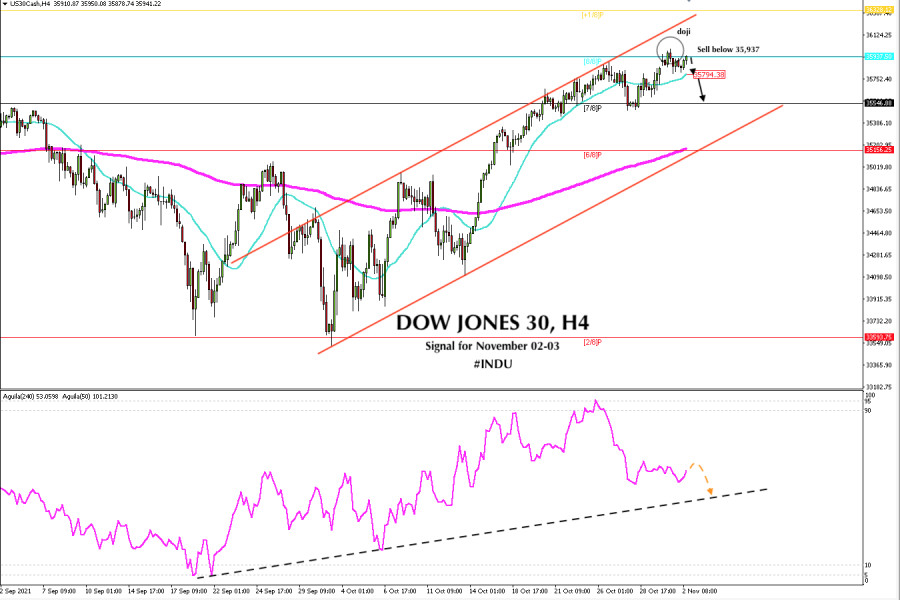
| Trading signal for DOW JONES 30 (#INDU) on November 02 - 03, 2021: sell below 35,937 (8/8) Posted: 02 Nov 2021 07:58 AM PDT
The Dow Jones 30 industrial index, in the morning of the American session is rising little by little approaching its historical maximum of 36,000 at this time it is trading 35,937, around 8/8 of a murray, this is a level of strong resistance and below this zone downward pressure is likely to build and there could be a correction to the 21 SMA around 35.794. On November 3, the FED will announce its monetary policy update. The central bank is expected to launch a reduction in the monthly bond purchase program of 120,000 billion. This amount will gradually be reduced in the coming months. This could benefit the dollar and will give weakness in the key stock indices such as the Dow Jones 30, as investors will take refuge in the dollar for the aversion to risk. According to the 4-hour chart, the main trend is still bullish for the Dow Jones. As long as it remains above the average of 21 (35,794), there will always be a possibility of a further to rise towards its next target at 36,328. There is the +1/8 from murray representing extremely overbought levels. On the other hand, we believe that as long as the index is trading below 8/8 murray, there could be a technical correction. Additionally, if the Dow Jones consolidates below the 21 SMA, it could reinforce a bearish movement and we could expect a drop to 35,546 which is 7/8 of murray that has become strong support. Since October 21, the Eagle indicator has been generating a bearish signal. It is likely that the volume and market strength is also decreasing. However, ithe index has not lost its main uptrend yet. We expect a correction movement until the price reaches the bottom of the channel. This could give the Dow Jones a bullish boost and a technical bounce might occur around 35,546, suggesting a buying opportunity again. Our trading plan is to catch selling opportunities as long as the index remains below 8/8 of murray. We could set the targets at about 35,794. If this level is broken, the next target will be 35,546. If the downward pressure persists, we could expect a fall to the bottom of the uptrend channel around 35,156 which also coincides with the 200 EMA. Support and Resistance Levels for November 02 - 03, 2021 Resistance (3) 36,215 Resistance (2) 36,110 Resistance (1) 35,991 ---------------------------- Support (1) 35,797 Support (2) 35,692 Support (3) 35,592 *********************************************************** A trading tip for DOW JONES 30 for November 02 - 03, 2021 Sell below 35,937 (8/8) with take profit at 35,794 (SMA 21) and 35,546 (7/8), stop loss above 36,000. The material has been provided by InstaForex Company - www.instaforex.com |


| You are subscribed to email updates from Forex analysis review. To stop receiving these emails, you may unsubscribe now. | Email delivery powered by Google |
| Google, 1600 Amphitheatre Parkway, Mountain View, CA 94043, United States | |


Comments