Forex analysis review
Forex analysis review |
- Forecast for EUR/USD on November 11, 2021
- Forecast for GBP/USD on November 11, 2021
- Forecast for AUD/USD on November 11, 2021
- AUDUSD is approaching Pivot, potential for bounce! | 11 Nov 2021
- Forecast for USD/JPY on November 11, 2021
- USDCHF bullish momentum | 11th Nov 2021
- USDCAD bearish drop | 11th Nov 2021
- How to trade GBP/USD on November 11? Simple tips for beginners. The pound fell similarly to the euro currency
- USD/CAD further growth confirmed
- Will the SPX end the year with a bull run?
- Now what for TSLA?
- USDCHF breaks out of bearish channel.
- XRPUSD remains strong above broken key resistance of $1.24.
- EURUSD fails to hold above short-term support
- Inverted head and shoulders pattern activated in Gold.
- How to trade EUR/USD on November 11. Simple trading tips for beginners. USD rises considerably as US inflation accelerates.
- Gold melting down despite US higher inflation
- EUR/USD: Greenback's Comeback: U.S. Inflation Hits Records Again
- Bitcoin: $100,000 this year, $250,000 next year, $1,000,000 key target by 2025
- Bitcoin Shows Signs of Reasonable Accumulation
- GBP/USD analysis on November 10. The pound steadfastly withstood the blow in the form of strong inflation in the United States
- EUR/USD analysis on November 10
- Falling Bitcoin and exhausted Shiba Inu: is the cryptocurrency market tired of records?
- Bitcoin soars to $69,000: what caused the bullish rally and what do BTC technical indicators say?
- EUR/USD towards fresh new lows post US inflation figures
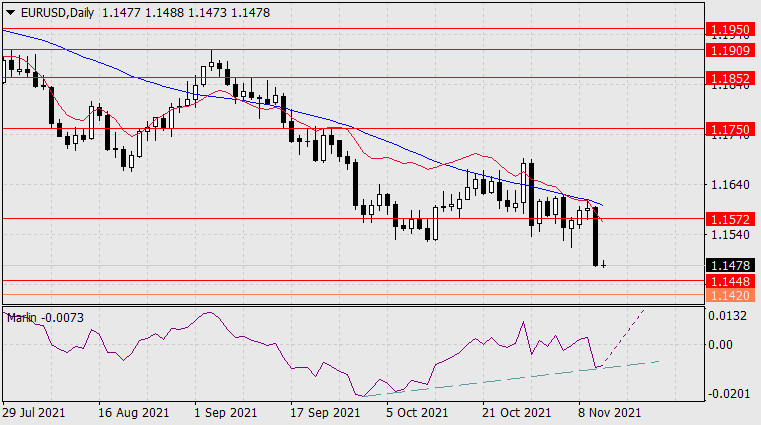
| Forecast for EUR/USD on November 11, 2021 Posted: 10 Nov 2021 08:24 PM PST The euro fell by 113 points yesterday, which confirmed the variant with the formation of convergence before, as expected, a reversal into medium-term growth. The target of the movement is the 1.1448 level - the high on March 17, 2019. The price may move below the level, for example, to 1.1420, this is the level of the peaks of June 2020 and June 2019.
Of course, the strengthening of the dollar across the market was associated with a strong increase in the CPI in October estimates to 6.2% (forecast 5.8%), but the Federal Reserve needs to get data on the real sector to change its sentiment, and such data as retail sales, growth industrial production, the volume of civil construction will be next week. Investors also need this data, and therefore, after yesterday's rally, they can take a break.
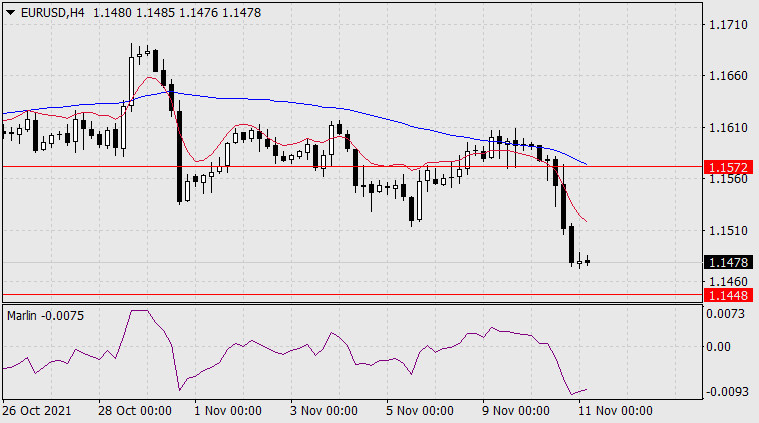
On the four-hour scale, the price settled under the balance and MACD indicator lines, the Marlin Oscillator has already deeply entered the downtrend zone, so we expect the decline to slow down. We are waiting for the formation of technical reversal signs. The material has been provided by InstaForex Company - www.instaforex.com |
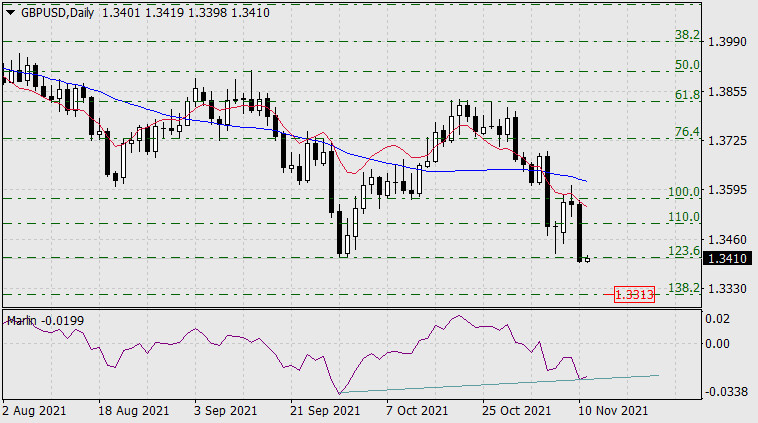
| Forecast for GBP/USD on November 11, 2021 Posted: 10 Nov 2021 08:17 PM PST The British pound fell by one and a half figures yesterday, reaching the Fibonacci level of 123.6% with the formation of convergence with the Marlin Oscillator. But more precisely, the convergence has not yet formed, only the conditions of its probable formation have been fulfilled, in order to return the price to the initial levels in the area of the Fibonacci level of 100.0%. The price may still continue to decline and reach the next level of 138.2% at the price of 1.3313.
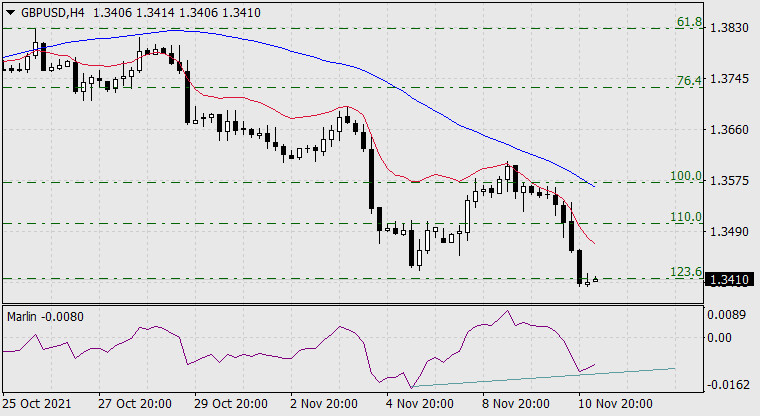
On the four-hour chart, the convergence of the price with the oscillator is also ready to form. This circumstance tilts the probability of a price reversal up from approximately current levels to 60%. But you need to wait at least a day for the market to cool down and give clearer indications of its intentions.
|
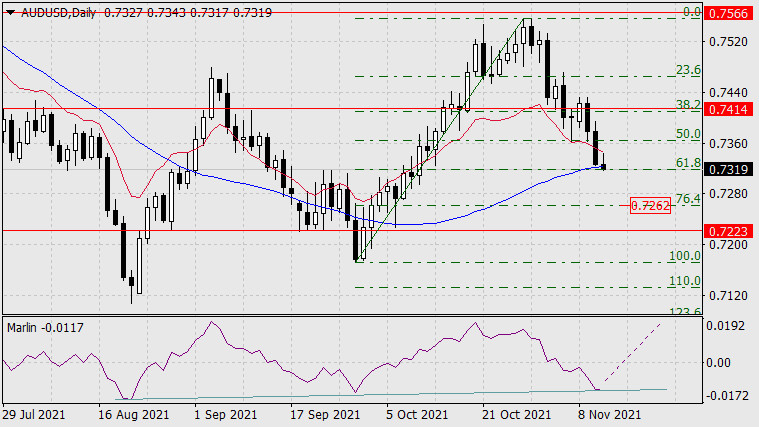
| Forecast for AUD/USD on November 11, 2021 Posted: 10 Nov 2021 08:12 PM PST On Wednesday, the Australian dollar continued its downward movement towards the target set by the MACD line - 0.7325. This target almost coincides with the 61.8% retracement level of the September 29 to October 28 move, and this Fibonacci level was reached this morning.
Double convergence has been formed, now the most interesting moment has come - will the price reverse exactly from the levels or will it slightly go under them? In the event of a reversal, growth without strong corrections is presented to the target level of 0.7566 - to the lows of February 2 and March 25, 2021. Consolidation below the Fibonacci level may lead to a movement to the 76.4% retracement level at 0.7262.
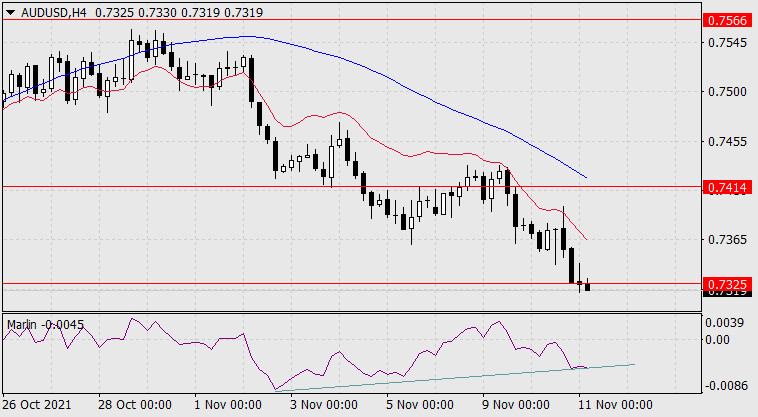
On the four-hour chart, the double convergence is ready. If, however, the price continues to decline, it can be re-formed into the usual one, or it can be abolished in a natural way, therefore, on a given time scale, convergence can be neglected. The main scenario is reversal. The material has been provided by InstaForex Company - www.instaforex.com |
| AUDUSD is approaching Pivot, potential for bounce! | 11 Nov 2021 Posted: 10 Nov 2021 08:11 PM PST
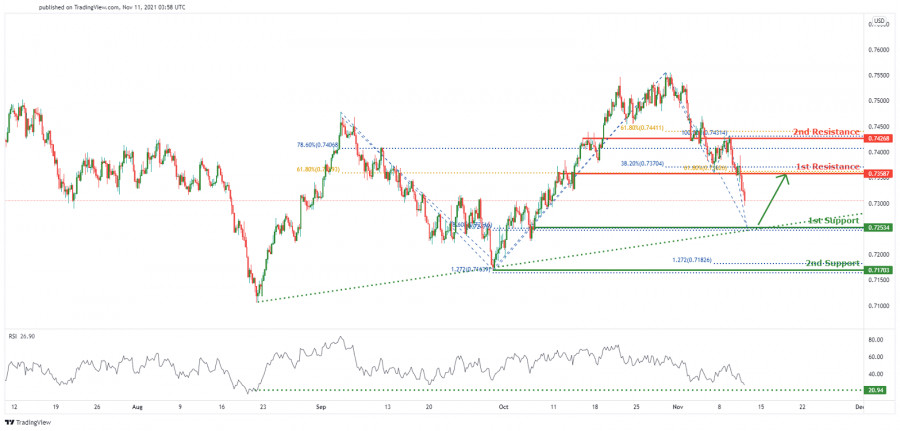
Price is on a bullish momentum forming a potential bullish trendline. We see potential for a bounce from our 1st support at 0.72534 in line with 78.6% Fibonacci retracement ascending trendline and graphical swing low towards our 1st resistance at 0.73587 in line with 38.2%,61.8% and 61.8% Fibonacci retracement. Alternatively, our stop loss will be placed at 2nd support at 0.71703 in line with 127.2% Fibonacci extensions and graphical swing low. RSI is approaching levels where bounces occurred previously. Trading Recommendation Entry: 1.1617 Reason for Entry: 78.6% Fibonacci retracement and 78.6% Fibonacci retracement Take Profit: 1.15413 Reason for Take Profit: Horizontal swing low and 61.8% Fibonacci extension, 61.8% Fibonacci Retracement Stop Loss: 1.16509 Reason for Stop Loss: 127.2% Fibonacci extension The material has been provided by InstaForex Company - www.instaforex.com |
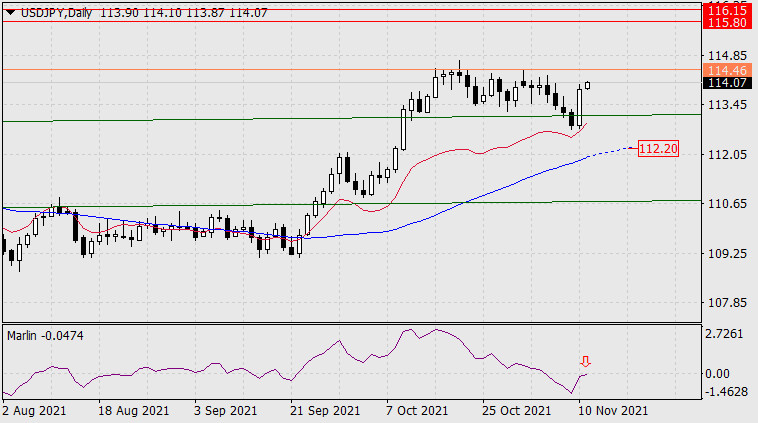
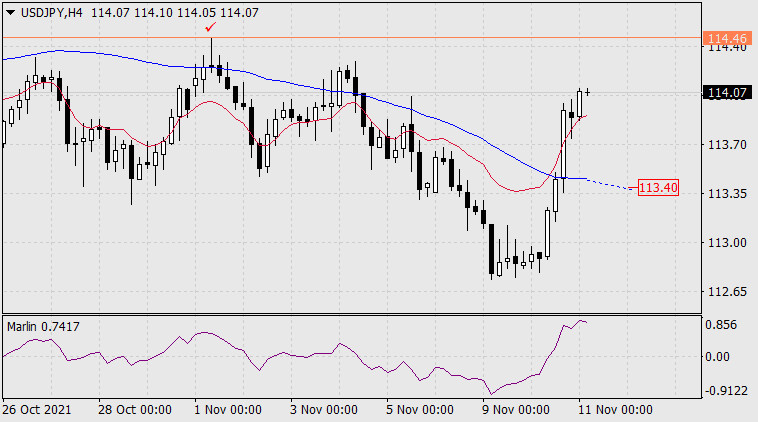
| Forecast for USD/JPY on November 11, 2021 Posted: 10 Nov 2021 08:02 PM PST Due to yesterday's growth of the dollar index by 0.98%, the USD/JPY pair rose by 103 points and is visually ready to continue moving to the previously set target range of 115.80-116.15. But the signal will take place only when the price breaks above the high on November 1 at 114.46.
If this does not happen, then the price will restore the downward trend in order to reach the MACD line (approximately at around 112.20). The signal line of the Marlin Oscillator has not yet left the bears' territory, it may be turning downwards from the zero neutral line.
On the four-hour chart, the price has settled above both indicator lines - the balance line (red) and the MACD line (blue), the Marlin Oscillator is in the growth zone. There are no formal reversal signs here, but the leading time frame at the moment is the daily one, so we are waiting for the development of events. The material has been provided by InstaForex Company - www.instaforex.com |
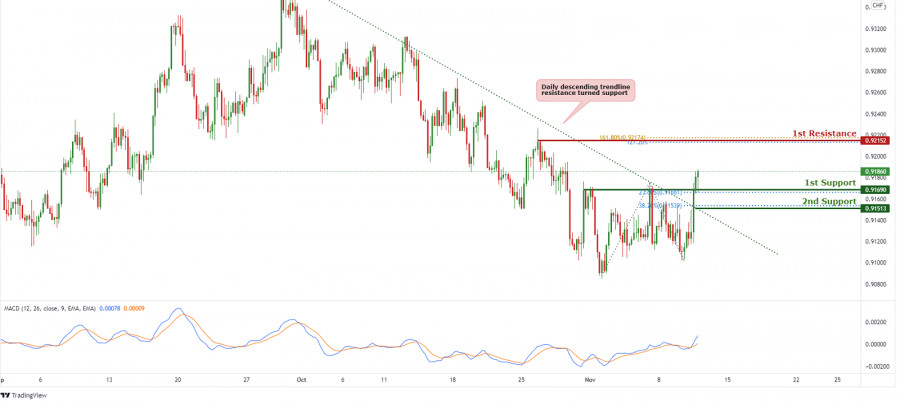
| USDCHF bullish momentum | 11th Nov 2021 Posted: 10 Nov 2021 07:59 PM PST
On the H4 timeframe, we can see that prices have broken out of the descending trendline resistance, signifying a bullish momentum. We can expect price to bounce from 1st Support in line with 23.6% Fibonacci retracement towards 1st Resistance in line with 127.2% Fibonacci projection and 161.8% Fibonacci retracement. Our bullish bias is further supported by the MACD indicator where the MACD line crosses above the signal line. Trading Recommendation Entry: 0.91690 Reason for Entry: 23.6% Fibonacci retracement Take Profit: 0.92152 Reason for Take Profit: 127.2% Fibonacci projection and 161.8% Fibonacci retracement Stop Loss: 0.91513 Reason for Stop Loss: 38.2% Fibonacci retracement The material has been provided by InstaForex Company - www.instaforex.com |
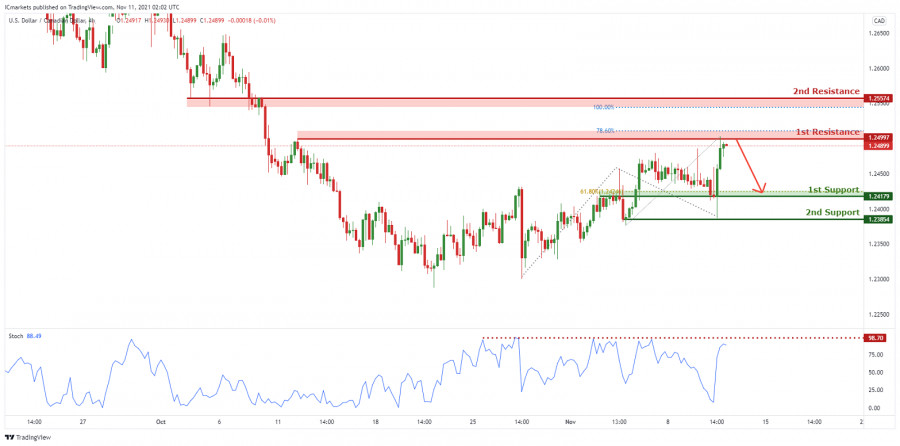
| USDCAD bearish drop | 11th Nov 2021 Posted: 10 Nov 2021 07:57 PM PST
On the H4, with price approaching resistance on the stochastics indicator, we have a bearish bias that price will rise from 1st resistance at 1.24997 in line with the 78.6% Fibonacci projection level and the horizontal swing high resistance to 1st support at 1.24179 in line with the graphical swing overlap support and 61.8% Fibonacci retracement and possibly to 2nd support at 1.23854 in line with the horizontal swing low support. Alternatively, we may see price break 1st resistance structure and head for 2nd resistance at 1.25574 in line with the 100% Fibonacci projection level and horizontal overlap resistance. Trading Recommendation Entry: 1.24997 Reason for Entry: 78.6% Fibonacci projection level and the horizontal swing high resistance Take Profit: 1.24179 Reason for Take Profit: graphical swing overlap support and 61.8% Fibonacci retracement Stop Loss:1.25574 Reason for Stop Loss: 100% Fibonacci projection level and horizontal overlap resistance. The material has been provided by InstaForex Company - www.instaforex.com |
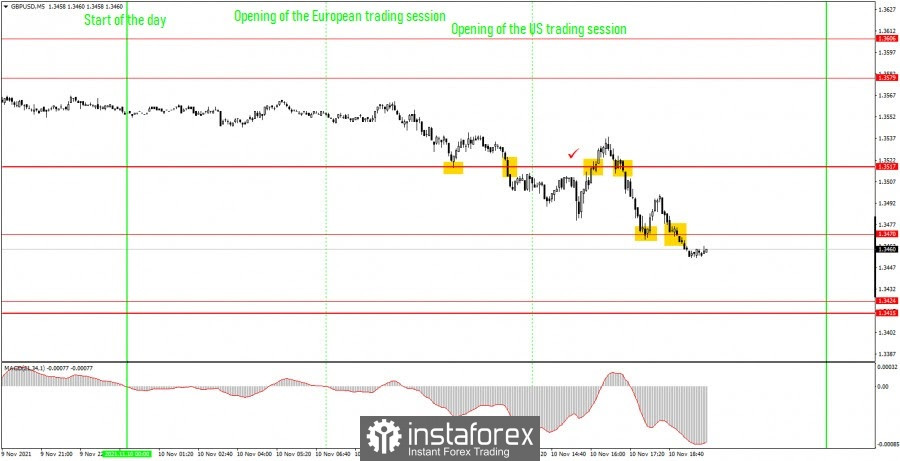
| Posted: 10 Nov 2021 01:13 PM PST Analysis of previous deals: 30M chart of the GBP/USD pair
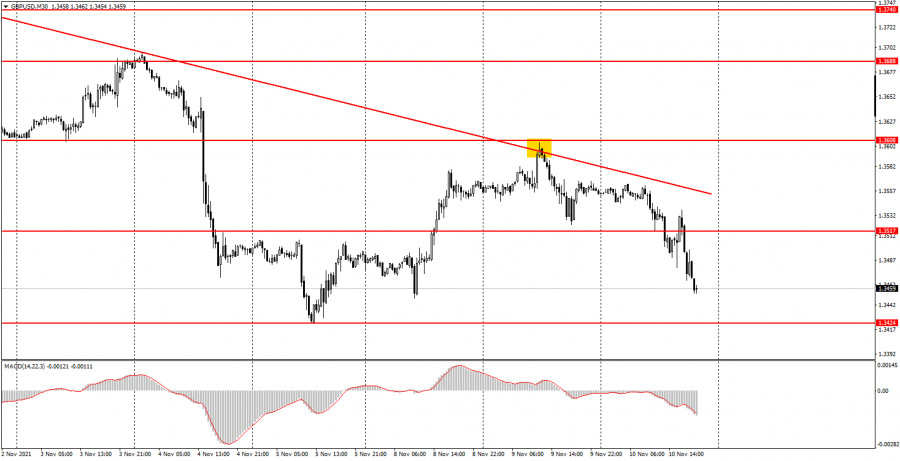
The GBP/USD pair fell on the 30-minute timeframe on Wednesday, November 10. Moreover, the downward movement began early in the morning, when 6 hours remained before the publication of US inflation. However, as in the case of the euro currency, traders began to buy the US currency in advance, anticipating that a surprise awaited them in the afternoon. After it became known about the acceleration of inflation to 6.2%, the dollar rose by 90 points, and in the first half of the day it added 50. Thus, the overall volatility of the day was about 140 points, which is a lot even for the pound. But, on the other hand, this is only good for us, so such movements gave hope for many strong and profitable trading signals. On the 30-minute timeframe today, the price did not reach the trend line, just a few points. And if there was a rebound, then beginners would receive the strongest sell signal. The downward trend continues at this time, and the pair fell to its annual lows around 1.3424. And all because of one report... 5M chart of the GBP/USD pair
On the 5-minute timeframe, not so many trading signals were generated today as might have been expected. On closer inspection, the movements of the pair themselves can hardly be called successful or good. Signals were formed today only about two levels and each strong signal was preceded by one or more false signals. This alignment is very unfortunate for traders, but let's see how you should trade today. The first buy signal was generated when the price bounced off the 1.3517 level. The pair went up after that only 16 points and consolidated below the level of 1.3517. Thus, a new sell signal was formed, which also turned out to be false, since the price went down only 23 points after it. The most interesting thing is that the third signal also turned out to be false, but it, like the fourth signal near the level of 1.3517, should not have been worked out. Thus, according to the first two signals, a loss of 13 points was obtained (on the second trade, Stop Loss was triggered at breakeven). As a result, traders got two more signals near the level of 1.3470. The first, as expected, turned out to be false - the price bounced off the level of 1.3470 - long positions - a loss of 20 points. The last sell signal turned out to be profitable, as the price dropped to the next level of 1.3424, allowing 40-50 pips to be earned. Therefore, the day ended with minimal gains. How to trade on Thursday: At this time, the downward trend continues on the 30-minute timeframe. Now we need to understand whether the pair will be able to overcome the level of 1.3424, from which it rebounded last time. If yes, then the movement to the South will continue, if not, then a new round of upward correction will begin. On the 5-minute timeframe, the important levels are 1.3415-1.3420, 1.3470, 1.3517. We recommend trading on them on Thursday. The price can bounce off them or overcome them. As before, we set Take Profit at a distance of 40-50 points. At 5M TF, you can use all the nearest levels as targets, but then you need to take profit, taking into account the strength of the movement. When passing 20 points in the right direction, we recommend setting Stop Loss to breakeven. On November 11, novice traders should pay attention to the UK third quarter GDP report. There will be an even more or less interesting report on industrial production, but, most likely, the markets will only work out the first indicator. Basic rules of the trading system: 1) The signal strength is calculated by the time it took to form the signal (bounce or overcome the level). The less time it took, the stronger the signal. 2) If two or more deals were opened near a certain level based on false signals (which did not trigger Take Profit or the nearest target level), then all subsequent signals from this level should be ignored. 3) In a flat, any pair can form a lot of false signals or not form them at all. But in any case, at the first signs of a flat, it is better to stop trading. 4) Trade deals are opened in the time period between the beginning of the European session and until the middle of the US one, when all deals must be closed manually. 5) On the 30-minute TF, using signals from the MACD indicator, you can trade only if there is good volatility and a trend, which is confirmed by a trend line or a trend channel. 6) If two levels are located too close to each other (from 5 to 15 points), then they should be considered as an area of support or resistance. On the chart: Support and Resistance Levels are the Levels that serve as targets when buying or selling the pair. You can place Take Profit near these levels. Red lines are the channels or trend lines that display the current trend and show in which direction it is better to trade now. The MACD indicator consists of a histogram and a signal line. When they cross, this is a signal to enter the market. It is recommended to use this indicator in combination with trend lines (channels and trend lines). Important speeches and reports (always contained in the news calendar) can greatly influence the movement of a currency pair. Therefore, during their exit, it is recommended to trade as carefully as possible or exit the market in order to avoid a sharp price reversal against the previous movement. Beginners on Forex should remember that not every single trade has to be profitable. The development of a clear strategy and money management are the key to success in trading over a long period of time. The material has been provided by InstaForex Company - www.instaforex.com |
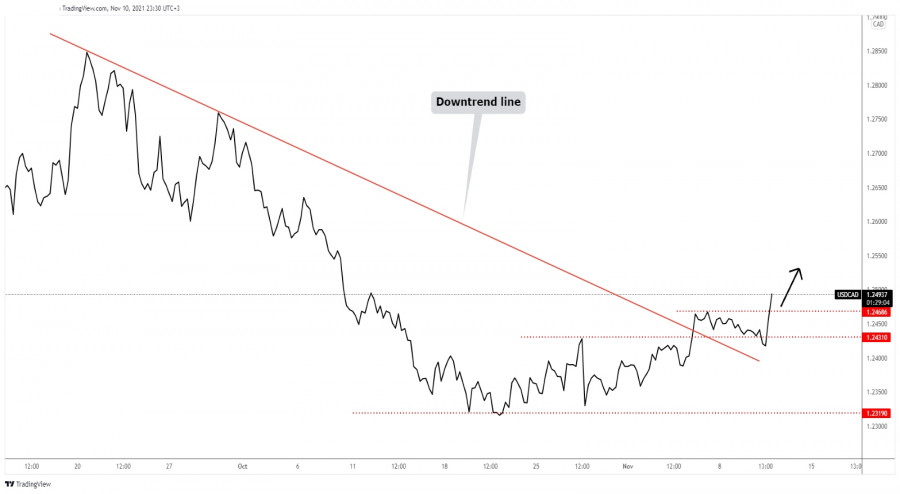
| USD/CAD further growth confirmed Posted: 10 Nov 2021 12:46 PM PST
USD/CAD Aggressive Upside MovementThe USD/CAD pair registered a strong upward movement after ending its temporary decline. As I have mentioned in my previous analysis, the currency pair could climb higher towards fresh new highs and the decline could be only a temporary one. The price failed to reach and retest the downtrend line, thus signaling strong upside pressure. Now it has jumped above the 1.2468 former high, confirming potential further growth. USD/CAD Trading ConclusionThe current aggressive breakout through 1.2468 validates an upside continuation and helps buyers place new buying positions. Still, in the short term, USD/CAD could slip lower, it could come back to test and retest the 1.2468 level before resuming its upwards movement towards fresh new highs. The material has been provided by InstaForex Company - www.instaforex.com |
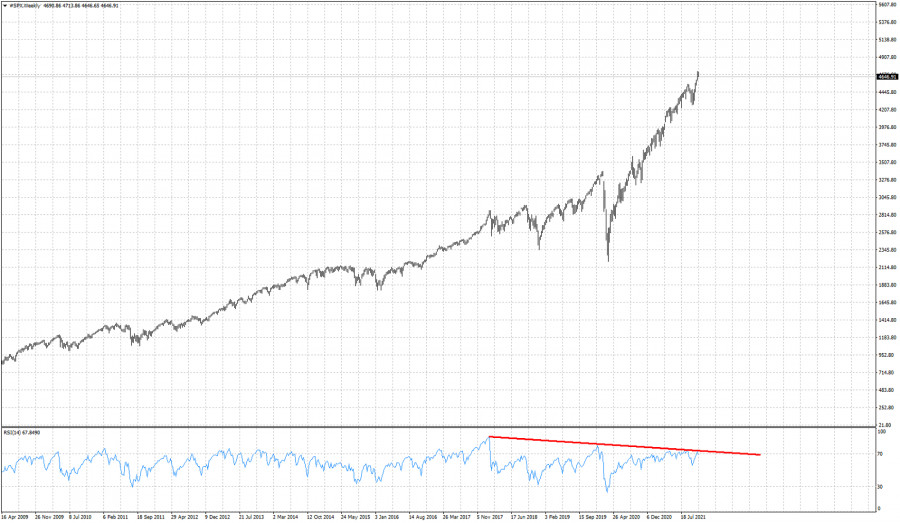
| Will the SPX end the year with a bull run? Posted: 10 Nov 2021 11:38 AM PST I believe it is highly unlikely to end the year with a continued bull run. The bullish run since last year February has been overly extended and it is time for a correction. On a weekly basis SPX remains in a bullish trend making higher highs and higher lows, however the RSI is providing another bearish divergence signal increasing the chances of a reversal.
Red line - bearish divergence The RSI is warning bulls that the up trend is weakening. A 100 point decline is highly anticipated and this is the minimum of a pull back that we expect. If price turns over and starts the decline, our target would be 3750 where we find the 38% Fibonacci retracement of the entire upward movement that started in the first quarter of 2020. The current new high was accompanied by 3 lower highs and now the RSI is turning below 70, increasing the chances of a pull back. For me its not a matter of when, it is a matter of how big a pull back will be. Bulls need to be very cautious. The material has been provided by InstaForex Company - www.instaforex.com |
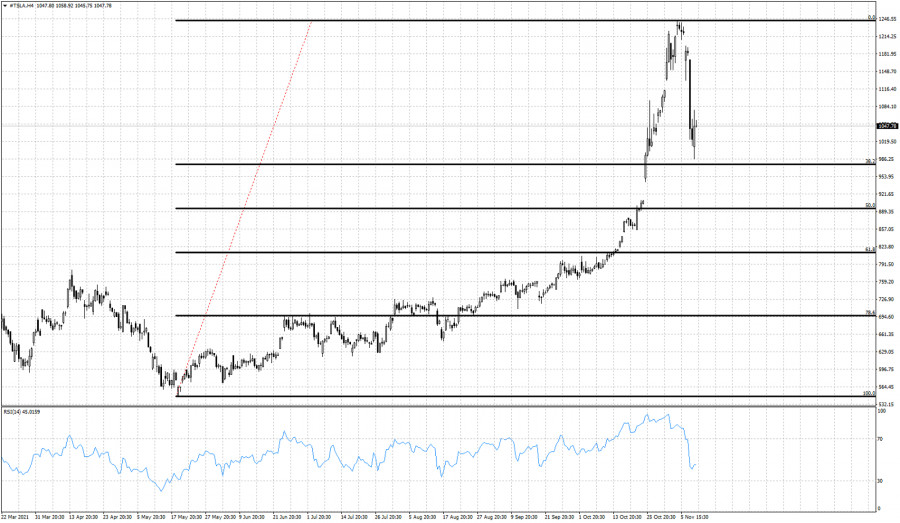
| Posted: 10 Nov 2021 11:31 AM PST In our previous analysis on TSLA stock price I noted it was time to stop being bullish and at least turn neutral. Price has since then pulled back towards $1,000 where we had our target area of $1,000 and $970.
TSLA stock price has already reached our downside pull back target. Price will find support at current levels at the 38% Fibonacci level of the decline. This does not rule out a shallow bounce and a new lower low. Trend is bearish and so far we consider each bounce as a selling opportunity. We continue to prefer to avoid this stock. The material has been provided by InstaForex Company - www.instaforex.com |
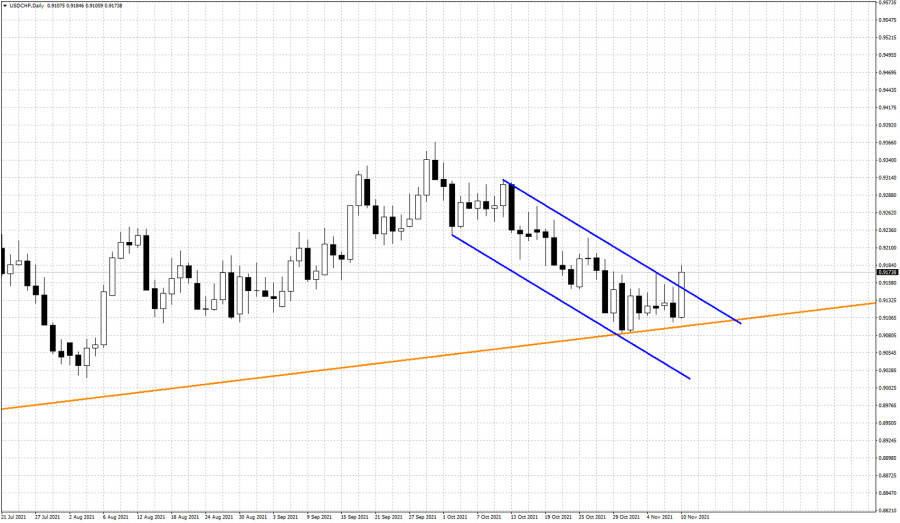
| USDCHF breaks out of bearish channel. Posted: 10 Nov 2021 11:25 AM PST USDCHF has finally broken above the key resistance at 0.9150. After the fourth attempt, resistance at 0.9150, where we find the bearish channel boundary was broken. USDCHF continues to respect our key support and trend change level at 0.9080-0.91.
Orange line - support trend line After three consecutive days where bulls tried to break the channel to the upside, bears could not withstand the strength of the bulls and price is breaking above the channel. This price action marks the end of the downward movement from 0.9365. Price has held the long-term orange trend line support. All signs indicate a trend change so we remain bullish USDCHF. The material has been provided by InstaForex Company - www.instaforex.com |
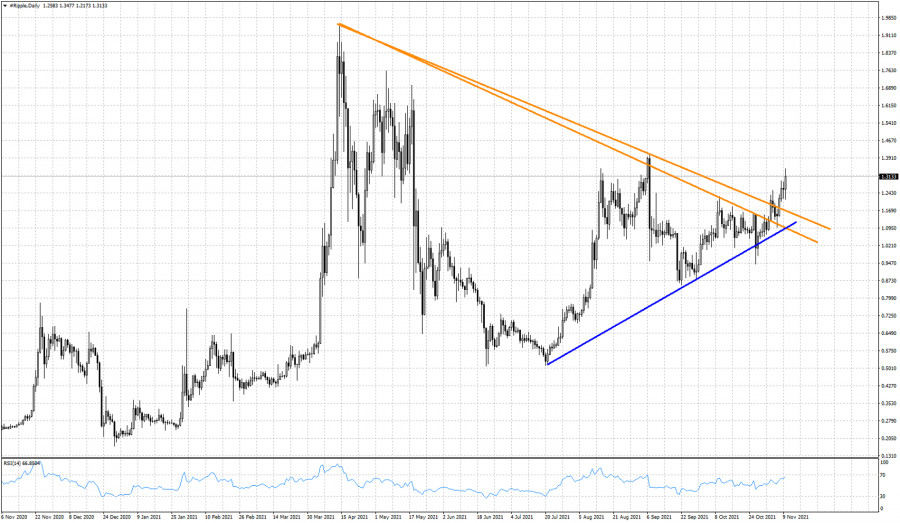
| XRPUSD remains strong above broken key resistance of $1.24. Posted: 10 Nov 2021 11:19 AM PST As we mentioned in previous posts, XRPUSD broke the important long-term resistance trend line and has produced a bullish signal. XRPUSD was trading below the $1.13-$1.24 resistance and now is above it.
Blue line - support trend line XRPUSD continues to respect the blue upward sloping support trend line and continues making higher highs and higher lows. As we mentioned before, a break above $1.24 would give us $1,45-$1.50 as our first target area. Now we find support at the blue trend line at $1.10-$1.15. If the atmosphere around cryptocurrencies remains bullish, then xrpusd might make new all time highs this year. Still too early to tell, but we remain bullish. The material has been provided by InstaForex Company - www.instaforex.com |
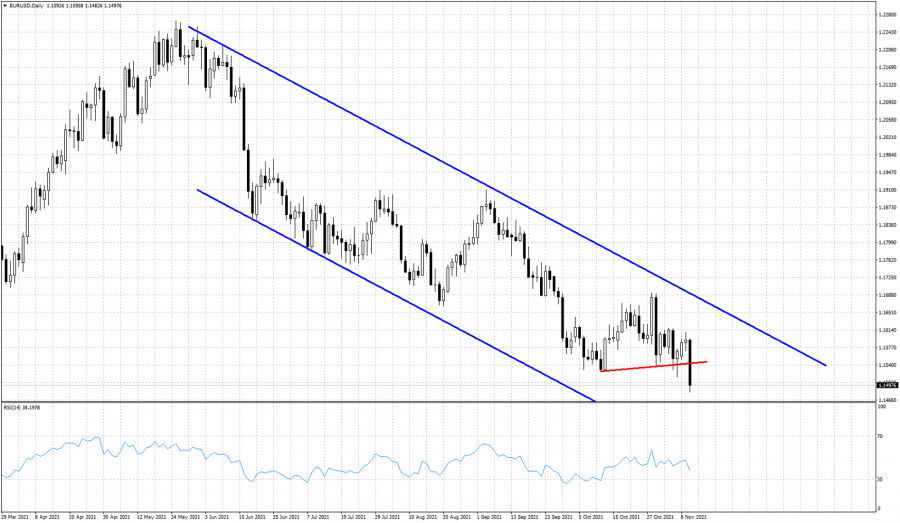
| EURUSD fails to hold above short-term support Posted: 10 Nov 2021 11:15 AM PST EURUSD today broke below 1.1535 and has provided us another bearish signal. Price remains trapped inside the bearish channel and with price breaking below 1.1535, we remain bearish expecting price to move below 1.14.
Red line -support EURUSD is making new lower lows. Trend is clearly bearish. Resistance is at 1.16 and next and most important level is at 1.17. As long as price is inside this blue downward sloping channel, bears will remain in control of the trend. Despite making a new lower low, the RSI value is not making new lows providing us with a bullish divergence. Bullish divergence signals are only warning signals and not reversal signals. We remain bearish as long as price is below 1.17, looking for a move towards 1.13-1.12. The material has been provided by InstaForex Company - www.instaforex.com |
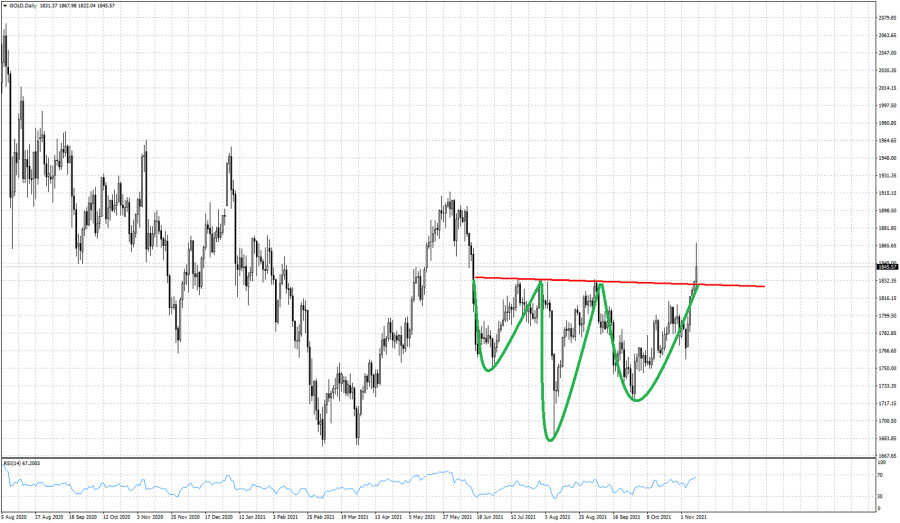
| Inverted head and shoulders pattern activated in Gold. Posted: 10 Nov 2021 11:11 AM PST Gold price yesterday break above the neckline resistance at $1,825. As we mentioned in our past analysis, this would trigger a bullish signal that would have as a final target the $1,950. Gold price today is showing some follow through strength after yesterday's signal.
Green lines- Inverted head and shoulders pattern Gold price today reached $1,867 but is now trading just below $1,850. Gold price is in a bullish trend showing major reversal signals. Support is at previous resistance at $1,825. Gold price has major support at $1,758. I expect Gold price to continue higher over the coming weeks, specially if Gold bulls manage to recapture $1,860 and stay above it. This would be an added sign of strength. The material has been provided by InstaForex Company - www.instaforex.com |
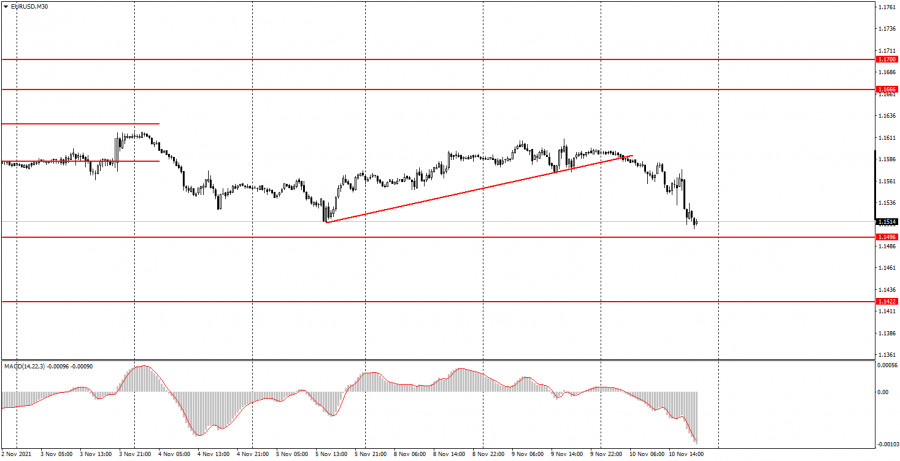
| Posted: 10 Nov 2021 10:15 AM PST Analyzing Wednesday's trades EUR/USD on M30 chart
EUR/USD faced a steep decline on Wednesday. The downward movement started at night, and there is a reason for this. A key report on US inflation was expected on Wednesday, being the only important event of the day. In addition, all market participants are now focused on inflation data as it is a crucial indicator for the American economy and financial markets. Thus, when it turned out that the consumer price index rose to 6.2% in October, while the reading was estimated to stand at 5.8%, the US currency began to rise. Actually, the dollar continued its growth that was initiated earlier at night. We assume that traders predicted such a high inflation rate and started buying up the greenback in advance. Thus, the euro/dollar pair has once again approached the level of 1.1496 and retested its yearly lows. EUR/USD on M5 chart
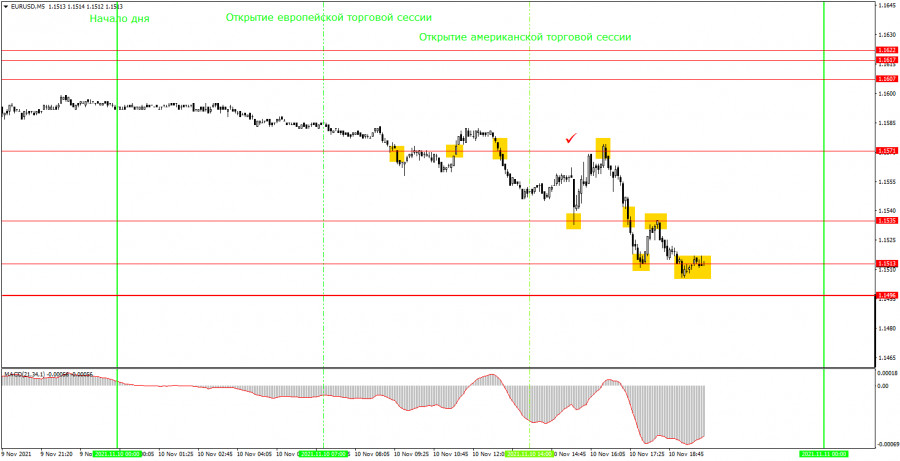
On the 5 minute time frame, the pair's movement was pretty smooth, especially during the American trading session. However, it was still better to skip most of the signals as they turned out to be false or too risky. Let's discuss possible trading strategies you could have used today. In the course of the European trading session, three signals were formed around the level of 1.1571. First, the price consolidated below it (a sell signal), then above it (a buy signal) and then it went lower again (a sell signal). Since in the first two cases the price did not even pass 10 pips in the right direction, both signals were considered false. The signals brought a loss of 24 pips. The third signal formed in the European session should not have been used, just as all other signals around the level of 1.1571. Then, the first buy signal was formed near the level of 1.1535during the US trading hours. It was formed exactly at the time when the inflation report was published. Therefore, you should have ignored this signal as it was too risky. After that, the signals around the 1.1535 and 1.1513 levels were formed. The price bounced off these levels three times, which allowed novice traders to open three trades at once. Each of them brought traders a small profit since the distance between these levels was only 22 pips. So, beginners could have earned about 30 pips which helped offset morning losses. The last signal was formed too late and should not have been followed. Trading tips for Thursday On the 30-minute timeframe, the pair quickly consolidated below the trendline, so the uptrend reversed without even starting. At the moment, the quotes have dropped to the level of 1.1496 and may continue to fall. However, today's downtrend was caused mainly by strong statistics, while tomorrow the situation will be different. Therefore, the decline may not necessarily continue. On the 5-minute time frame, the key levels for November 11 are located at 1.1496, 1.1513, 1.1535, and 1.1571. As usual, Take Profit should be set at the distance of 30-40 pips, while Stop Loss should be placed to a breakeven point as soon as the price passes 15 pips in the right direction. On the M5 chart, the nearest level could serve as a target unless it is located too close or too far away. If it is, then you should act according to the situation or trade with a Take Profit. On Thursday, beginning traders will have nothing to focus on since neither the US nor the EU will publish any macroeconomic report. Also, no important fundamental events are expected tomorrow. Basic rules of trading 1) The signal strength is determined by the time the signal took to form (a bounce or a breakout of the level). The quicker it is formed, the stronger the signal is. 2) If two or more positions were opened near a certain level based on false signals (which did not trigger a Take Profit or test the nearest target level), then all subsequent signals at this level should be ignored. 3) When trading flat, a pair can form multiple false signals or not form them at all. In any case, it is better to stop trading at the first sign of a flat movement. 4) Trades should be opened in the period between the start of the European session and the middle of the US trading hours when all positions must be closed manually. 5) You can trade using signals from the MACD indicator on the 30-minute time frame only given that volatility is strong and there is a clear trend that should be confirmed by a trend line or a trend channel. 6) If two levels are located too close to each other (from 5 to 15 pips), they should be considered support and resistance levels. On the chart Support and Resistance Levels are the levels that serve as targets when buying or selling the pair. You can place Take Profit near these levels. Red lines are channels or trend lines that display the current trend and show in which direction it is better to trade now. The MACD indicator (14, 22, and 3) consists of a histogram and a signal line. When they cross, this is a signal to enter the market. It is recommended to use this indicator in combination with trend patterns (channels and trend lines). Important announcements and economic reports that you can always find on the economic calendar can seriously influence the trajectory of a currency pair. Therefore, at the time of their release, we recommend trading as carefully as possible or exiting the market in order to avoid sharp price fluctuations. Beginners on Forex should remember that not every single trade has to be profitable. The development of a clear strategy and money management is the key to success in trading over a long period of time. The material has been provided by InstaForex Company - www.instaforex.com |
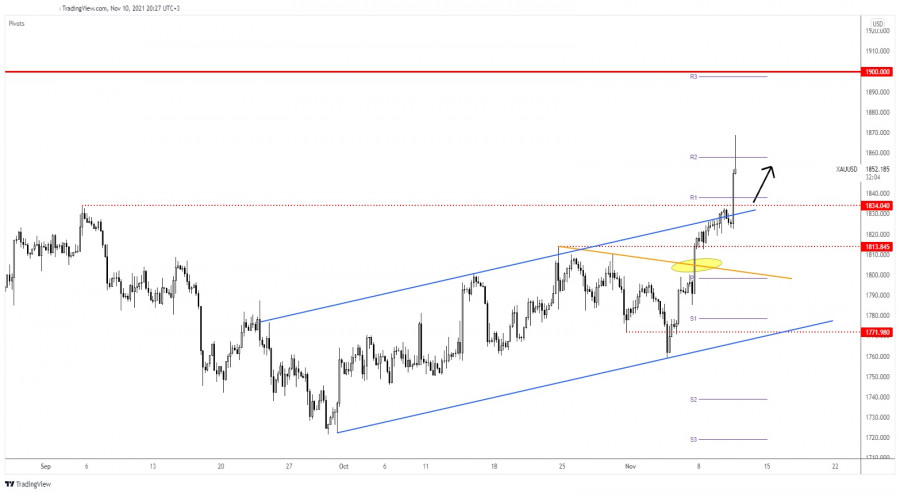
| Gold melting down despite US higher inflation Posted: 10 Nov 2021 10:04 AM PST The price of gold rallied in the last few hours climbing to as much as 1,868.62 where it has found resistance. The yellow metal loses altitude as the US Dollar Index has resumed its upside movement. XAU/USD rallied right after the United States inflation data was released. As you already know, the CPI registered a 0.9% growth versus 0.6% expected, while the Core CPI increased by 0.6% beating 0.4% expected. In addition, the Unemployment Claims indicator was reported at 267K, above 257K expected in the previous week. XAU/USD Amazing Rally
Gold extended its upwards movement as the yellow metal is used as a hedge against inflation. It has ignored the 1,834.04 upside obstacle confirming strong buyers in the short term. Technically, a temporary decline was somehow expected after the rally. It has registered only a false breakout with great separation above the weekly R2 (1,857.92), so a temporary decline towards the R1 (1,838.01) and down to the 1,834.04 is natural. Gold ForecastXAU/USD could come back down to test and retest the broken levels before starting to increase again. Developing a continuation pattern above 1,834.04 or making a strong consolidation above this level could bring fresh new long opportunities. Gold could still increase if it stays above 1,834 despite a temporary decline after its rally. The material has been provided by InstaForex Company - www.instaforex.com |
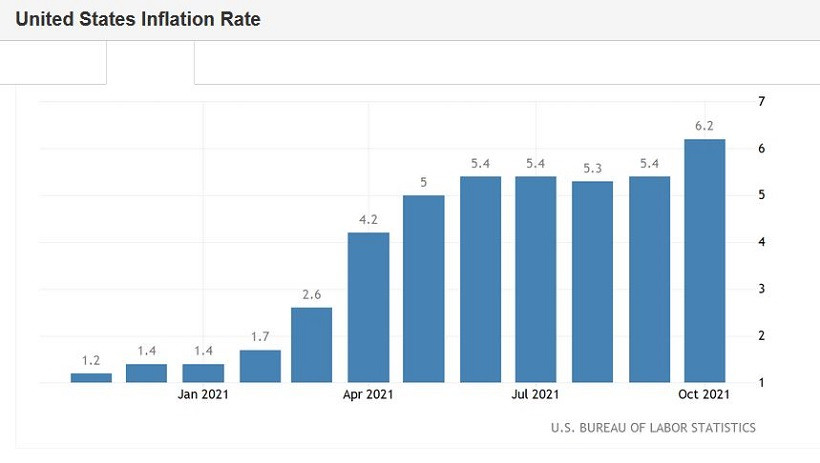
| EUR/USD: Greenback's Comeback: U.S. Inflation Hits Records Again Posted: 10 Nov 2021 09:59 AM PST U.S. inflation has brought dollar bulls back to life. The data published today is important not only "in the moment," but also in the context of the long-term prospects of the greenback. Over the past few days, the market has been fluctuating, being between a "hammer and anvil": on the one hand, the restrained rhetoric of Fed Chairman Jerome Powell, on the other hand, the growth of key macroeconomic indicators in the United States. The chairman of the Federal Reserve urges ignoring inflation, which, in his opinion, will begin to fade at the beginning of next year. But recent data suggest that the inflation spiral in the U.S. continues to unwind, contrary to earlier forecasts of the Fed. Hence a certain distrust of Powell, who continues to insist on the temporary nature of inflationary trends. Wednesday's data, in my opinion, will only strengthen this distrust.
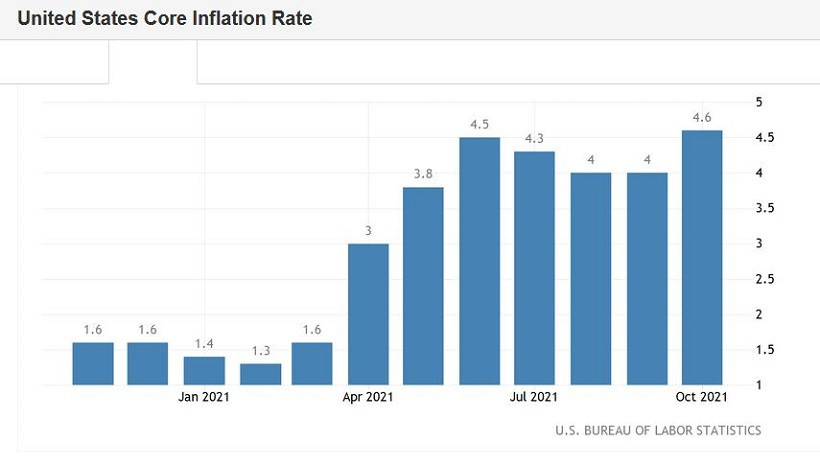
The jump in the consumer price index suggests that the regulator will be forced to take appropriate measures to curb price pressure. This scenario is also supported by the latest Nonfarm Payrolls report, which turned out to be much better than the expectations of most experts. The "hawk puzzle" is slowly taking shape, while the rhetoric of the head of the Fed looks less and less convincing. In other words, the market makes its own conclusions, which de facto run counter to the official position of the head of the Federal Reserve. Some representatives of the American regulator are also adding fuel to the fire, who, contrary to the opinion of their boss, agree that the time for the first round of rate hikes will come next year, since the inflation target has already been significantly exceeded. In other words, today the pendulum has swung towards the implementation of the "hawk scenario." Thus, according to published data, the overall consumer price index in October accelerated to 6.2% YoY (with a forecast of growth to 5.8%). This is a long-term record. The CPI was last at these heights more than 30 years ago - back in 1990. On a monthly basis, the index also showed positive dynamics, rising to 0.9% (growth has been recorded for the second month in a row). The core CPI, excluding volatile food and energy prices, similarly surprised market participants with strong figures. In monthly terms, an increase of up to 0.6% was recorded, in annual terms - up to 4.6%. And here again, is a long-term record: the index last "gave out" such results in August 1991. Note that the Fed's preferred inflation indicator, the Personal Consumption Expenditure Index (PCE), also significantly exceeds the regulator's target level. It is believed that this indicator is being closely monitored by members of the American regulator. The core PCE index, which does not take into account volatile food and energy prices, rose by 3.7% in September (in annual terms). It remained at the same high level as it was released in August, July, and June. Such macro records are suggestive. First of all, that the Federal Reserve will be forced to "step on the throat of its own song," starting to implement "Plan B." In the opinion of the overwhelming majority of experts, high inflation in the United States may persist longer than the Fed believes. Persistent supply disruptions, heightened consumer demand, rising wages, and a recovery in the labor market - all of these factors contribute to the further unwinding of the inflationary spiral. That is why the opinion is gradually taking root in the market that the Fed will stop the growth of inflation indicators next year by raising rates. And Jerome Powell himself theoretically admits the likelihood of such a scenario. During his speech in Congress back in late September, Powell said that the US regulator "should consider raising rates if it sees evidence that rising prices are forcing households and companies to wait for higher prices to take root, creating more stable inflation." Following the results of the last Fed meeting, he rephrased this position without changing its essence. Thus, the latest macroeconomic reports suggest that subsequent events will not unfold according to the Fed's scenario. Especially considering the fact that representatives of the "hawk wing" of the Fed have recently been increasingly talking about the fact that the rate may be raised as early as next year (James Bullard even called for a double increase in 2022).
The European Central Bank, in turn, continues to "hold the line," voicing "dovish" rhetoric. Key figures of the ECB are taking a soft position, excluding the option of early tapering of QE and an earlier increase in the interest rate (as of today, the target is 2024). The uncorrelation of the ECB and the Fed rates will continue to put pressure on the EUR/USD pair. In the wake of another strengthening of the greenback, the pair's bears are trying to gain a foothold below the support level of 1.1530 (the lower line of the Bollinger Bands indicator on the D1 timeframe). This is a key target for sellers of EUR/USD, since overcoming it will actually open the way to the area of the 14th figure. Any corrective surges are still advisable to use to open short positions. If the pair closes the current trading day above the support level, the first target will remain at 1.1530. If the bears still manage to gain a foothold under this target, then the first target of the downward movement in the medium term will be the level of 1.1480 (the lower line of the Bollinger Bands on the weekly chart). The main target is 1.1440: at this price point, the upper and lower borders of the Kumo cloud on the monthly chart are connected. The material has been provided by InstaForex Company - www.instaforex.com |
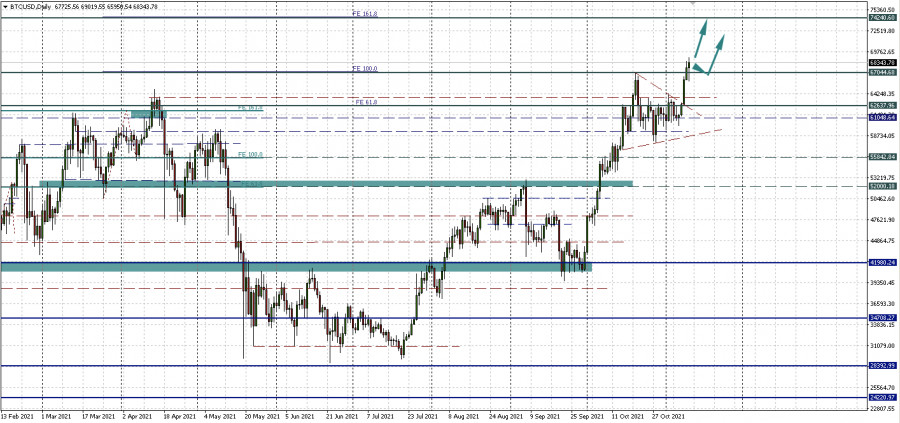
| Bitcoin: $100,000 this year, $250,000 next year, $1,000,000 key target by 2025 Posted: 10 Nov 2021 09:51 AM PST
Well-known analyst Matthew Hyland believes that overcoming the $100,000 milestone by the end of this year will encourage even more companies to switch from fiat to Bitcoin, which will cause the growth of digital gold up to $250,000 next year. A given price of $100,000 will form a beacon of hope for long-term holders and give impetus to new growth. Bitcoin has again updated its all-time highs, now digital gold has come close to the level of $69,000, more and more whales continue to move their assets to Bitcoin. Hyland is confident that Bitcoin will be worth a quarter of a million dollars in 2022, and in 2025, the main cryptocurrency may reach a record $1 million. He also stated that only one of the two Bitcoin Stock-to-Flow models will exist after 2022. Considering the bullish rally in Bitcoin, increased demand, and hype, then the $100,000 mark by the end of this year is a real benchmark. Hyland believes that institutional investors who invest in Bitcoin will be fundamental factors for the growth of the main cryptocurrency. They will play a role and determine the price of Bitcoin, which can adjust and go up to $1,000,000 by 2025, just after the current halving cycle, which will be completed in 2024. This Stock-to-Flow model will be the main help for the later stages of the euphoric bullish movement, because if this model confirms its significance, and the price of $100,000 is overcome, then more and more people will believe in the stock-to-flow cross-asset model ( S2FX), which means that the price of $250,000 next year will also be quite realistic. The whales will sell Bitcoin to ordinary residents in order to maintain sufficient liquidity on the crypto market as well as to sell Bitcoin at the highest prices. Hyland is confident that the ultimate price target for bitcoin should be $1 million by 2025. Bitcoin whales are tasked with accumulating crypto assets, selling them to maintain liquidity, and manipulating the price market. The $1 million mark will be a major challenge for Bitcoin whales. Bobby Lee, who is the former CEO of the BTCC exchange, is also confident that Bitcoin will grow to $1 million within 10 years. By 2031, Bitcoin will be fully scalable and socially responsive, with a daily emission of just 112 BTC, a record low. The material has been provided by InstaForex Company - www.instaforex.com |
| Bitcoin Shows Signs of Reasonable Accumulation Posted: 10 Nov 2021 09:47 AM PST Tuesday's fears that updating historical values for bitcoin will turn out to be a failed bullish impulse were not justified. On Wednesday, the main cryptocurrency has set a new high and seems to be approaching $70,000 per coin. And if it is more or less clear from local prospects and technical benchmarks, what highs can we expect from BTCUSD in this bullish cycle? Bitcoin still has 3-6 months of growthRenowned analyst PlanB notes that it is completely unimportant to know what maximum the main cryptocurrency will reach. This does not provide the trader with any practical value. It is much more important to understand how long the bull market can last. PlanB claims that Bitcoin is now somewhere in the middle of the current growth cycle. But rather than trying to identify a long-term target, traders should watch for a shortage of supply to gauge when the top is likely to emerge. By assessing the situation at the network level, it is possible to track when the supply deficit begins to increase. PlanB assumes that bitcoin is still 3-6 months below its peak, and perhaps more time will pass until then. "I really don't think there is a collapse ahead. I think we will see a bull market that will last at least six months and bring us closer to the $100,000-200,000 range. I wouldn't even be surprised if at the beginning of 2022 we see $500,000 per bitcoin." PlanB predicts that the main cryptocurrency will rise to at least $98,000 by the end of November, and to $135,000 in December. Reasonable accumulation - what is it?Analysts point out that now the activity in the bitcoin network is slightly higher than the values during the bear market. But this does not mean that the bulls are losing their advantage. In fact, this could be a sign of a maturing market. The situation that is now observed among long-term holders, as well as the supply and demand of bitcoin, shows that the market remains in the phase of smart accumulation. But it is gradually approaching the transition from this phase to euphoria and excitement, as it was in 2017 and the first quarter of 2021. The number of Bitcoin transactions is now below the highs recorded in the first half of 2021. This trend towards hyperaccumulation, along with comparatively lower online activity, does indicate that the BTC market is maturing. Experts point out that the price structure and the supply and demand situation confirm the fact that bitcoin follows the model from stock to flow exactly. This is where PlanB's goals above $98,000 for November come from.
|
| Posted: 10 Nov 2021 09:34 AM PST
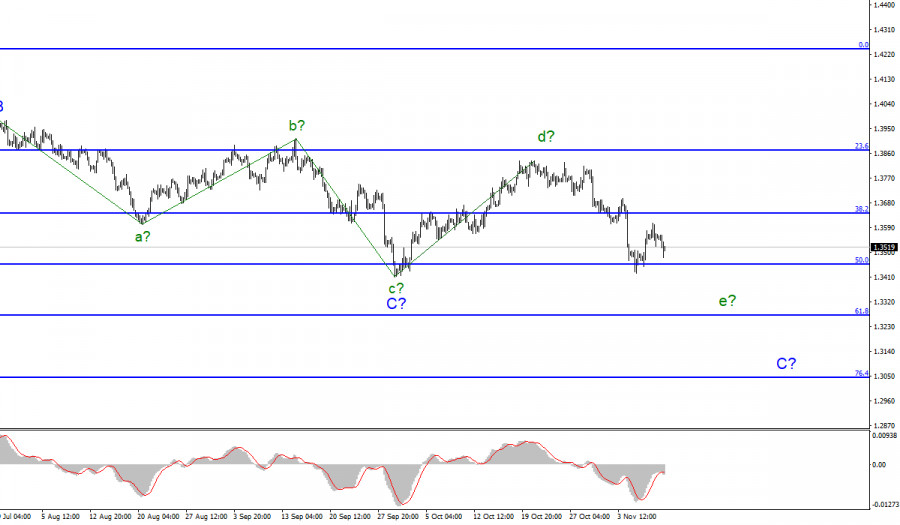
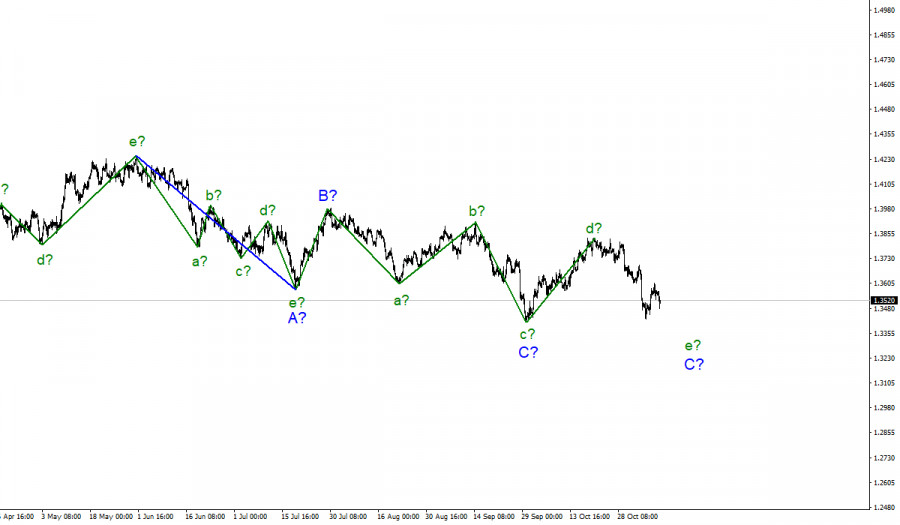
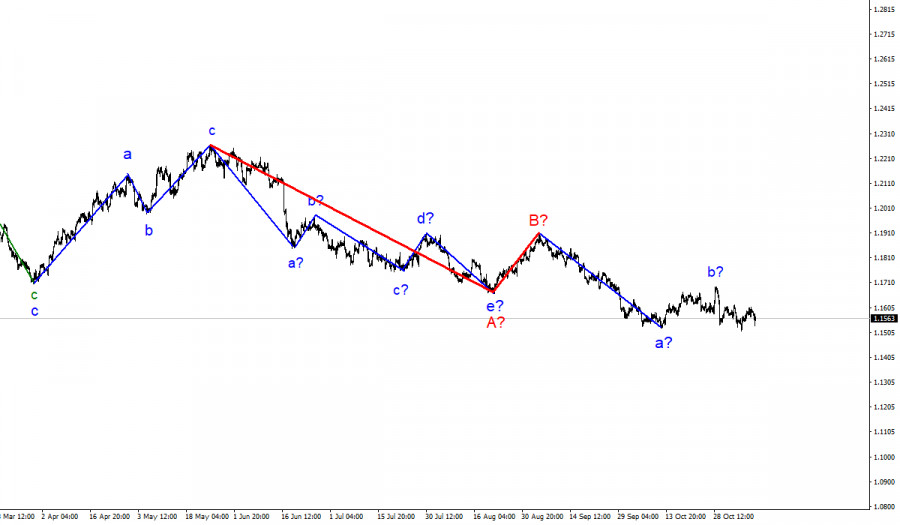
Wave pattern. For the pound/dollar instrument, the wave marking continues to look quite difficult due to deep corrective waves as part of the downward trend section. However, at the same time, it is quite convincing. Inside the last wave C, presumably five internal waves are visible, and each subsequent one is approximately equal in size to the previous one. My assumption that wave C can already be completed has not yet been confirmed, but the frankly corrective wave structure may change once again. Moreover, it is so that the low of September 29 may become the starting point for a new upward section of the trend. In this case, the construction of the descending wave C has already been completed. And the two waves following it are the first and second waves of the new ascending section. At the same time, there is no confidence in the execution of this option either. An unsuccessful attempt to break the 50.0% Fibonacci level and an unsuccessful attempt to break the low wave c-C indicate that the instrument is ready to increase. But nothing prevents the markets from increasing demand for the dollar tomorrow, which will lead to an update of the low wave c-C, which will lead to the fact that the last descending wave will be recognized as the wave e-C. The Briton stumbled again, this time because of the US inflation report. The exchange rate of the pound/dollar instrument decreased by 80 basis points during Wednesday, but after the release of the US inflation report, it slightly moved away from the lows reached and is rising in the afternoon. However, I continue to expect a decline in the quotes of the instrument, as I consider the downward trend section incomplete. Another question is what can further increase the demand for the dollar in the market? Let's look at the news calendar for the rest of the week. Tomorrow, the UK will undoubtedly release important reports on GDP in September and changes in industrial production in the same month. The markets have not been reacting very actively to the British statistics packages lately, but maybe everything will be different this time. Gross domestic product may decrease to 1.5% 3m/3m, although the value of the previous month, August, was 2.9%. If the real value is even lower, then the British may fall under the decline in demand, which is exactly what is needed for further construction of the downward wave e-C. Thus, tomorrow, I am waiting for weak statistics from Britain. The GDP for the quarter may also decrease significantly. In the 3rd quarter, growth is expected to be only 1.5%, although, in the 2nd quarter, economic growth of 5.5% was recorded. This data may be a disappointment for the markets and the British pound. General conclusions. The wave pattern of the pound/dollar instrument looks quite convincing now. It has a descending form, but it is not impulsive. The expected wave e does not look complete yet, so I advise you to sell the instrument for each signal down the MACD indicator with targets located near the level of 1.3270, which equates to 61.8% Fibonacci.
Senior schedule. Starting from January 6, the construction of a new downward trend section began, which can turn out to be almost any size and any length. At this time, I still expect to build another downward wave, since wave A turned out to be a five-wave one. The peak of wave b has not been broken yet, so I am waiting for a decline in quotes. The material has been provided by InstaForex Company - www.instaforex.com |
| EUR/USD analysis on November 10 Posted: 10 Nov 2021 09:33 AM PST Throughout Wednesday's trading session, the value of the first cryptocurrency shows a steady drop. At the time of writing, digital gold is trading near the $ 66,400 mark (-2.33%). The altcoin market has adopted the trend of the main virtual asset and is also actively declining. Thus, the value of Ethereum sank by 1.58% to $ 4728, and Binance Coin lost 1.49% and is trading at $ 635. At the moment, the Bitcoin price has rolled back from the record highs updated a day ago by more than 2%. The rapid retreat in value confirms BTC's desire to lock in profits after a new record and catch its breath a little. Experts say that this trend of the digital coin highlights the uncertainty of market participants in its future, and especially the cautious attitude towards Bitcoin. Moreover, the uncertainty of cryptocurrency buyers in its stability extends to many leading altcoins. So, the popular Shiba Inu meme coin is still holding on to the $0.000050 level, not reacting to the current positive news for it. According to the latest data, since SHIB reached a record high on October 28, it has lost more than a third of its market price. As for the positive news, on the eve of the Wealthsimple trading platform included the Shiba Inu cryptocurrency in its ecosystem. In addition, one of the leading American cinema chains, AMC, announced that it plans to accept altcoin for payment services along with Bitcoin and Dogecoin in the near future. AMC's decision is related to an October poll on Twitter when representatives of the company asked users whether it was worth increasing the list of supported digital currencies. More than 80% of the participants in the virtual survey voted for the idea of adding the SHIB coin to the list.
As for the inclusion of the dog cryptocurrency in the ecosystem of the Wealthsimple trading platform, now the clients of the platform will be able to buy and sell virtual assets, but exclusively on the Wealthsimple network. Previously, SHIB was included in the work of the well-known cryptocurrency exchanges Coinbase and Binance among traders. Thanks to this solution of trading platforms, since that moment the value of the meme coin has increased by more than 100%. The material has been provided by InstaForex Company - www.instaforex.com |
| Falling Bitcoin and exhausted Shiba Inu: is the cryptocurrency market tired of records? Posted: 10 Nov 2021 09:31 AM PST Throughout Wednesday's trading session, the value of the first cryptocurrency shows a steady drop. At the time of writing, digital gold is trading near the $ 66,400 mark (-2.33%). The altcoin market has adopted the trend of the main virtual asset and is also actively declining. Thus, the value of Ethereum sank by 1.58% to $ 4728, and Binance Coin lost 1.49% and is trading at $ 635.
At the moment, the Bitcoin price has rolled back from the record highs updated a day ago by more than 2%. The rapid retreat in value confirms BTC's desire to lock in profits after a new record and catch its breath a little. Experts say that this trend of the digital coin highlights the uncertainty of market participants in its future, and especially the cautious attitude towards Bitcoin. Moreover, the uncertainty of cryptocurrency buyers in its stability extends to many leading altcoins. So, the popular Shiba Inu meme coin is still holding on to the $0.000050 level, not reacting to the current positive news for it. According to the latest data, since SHIB reached a record high on October 28, it has lost more than a third of its market price. As for the positive news, on the eve of the Wealthsimple trading platform included the Shiba Inu cryptocurrency in its ecosystem. In addition, one of the leading American cinema chains, AMC, announced that it plans to accept altcoin for payment services along with Bitcoin and Dogecoin in the near future. AMC's decision is related to an October poll on Twitter when representatives of the company asked users whether it was worth increasing the list of supported digital currencies. More than 80% of the participants in the virtual survey voted for the idea of adding the SHIB coin to the list. As for the inclusion of the dog cryptocurrency in the ecosystem of the Wealthsimple trading platform, now the clients of the platform will be able to buy and sell virtual assets, but exclusively on the Wealthsimple network. Previously, SHIB was included in the work of the well-known cryptocurrency exchanges Coinbase and Binance among traders. Thanks to this solution of trading platforms, since that moment the value of the meme coin has increased by more than 100%. The material has been provided by InstaForex Company - www.instaforex.com |
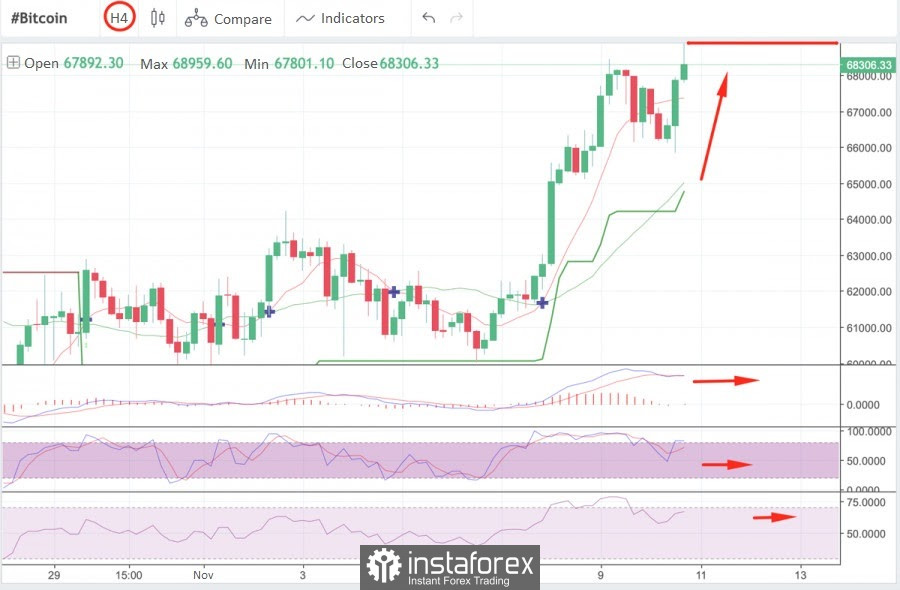
| Bitcoin soars to $69,000: what caused the bullish rally and what do BTC technical indicators say? Posted: 10 Nov 2021 09:25 AM PST After a local decline provoked by profit-taking by long-term owners, bitcoin began to grow again and as of 13:30 UTC set a new ATH at $69,000. Despite the fact that the current growth is associated with fundamental reasons and it is extremely dangerous to trade now, there is an opportunity to catch an asset on the decline after a bullish rally. To do this, it is necessary to analyze the horizontal charts of the coin and understand the reasons for such a sharp increase in the price of the cryptocurrency. The main reason for such a sudden growth of bitcoin was the Fed's report on the rate of inflation. According to the latest data, inflation in the United States has exceeded 6.2%, which is a record for the last thirty years. This news served as a signal for action and investors began to buy BTC, as the depreciation of fiat suggests that the demand for a cryptocurrency that protects against it will grow. Thanks to this, the coin has confidently overcome all resistance levels and continues to grow. It is worth noting that in order to avoid unforeseen losses, it is necessary to monitor the financial calendar of volatility and refrain from trading at the moments of important financial events. The current bitcoin rally is out of the picture and is an impulsive reaction to new objective data. To make sure of this and to predict the point of price decline, it is necessary to analyze different time periods of price movement. The four-hour chart shows that the first cryptocurrency has made a rebound from the $65,800 area, which can be seen by the long lower wick of the green candle. This suggests that the sellers failed to push the price below the support line, as a result of which the quotes rebounded and began to grow. At the same time, US inflation data were announced, which gave an additional upward impulse to the bullish wave. Despite the fact that bitcoin has set a new historical record, the prerequisites for further decline are already visible. This can be seen by the long upper tail of the last bullish candle, which means the pressure of sellers who pushed the price down to $68,200. Now the cryptocurrency is trying to resume the upward movement by retesting the $68,200 resistance zone. The technical charts of Bitcoin begin to signal the weakening of the current bullish momentum: the MACD is moving sideways, and the stochastic is beginning to decline, which indicates the loss of initiative by buyers. The relative strength index also shows a tendency to sideways movement, but is in a bullish zone. Taking into account the long upper wick on the last candle, the positions of bulls and bears are approximately equal, which means that the movement can go in any direction.
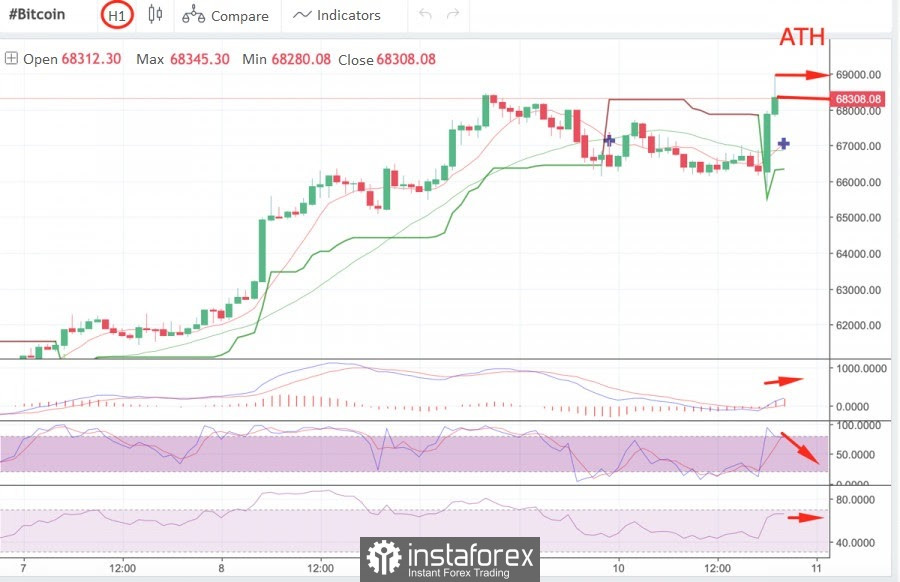
On the hourly chart, the situation also looks unstable, but the bears' positions look more confident. After reaching ATH, bitcoin failed to overcome the $68,200 mark, which means that the resistance zone still maintains pressure on the quotes. With this in mind, the $68,200 mark is an excellent entry zone for a decline, but less than an hour has passed since the Fed's conclusion, which indicates an increased risk of opening short right now. The instability of the situation is clearly visible on the technical charts: the stochastic oscillator confidently moved upside and subsequently made a sharp pullback, but has already begun to level off. At the same time, the relative strength index began a sideways movement in the bullish zone, which indicates the strength of the upward momentum. While the MACD moves along the red zone and begins a broad bullish ascent beyond the zero mark, which indicates a new impulse to growth.
The price met serious resistance in the area of $68,200-$68,300 and, most likely, buyers will try to push the price to the historical maximum, but subsequently, a strong corrective decline will begin, and therefore it is worth waiting for the situation to stabilize. At the start of the downward movement, the $68,200 mark will be a profitable entry point, but it will not be superfluous to hedge around $68,345 with a stop loss. The price drop will slow down around $66,700-$67,600, but if you exit this range, you can continue to play down to the key support level at $64,400. The material has been provided by InstaForex Company - www.instaforex.com |
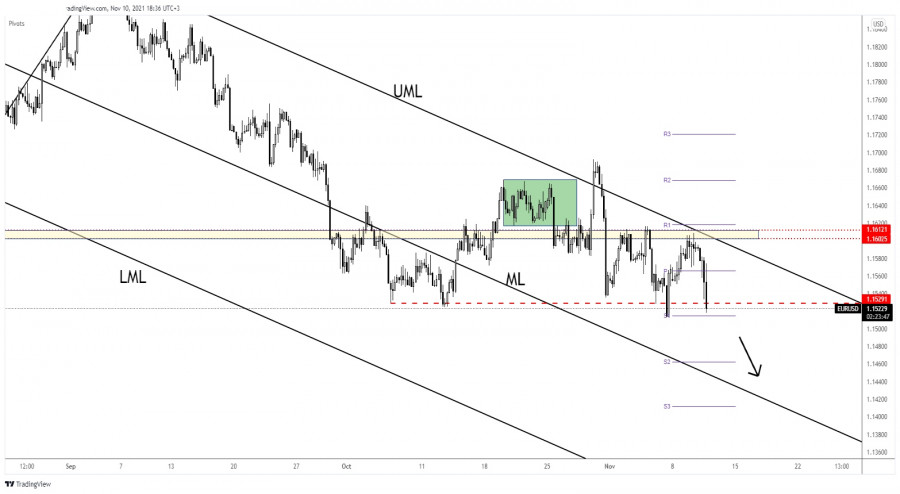
| EUR/USD towards fresh new lows post US inflation figures Posted: 10 Nov 2021 09:23 AM PST The EUR/USD pair drops aggressively as the US Dollar Index has managed to jump higher after stabilizing above the 94.21 weekly pivot point. At the time of writing, the DXY retreated a little from today's high of 94.60, that is why the EUR/USD has rebounded from today's low of 1.1511 . EUR/USD could extend its downside movement if the Dollar Index registers a valid breakout above the 94.50 resistance level. Fundamentally, the US Consumer Price Index registered 0.9% growth in October versus 0.6% expected and compared to 0.4% in September, while the Core CPI reported a rise of 0.6%, exceeding the 0.4% growth expected by specialists. Higher inflation could force the Federal Reserve to hike rates sooner than expected, that is why USD is strongly bullish right now. EUR/USD Aggressive Sell-Off
The EUR/USD pair dropped to as much as 1.1511 after failing to stabilize above the 1.1566 weekly pivot point. I have mentioned in my previous analysis that EUR/USD could turn to the downside after failing to hold above the 1.16 psychological level and after failing to reach and retest the upper median line (UML). As you already know from my analysis, EUR/USD could extend its downward movement if it makes a valid breakdown below 1.1529. EUR/USD PredictionI believe that a new lower low, that is, a bearish closure below 1.1513 could activate a larger downside movement. Dropping and closing below the weekly S1 (1.1514) could confirm more declines. The median line (ML) of the descending pitchfork could be used as a downside target. The material has been provided by InstaForex Company - www.instaforex.com |


| You are subscribed to email updates from Forex analysis review. To stop receiving these emails, you may unsubscribe now. | Email delivery powered by Google |
| Google, 1600 Amphitheatre Parkway, Mountain View, CA 94043, United States | |


Comments