Forex analysis review
Forex analysis review |
- Forecast for EUR/USD on November 8, 2021
- Forecast for GBP/USD on November 8, 2021
- Forecast for AUD/USD on November 8, 2021
- Forecast for USD/JPY on November 8, 2021
- Forecast and trading signals for EUR/USD on November 8. Detailed analysis of the pair's movement and trade deals. Non-farm
- How to trade GBP/USD on November 8? Simple tips for beginners. The extractive week is over, what's next for us?
- Nassim Nicholas Taleb: Bitcoin will be worth zero.
- How will the results of the Fed meeting affect the prospects for bitcoin?
- GBP/USD. Preview of the new week. American inflation is the key event of the week
- EUR/USD. Preview of the new week. The most boring week in which the dollar will try to maintain its advantage
- How to trade EUR/USD on November 8? Simple tips for beginners. Friday was much more boring than it could have been
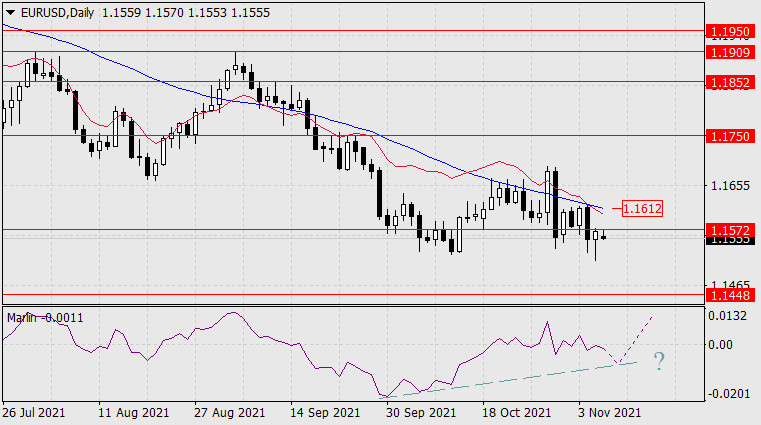
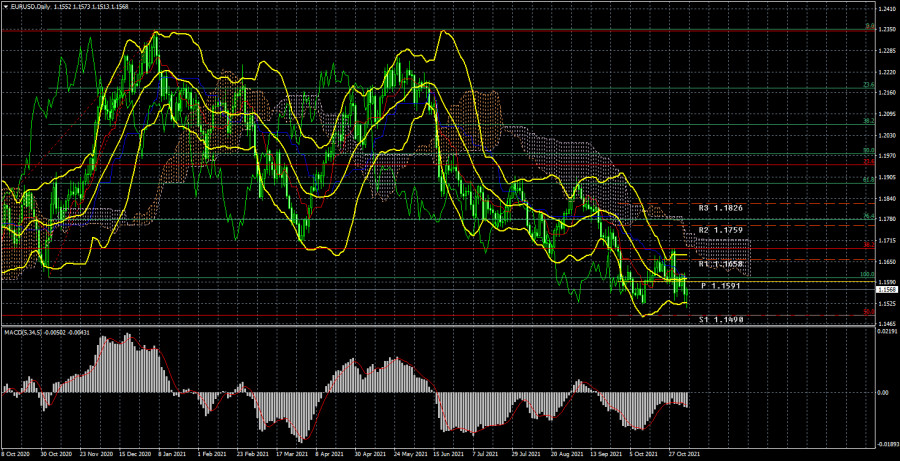
| Forecast for EUR/USD on November 8, 2021 Posted: 07 Nov 2021 07:47 PM PST Last Friday, the euro grew on rather strong indicators of employment in the United States. In the non-agricultural sector, 531,000 new jobs were created in October against the expected 450,000, the September figure was revised to increase from 194,000 to 312,000. As a result, this resulted in a decrease in unemployment from 4.8% to 4.6%... Average hourly wages increased by 0.4% over the month. The dollar sales were probably influenced by the drop in government bond yields. Thus, the yield on 5-year securities fell from 1.11% to 1.05%. But this rise in the euro appears to be temporary. Forecasts for economic data for Europe this week show a decline. Today, the published index of investor confidence from Sentix for November is expected to decrease from 16.9 to 15.5, tomorrow the ZEW index of economic sentiment in Germany for the current month is expected to deteriorate from 22.3 to 20.0. In the US, the October PPI may show an increase of 0.6%, and on Wednesday, the US CPI for October is expected to rise from 5.4% y/y to 5.8% y/y.
On the daily chart, the price settled below the level of 1.1572, the Marlin Oscillator is declining in the negative zone. The main scenario is the price reversal upward from the target level of 1.1448 or on the way to it with the formation of a reversal convergence with the Oscillator (dashed line).
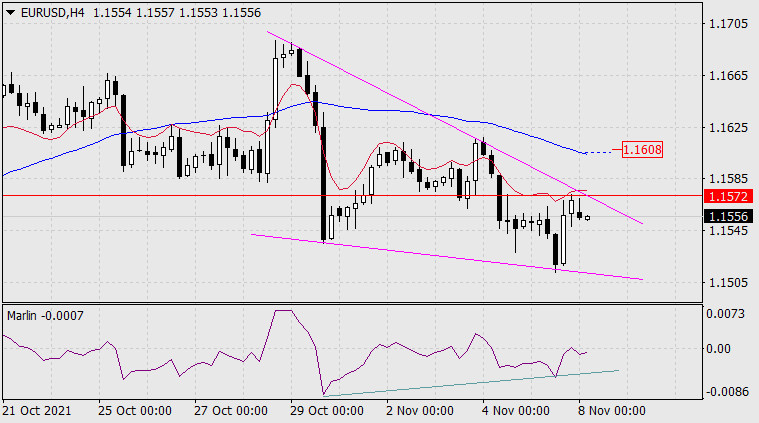
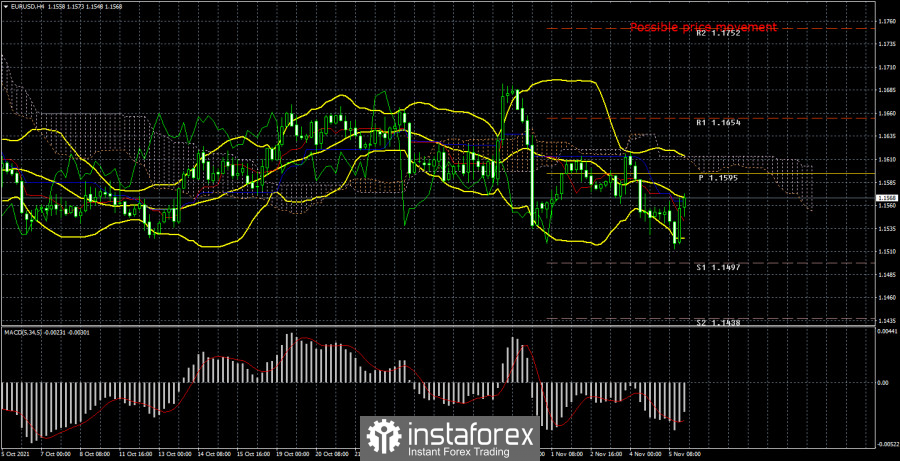
On the four-hour chart, the price with Marlin has already formed a convergence. This may mean that further price declines will be uneven, possibly in the form of a wedge-shaped structure, as indicated on the chart. The material has been provided by InstaForex Company - www.instaforex.com |
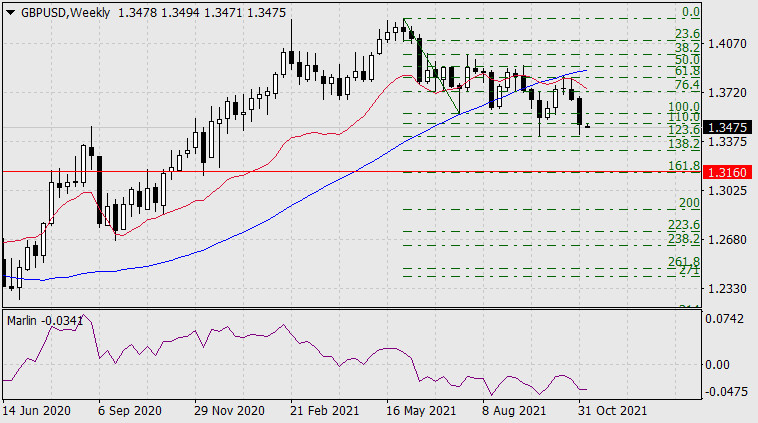
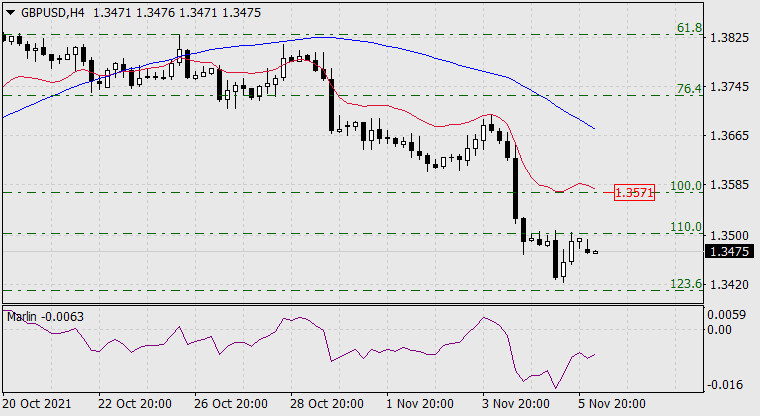
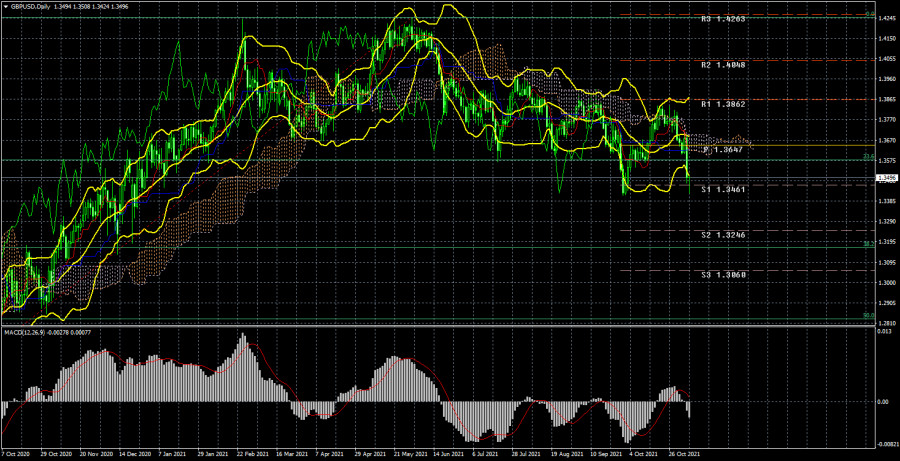
| Forecast for GBP/USD on November 8, 2021 Posted: 07 Nov 2021 07:44 PM PST On the weekly chart, the price is steadily declining below the indicator lines, supported by the descending Marlin Oscillator.
The target of the decline is the 1.3160 level - the area of the December 2020 low and the Fibonacci level of 161.8% of the first branch of the June-July 2021 movement.
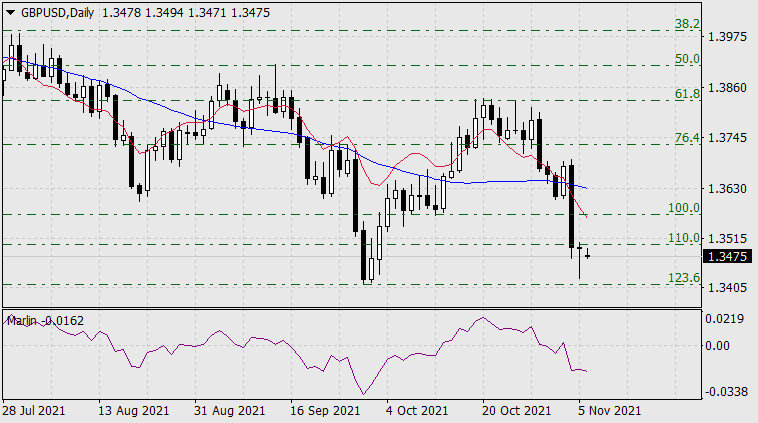
On the daily scale chart, the price settled below both indicator lines - below the balance line and the MACD line, the Marlin oscillator is decreasing in the territory of the downward trend.
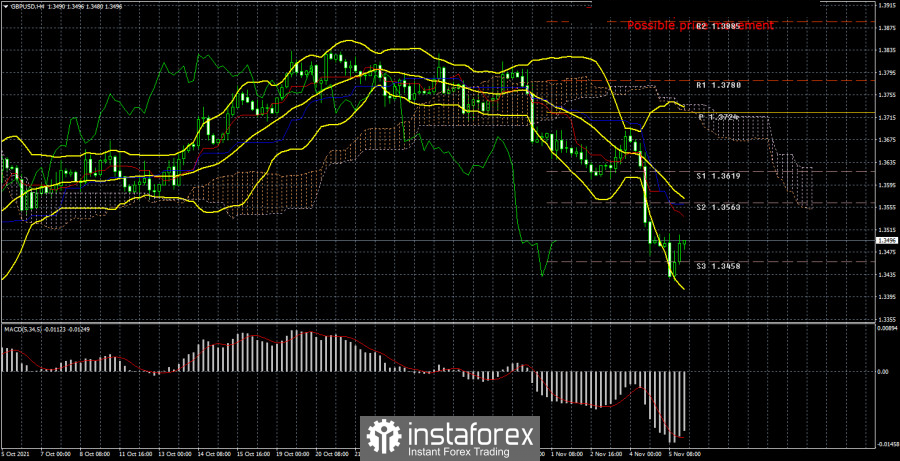
On the H4 chart, the price is trying to break above the Fibonacci level of 110.0%. If it succeeds, then the next target of the corrective growth will be the Fibonacci level of 100.0% at the price of 1.3571. Further, we are waiting for the restoration of the downward movement to the designated target at 1.3160. The material has been provided by InstaForex Company - www.instaforex.com |
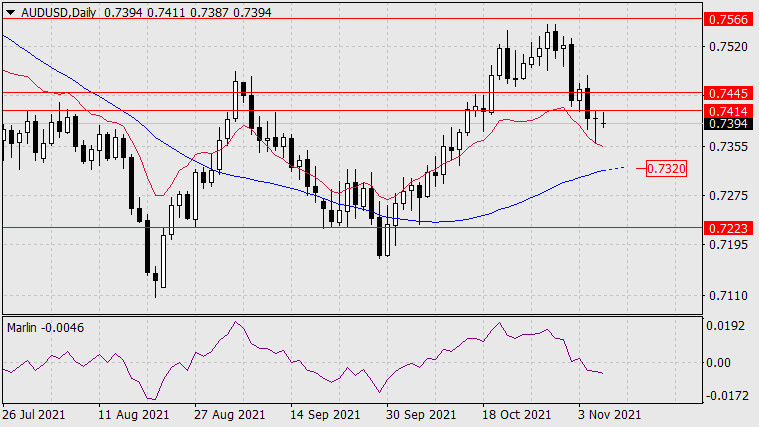
| Forecast for AUD/USD on November 8, 2021 Posted: 07 Nov 2021 07:41 PM PST The Australian dollar settled below the target level of 0.7414 on Friday. The Marlin Oscillator has consolidated below the zero line and is pulling the price down. But the price itself on the daily chart is still above the balance indicator line (red), which indicates the current price fall as a correctional one. The price can reach the MACD indicator line (0.7320) as the closest technical support and turn upwards from it, in continuation of the main growing trend.
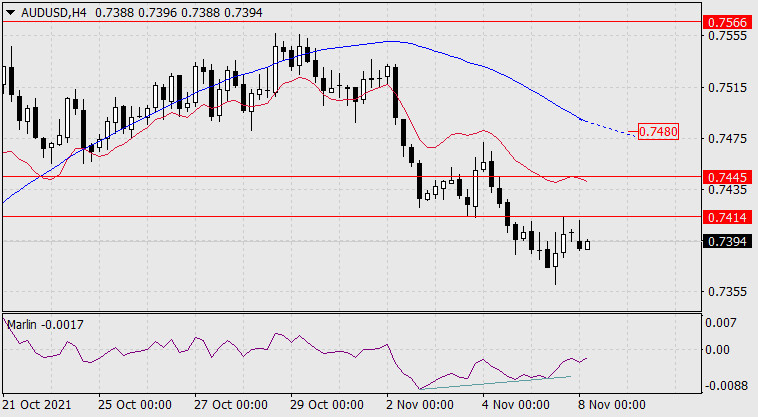
On the four-hour chart, the price has formed a convergence with the Marlin Oscillator. This may mean the succeeding growth of the price, its development in the 0.7424/45 range. However, this will not yet mean a reversal of the price to growth to the first serious target level of 0.7566, for this the price needs to fulfill a number of conditions that are not simple and not quick to implement. The first of them is an exit above the MACD indicator line, above the level of 0.7480. According to the main scenario, a price delay in the 0.7424/45 range will mean its consolidation before further falling towards the specified target on the 0.7320 daily chart.
|
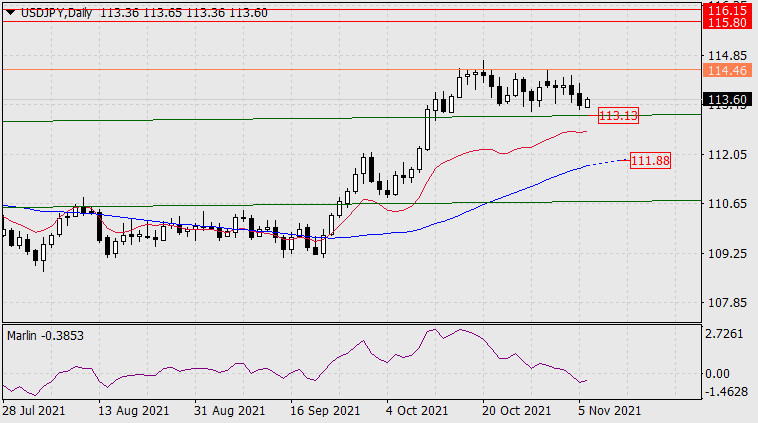
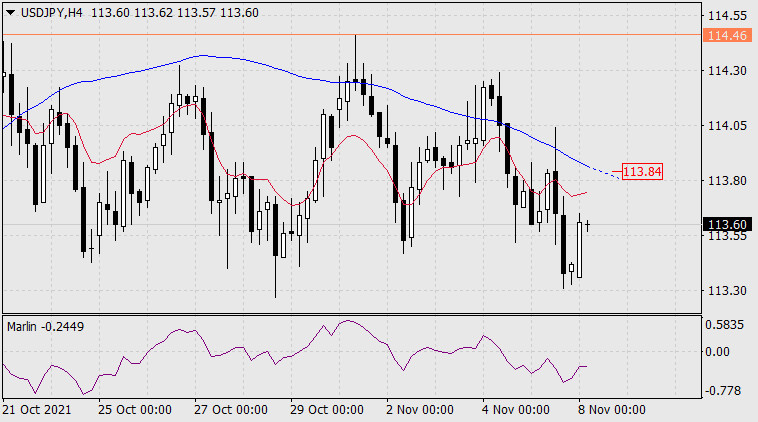
| Forecast for USD/JPY on November 8, 2021 Posted: 07 Nov 2021 07:39 PM PST The USD/JPY pair dropped 32 points on Friday, approaching the support of the embedded price channel line of the monthly timeframe at 113.13. According to our main scenario, we expect the price to reverse upwards if it reaches this support.
The target of growth is the 115.80-116.15 range. The price, of course, has the possibility of overcoming it, and the Marlin Oscillator helps, going deeper into the negative area. In this case, the downward movement may continue to the MACD line in the area of 111.88.
On the four-hour scale chart, the price has settled below the balance and MACD indicator lines, the Marlin Oscillator is in a downward position. And, nevertheless, this is still the development of a sideways trend that began a month ago, and a sideways trend is more often a consolidation before the resumption of the previous trend, that is, the growth of the USD/JPY pair. A price exit above the MACD line (above 113.84) will mean a reversal has already taken place. The material has been provided by InstaForex Company - www.instaforex.com |
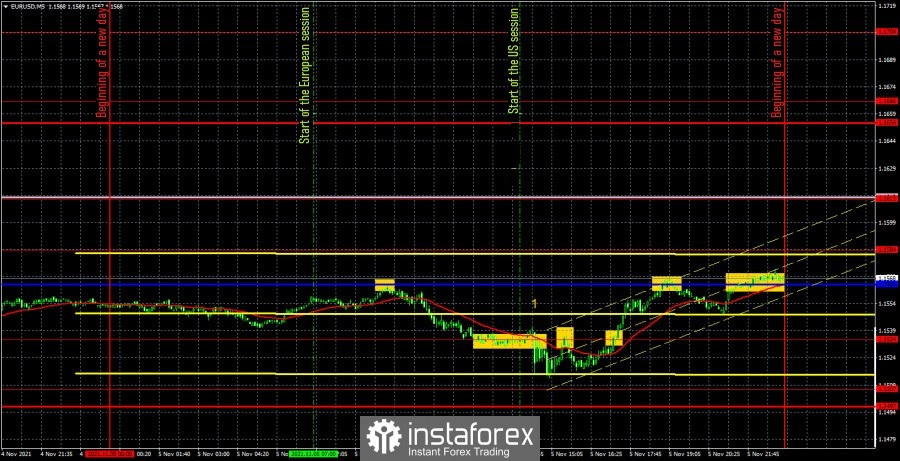
| Posted: 07 Nov 2021 06:33 PM PST EUR/USD 5M
The EUR/USD pair first dropped by 60 points during the last trading day of the week, updating its annual lows by several points, and then the same-sized upward movement, returning to the Kijun-sen line. In principle, Friday was reduced to only one event – a report on Nonfarm Companies in the US. Recall that two days before this report, the Federal Reserve announced its decision to begin curtailing the quantitative stimulus program. Accordingly, it could be assumed that the Fed is waiting for an increase in the number of Non-Farms after two failed months. And so it turned out in practice. The report turned out to be 80,000 higher than the forecast value, but it did not matter for the US dollar, because all it managed to show after this publication was a 20-point increase. However, before that, almost from the very beginning of the European trading session, the pair's quotes had already been falling, so we can also assume that the markets had already started to win back the yet-to-be-published report. In this case, the movement of the pair is logical, since when the expectations were confirmed, profit-taking on short positions began. The figure "1" in the chart marks the time of not only the Nonfarm report, but also unemployment and wages in the United States. All of them turned out to be better than the analysts' expectations. And all of them did not help the US currency to continue strengthening. Now let's look at the trading signals. The first one was formed at the beginning of the European session, but in fact there was no such signal, since the Kijun-sen line later dropped to this level, as can be seen on the 4-hour TF. Then three signals were formed near the level of 1.1534, the first two should be ignored. They were formed too close in time to the publication of important statistics in the United States. But the third buy signal could be worked out, and it allowed to earn about 16 points, since the price could not go above the critical line. The last two sell signals in the form of bounces from the Kijun-sen line should not have been worked out either, since they were formed too late. EUR/USD 1H
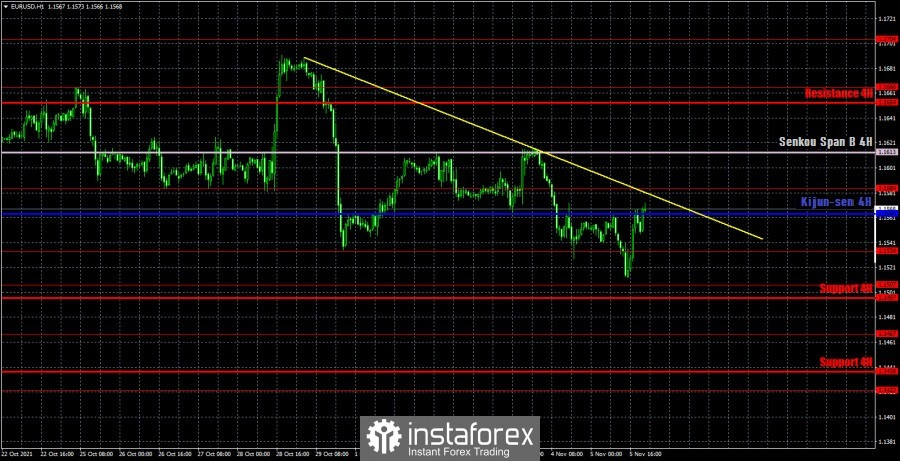
A downward trend and a trend line have finally formed on the hourly timeframe, but there is a feeling that it will not last long. On the higher timeframes, it is clearly visible that at this time the pair is moving more sideways than down. Nevertheless, a rebound from the trend line may trigger a new round of downward movement. And overcoming this line is a new round of the ascending. On Monday, we highlight the following levels for trading - 1.1507, 1.1534, 1.1584, 1.1666, as well as the Senkou Span B(1.1613) and Kijun-sen(1.1564) lines. The lines of the Ichimoku indicator may change their position during the day, which should be taken into account when searching for trading signals. Signals can be rebounds or breakthroughs of these levels and lines. Do not forget about placing a Stop Loss order at breakeven if the price moves 15 points in the right direction. This will protect you against possible losses if the signal turns out to be false. Not a single important fundamental event or macroeconomic publication will take place in the European Union and the United States on November 8. Thus, there is reason to believe that volatility will be very weak today, and there will be no intraday trend movement. We recommend you to familiarize yourself: Forecast and trading signals for GBP/USD for November 8. Detailed analysis of the movement of the pair and trade deals. Analysis of the COT report
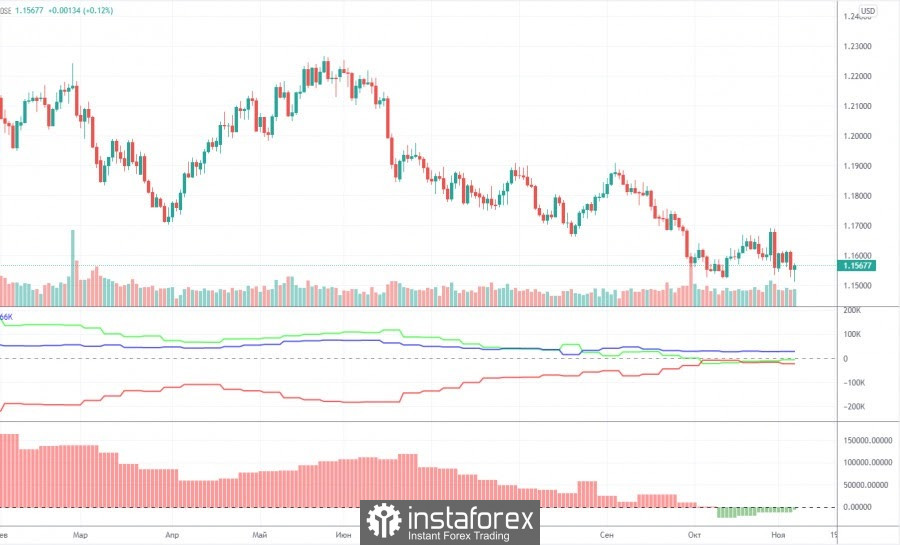
The mood of non-commercial traders changed, but not much, during the last reporting week (October 26-November 1). A group of "non-commercial" traders closed 4,000 buy contracts (longs) and 10.5 thousand sell contracts (shorts) during the reporting week. Consequently, the net position of professional players has grown by 6.5 thousand, which is not so much. However, the changes in the mood of non-commercial traders are best seen by the first indicator in the chart above. The red and green lines have been moving towards each other for a long time, and in the last couple of months they have been almost at the same level. This suggests that the previous trend is ending, and the mood of the major players at this time is as neutral as possible. This is confirmed by the data on the total number of contracts. The "non-commercial" group has 195,000 buy contracts (longs) and 199,000 sell contracts (shorts). The commercial group has 418,000 buy contracts and 442,000 sell contracts. That is, as we can see, the numbers are almost the same. Therefore, there are theoretical chances for the continuation of the downward movement in the pair. The trend began to end (an upward trend) when the red and green lines (net positions of the "commercial" and "non-commercial" groups) began to narrow. That is, for quite a long time. And now, logically, the downward trend continues. However, this "trend" is still not too similar to the trend. Rather, a banal three-wave correction. Explanations for the chart: Support and Resistance Levels are the levels that serve as targets when buying or selling the pair. You can place Take Profit near these levels. Kijun-sen and Senkou Span B lines are lines of the Ichimoku indicator transferred to the hourly timeframe from the 4-hour one. Support and resistance areas are areas from which the price has repeatedly rebounded off. Yellow lines are trend lines, trend channels and any other technical patterns. Indicator 1 on the COT charts is the size of the net position of each category of traders. Indicator 2 on the COT charts is the size of the net position for the non-commercial group. The material has been provided by InstaForex Company - www.instaforex.com |
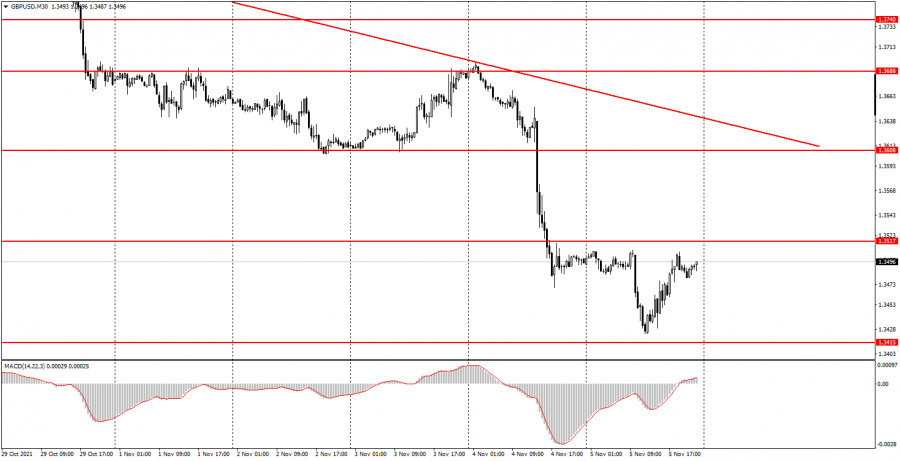
| Posted: 07 Nov 2021 01:12 PM PST Analysis of previous deals: 30M chart of the GBP/USD pair
The GBP/USD pair was trading much more calmly on the 30-minute timeframe on Friday, November 5. It seems that after the quotes collapse on Thursday, the market simply ran out of gasoline for another downward spurt. We say "dash down" because the macroeconomic statistics on Friday should have provoked a new strengthening of the US currency. However, the dollar has been growing since the morning. At that time not a single important macroeconomic report was published either in the US or in the UK. However, the dollar was still rising. And data on the labor market and unemployment were published in America, at the US session, which turned out to be much stronger than traders' expectations, for some reason this already provoked the growth of the British currency. Thus, it can be assumed that the markets worked out the US statistics in advance, and when they were published, they began to take the profit on the short positions of the pair. The downward trend on the 30-minute timeframe is maintained thanks to the trend line, but there were no sell signals on Friday. 5M chart of the GBP/USD pair
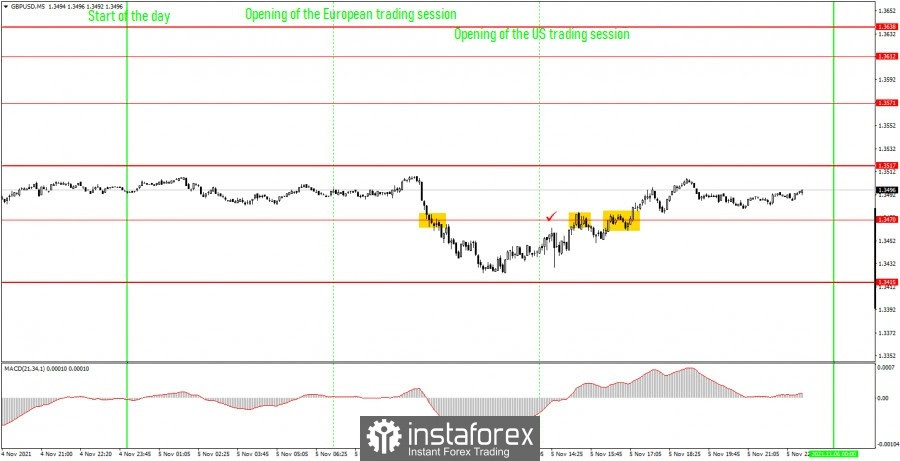
On the 5-minute timeframe, the technical picture on Friday was quite eloquent. In the first half of the day - a fall, in the second - an increase. Unfortunately, the quotes of the pair formed signals only around one level - 1.3470 during the day, and only approached others. Let's take a look at the trading signals and see how the pair should have been traded. The first sell signal was formed with some delay when the price settled below the level of 1.3470. After that, the price managed to go down 30 points, which was enough to place a Stop Loss order at breakeven. It was on this order that the deal was to be closed. However, novice traders could also close the deal manually before the publication of US statistics. This moment remained at the discretion of the traders themselves. Then another sell signal was formed near the level of 1.3470, but it, as in the case of the euro currency, should not have been worked out, since the US statistics were in favor of the dollar, and instead an upward movement began. But the next buy signal could be worked out, and it brought a small profit to traders. Only about 10 points. Therefore, it was not possible to earn much on Friday, but a small profit is better than any loss. How to trade on Monday: At this time, the downward trend continues on the 30-minute timeframe. Thus, at this time, we can consider the sell signals from the MACD indicator. However, now we need to wait for the indicator to turn down, since we are considering only sell signals. And this signal shouldn't form too high. The important levels on the 5-minute timeframe are 1.3415, 1.3470, 1.3517, 1.3571, 1.3612. We recommend trading on them on Monday. The price can bounce off them or overcome them. As before, we set Take Profit at a distance of 40-50 points. At the 5M TF, you can use all the nearest levels as targets, but then you need to take profit, taking into account the strength of the movement. When passing 20 points in the right direction, we recommend setting Stop Loss to breakeven. On November 8, novice traders will have nothing to pay attention to, since neither the UK nor the US will publish a single important report. Basic rules of the trading system: 1) The signal strength is calculated by the time it took to form the signal (bounce or overcome the level). The less time it took, the stronger the signal. 2) If two or more deals were opened near a certain level based on false signals (which did not trigger Take Profit or the nearest target level), then all subsequent signals from this level should be ignored. 3) In a flat, any pair can form a lot of false signals or not form them at all. But in any case, at the first signs of a flat, it is better to stop trading. 4) Trade deals are opened in the time period between the beginning of the European session and until the middle of the US one, when all deals must be closed manually. 5) On the 30-minute TF, using signals from the MACD indicator, you can trade only if there is good volatility and a trend, which is confirmed by a trend line or a trend channel. 6) If two levels are located too close to each other (from 5 to 15 points), then they should be considered as an area of support or resistance. On the chart: Support and Resistance Levels are the Levels that serve as targets when buying or selling the pair. You can place Take Profit near these levels. Red lines are the channels or trend lines that display the current trend and show in which direction it is better to trade now. The MACD indicator consists of a histogram and a signal line. When they cross, this is a signal to enter the market. It is recommended to use this indicator in combination with trend lines (channels and trend lines). Important speeches and reports (always contained in the news calendar) can greatly influence the movement of a currency pair. Therefore, during their exit, it is recommended to trade as carefully as possible or exit the market in order to avoid a sharp price reversal against the previous movement. Beginners on Forex should remember that not every single trade has to be profitable. The development of a clear strategy and money management are the key to success in trading over a long period of time. The material has been provided by InstaForex Company - www.instaforex.com |
| Nassim Nicholas Taleb: Bitcoin will be worth zero. Posted: 07 Nov 2021 07:30 AM PST
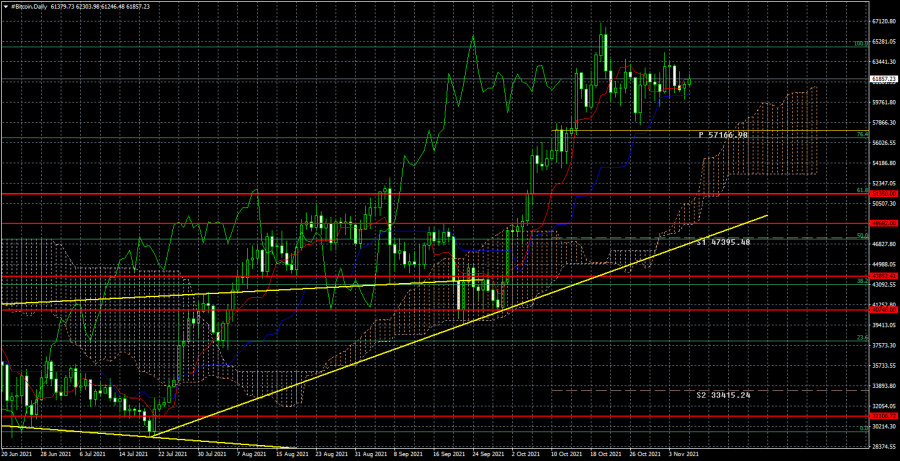
On a 24-hour timeframe, the bitcoin cryptocurrency retains upward prospects. The price continues to be located not only above the trend line, which has a starting point in mid-July, but also above the critical line. However, in the last few weeks, even on the daily timeframe, the movement looks like a flat. If this is true, then the Kijun-sen line will not act as a strong support for the price, although there have been several rebounds from this line in the last few days. If the price manages to overcome the critical line, then the correction can continue to the Ichimoku cloud and its lower border. Meanwhile, the author of the bestseller "Black Swan" Nassim Nicholas Taleb made another comment on bitcoin. He once again criticized the blockchain and cryptocurrencies, and also made a prediction that in the end they will all cost zero. "I don't believe in cryptocurrency or blockchain technology," Taleb says. Bitcoin is successful at the moment because it costs tens of thousands of dollars. Remember that a year and a half ago it cost 4 thousand dollars and was in the shadow of other markets and instruments. Such an increase in value is not a success for the currency. The currency should be stable so that all market participants and businesses can trust it without fear that tomorrow the price will change by 20 or 30%. Bitcoin cannot boast of stability. If you pay rent in bitcoins, you can easily go broke if the price goes up, and your income depends on fiat money. It's a bubble and sooner or later it will deflate. And when that happens, the damage to the economy may be irreparable. Gold will never depreciate. I have a gold chain... So it will remain gold in 1000 years, and the blockchain must be supported by people. If interest in him disappears, then it will all go away. There may also be another technology that will displace the blockchain," Nassim Taleb believes. In general, Nassim Taleb is not mistaken in his conclusions. Bitcoin, as has been said many times, is really worthless by itself. And its value is determined only by the public's interest in it. By itself, it's just a useless piece of code. Thus, if for some reason humanity is no longer interested in it, then it may drop to zero. The only question is, what should happen so that everyone's interest disappears at once?
The bullish trend continues on the 24-hour timeframe, and the ascending trend line remains, which eloquently signals the mood of market participants and can promptly notify them about the beginning of a correction or a new downtrend. As long as the price is above Kijun-sen, we advise you to stay in bitcoin purchases with goals of $64,700 and $67,000. Fixing below it will be a new signal for a new round of downward correction. The material has been provided by InstaForex Company - www.instaforex.com |
| How will the results of the Fed meeting affect the prospects for bitcoin? Posted: 07 Nov 2021 07:30 AM PST |
| GBP/USD. Preview of the new week. American inflation is the key event of the week Posted: 07 Nov 2021 07:30 AM PST
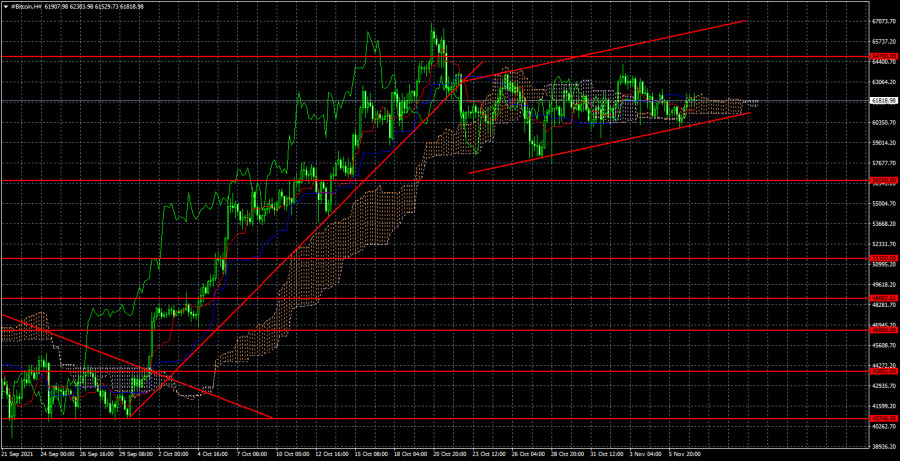
The pound/dollar pair also fell to its annual lows last week. However, in the case of the pound, the whole downward movement, which has been going on for about 8 months, absolutely does not look like a trend. Therefore, the whole downward movement can also be a normal correction against a global upward trend. And if so, then the upward movement can resume at any moment. The fundamental background for this pair looks even more confusing than for the euro/dollar pair. If everything is more or less calm in the European Union now, except for a new outbreak of the "coronavirus", then it simply cannot be quiet and calm in the UK. News about Brexit, about the "fuel crisis", about the "logistics crisis", about constant negotiations and skirmishes with the EU countries, about the "Northern Ireland protocol" are pouring in an incessant stream from the UK And recently, news has also begun to arrive that Wales is also going to seriously consider leaving the Kingdom in the next couple of years. Recall that Scotland is going to hold its independence referendum next year. Thus, the fundamental background from the UK leaves much to be desired and it can even be assumed that the fall of the pound in the last 8 months is due to it. However, this conclusion is very ambiguous, since in general the fundamental background is very extensive, and a lot of important news also comes from the United States. Therefore, it is not possible to draw an unambiguous conclusion about which factor is causing the pair to rise or fall. Therefore, we need to pay more attention to the technical picture and leave the "foundation" only for building hypotheses, which can then be confirmed or not confirmed by "technology". Last week, by the way, a very important event happened for the British pound. Unexpectedly, it turned out that the Bank of England could raise the key rate as early as November, without waiting for the complete curtailment of the quantitative stimulus program. And against the background of this news, the British currency collapsed like a stone, although it would be much more logical to see its strengthening since even in the States there is no question of raising the rate now. And if two of the 9 members already vote for its increase, it means that the rate may be raised at the next meeting. And a rate hike is the strongest bullish factor for the currency. Consequently, it turns out a situation in which we have repeatedly wondered why the pound is getting cheaper against the dollar so reluctantly. But when a factor appeared that could provide significant support to the pound, everything turned out exactly the opposite. However, we consider it a viable option, in which the wagering of this decision will begin in the new week. In other words, the pound will start to rise. Especially if there is a rebound from the support level of 1.3461. In this case, a "double bottom" formation will be formed. And even if an upward trend does not start after that, then a round of upward movement with a potential of about 500 points should be formed. If you look at the illustration above carefully, it becomes clear that the pair is constantly being adjusted. Therefore, we are not waiting for the pound to fall further and the dollar to rise. In the new week in the UK, there will be important macroeconomic information only on Thursday. The GDP report for September and the industrial production report for the same period will be published. However, in the current conditions, we believe that these reports will have virtually no impact on market behavior unless their actual values are very different from the forecasted ones, which may shock the market. Thus, the most important event of the week will certainly be the inflation report for October in the United States. And there may be surprises here, to which the market can react in any way. According to experts, inflation may rise to 5.7-5.8% y/y. And this is the maximum value of inflation over the past 30 years. Earlier, the US dollar strengthened on the growth of inflation, as it brought the moment of curtailing the QE program closer, but no one knows how it will be this time. Recall that after the "hawkish" Fed meeting, the dollar initially fell. And after the "hawkish" BA meeting, the pound was already falling. Thus, there may be little logic in the pair's movement after the publication of the consumer price index. Nevertheless, there should be a reaction, and it can greatly affect the weekly trend. We believe that further inflation growth is already dangerous for the US economy, so the dollar is unlikely to experience bouts of optimism. From our point of view, most factors continue to speak in favor of a new fall in the US currency.
Recommendations for the GBP/USD pair: The pound/dollar pair was in a downward movement on the 4-hour timeframe last week. Therefore, it is advisable to stay in short positions for the time being. However, at the same time, the further fall of the pair is completely not obvious. Therefore, if the price is fixed above the critical Kijun-sen line, then you should exit sell orders and consider buy orders in small lots. We believe that the fall of the pound last week was not justified, so this week an equally strong upward movement may begin with the goal of the Senkou Span B line, which now lies at the level of 1.3725. Explanations to the illustrations: Price levels of support and resistance (resistance /support), Fibonacci levels – target levels when opening purchases or sales. Take Profit levels can be placed near them. Ichimoku indicators(standard settings), Bollinger Bands(standard settings), MACD(5, 34, 5). The material has been provided by InstaForex Company - www.instaforex.com |
| Posted: 07 Nov 2021 07:30 AM PST
The European currency paired with the US dollar last week generally continued its downward movement and even updated its local minimum. The downward trend was also maintained after the European currency attempted to start a new upward trend after the ECB meeting the week before last. Thus, at this time, the price simply continues to be near its local lows, which are also annual lows. Therefore, the technical picture has hardly changed compared to the previous week. The European currency remains under market pressure, although the fundamental background has been and remains very contradictory. This is expressed by the fact that many fundamental events can be interpreted in absolutely different ways. For example, the recent meetings of the Fed and the ECB. The ECB has made it clear that it is ready to gradually curtail the PEPP program. However, everything will depend on the coronavirus pandemic, which has re-captured the European Union in recent months. At the same time, Christine Lagarde also made it clear that there is no talk of raising the rate even in 2022. At the same time, the Fed began to wind down its QE program, but it has already hinted several times that rates may start to rise next year. At first glance, the Fed has taken a more "hawkish" position, which should support the dollar. However, all the decisions taken by the Fed have long been known to the market, and they did not come as a surprise to it. The market has been waiting for QE to be curtailed for a long time, as inflation continues to rise and threatens to reach maximum levels in 30 years. Experts have long been sounding the alarm about rising prices and inflating the money supply, which leads to overheating of the economy and inflating "bubbles" in financial and commodity markets. Many are waiting for these "bubbles" to burst because the trillions of dollars printed by the Fed cannot pass unnoticed and without a trace for the economy. Thus, the US dollar remains in the risk zone, despite the tightening of monetary policy and a possible increase in rates. What awaits us next week? By and large, nothing. The calendar of macroeconomic events of the European Union is empty, except for the index of business sentiment from the ZEW Institute, which will be released on Monday. In the States, the situation is a little more interesting. Thus, during the whole week, traders will have almost nothing to pay attention to. This means that the volatility may again decrease to the standard 40-50 points per day and significantly complicate the pair's trading. As for the direction of movement, with such volatility in five trading days, quotes can rise or fall by 80-100 points. And this is provided that they will move in one direction. And if so, then we do not expect strong changes in the euro/ dollar exchange rate. From our point of view, the correction against the global upward trend continues at the moment. We have repeatedly drawn the attention of traders to the fact that a couple of years ago, the global downward trend, which lasted about 8 years, supposedly ended. Since everything in the economy is cyclical, it can be assumed that the global upward trend continues now, which may last another 4-5 years. Then the pair can continue to grow in the long term, as fundamental factors still do not speak in favor of the dollar, and the markets are still not eager to invest headlong into the US currency. Therefore, we still expect that the quotes will initially rise to the Senkou Span B line, near which the following question will be solved: a new upward trend or a new round of corrective movement? Given that the correction for the pair has been going on for 10 months, we may see another round of downward movement. Next week, new speeches by the heads of the central banks of the EU and the US, Christine Lagarde and Jerome Powell, are also possible. The information from them may be interesting. However, it is unlikely that it will differ much from the information that the markets already own. The heads of the Central Bank simply cannot share information with traders and investors every week that they do not yet know. This means that it is unlikely that Powell or Lagarde will be able to change the global mood of traders, which currently remains as neutral as possible. This is evidenced by COT reports, which show that now professional players have approximately an equal number of buy and sell contracts open.
Trading recommendations for the EUR/USD pair: The technical picture of the EUR/USD pair on the 4-hour chart is also as ambiguous as possible. There is no trend on the 4-hour timeframe, which is visible even to the naked eye. Therefore, the lines of the Ichimoku indicator currently carry little information, since this is a trend indicator. But at the same time, there is no flat at the moment. Rather, this movement can be called a "swing". And in such conditions, it is very difficult to trade a pair for a short time. Thus, either you should switch to the minimum TF and trade by levels, or you should work for a long time, but there are no corresponding signals for this yet. Therefore, we need to wait for the formation of these signals and wait for the volatility to increase and will be at least 60-80 points per day. Explanations to the illustrations: Price levels of support and resistance (resistance /support), Fibonacci levels – target levels when opening purchases or sales. Take Profit levels can be placed near them. Ichimoku indicators(standard settings), Bollinger Bands(standard settings), MACD(5, 34, 5). The material has been provided by InstaForex Company - www.instaforex.com |
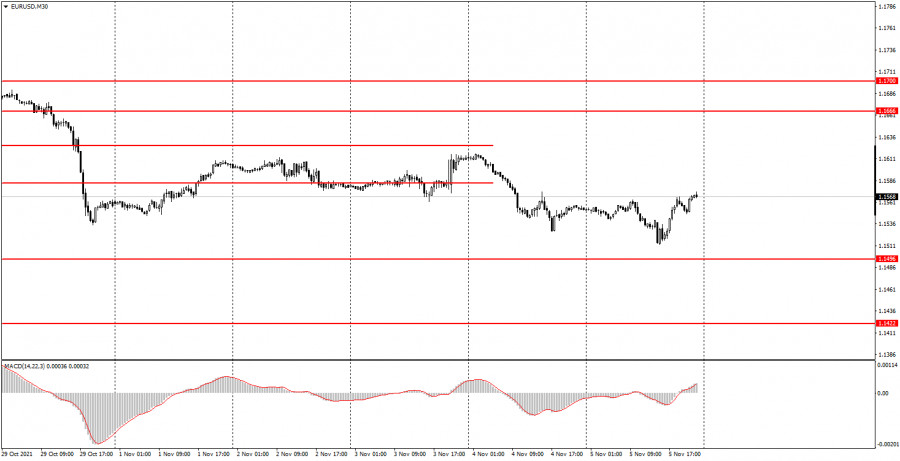
| Posted: 07 Nov 2021 07:28 AM PST Analysis of previous deals: 30M chart of the EUR/USD pair
The EUR/USD pair was trading fairly average on Friday. The volatility of the trading day was just over 60 points, which is a "normal" value for the euro/dollar pair. There was also no clear direction of movement during the day. Just as it has not been observed in general on the 30-minute TF over the past few weeks. Thus, the technical picture on this timeframe has not changed at all, even after such a crazy week. We remind novice traders that the results of the Federal Reserve meeting were summed up in the United States this week, after which the US dollar fell 40 points on Wednesday, and it rose by 90 on Thursday. An equally significant NonFarm Payrolls report was published on Friday, which, however, did not provoke the movement that the markets expected. In other words, the report turned out to be stronger than expected, but this did not cause a new rise in the US dollar. This is called an illogical market reaction, and this phenomenon also happens from time to time. Thus, there is still no trend, there is no trend, there is no trend line. 5M chart of the EUR/USD pair
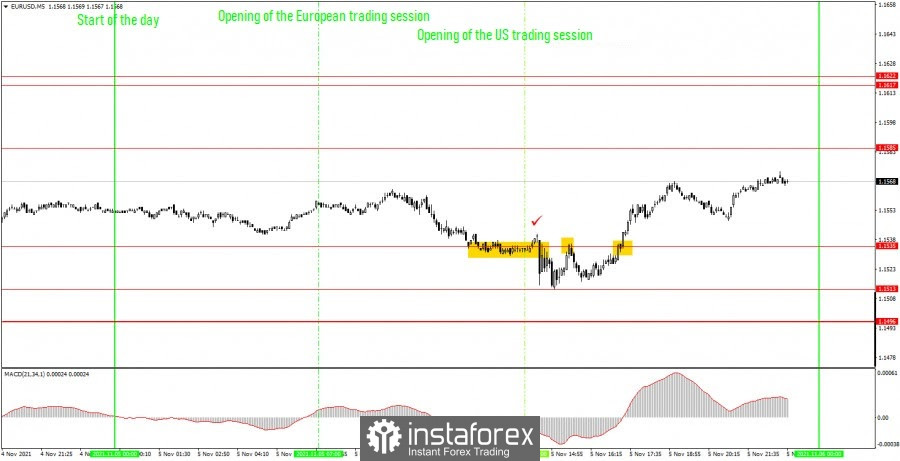
On the 5-minute timeframe, the movement on Friday was quite strange. Several trading signals were generated, but almost all of them had to be filtered out. Let's take a closer look at how to trade on Friday. The first sell signal was formed when the NonFarm Payrolls report was published in the US. In addition, an unemployment report was also published, which also turned out to be better than forecasts. However, the US currency managed to strengthen by only 20 points, and it was at this time that the rebound from the level of 1.1535 formally happened. There was no 1.1513 level on Friday yet, this level is the day's low. Thus, we do not work out the first signal. The second rebound from the level of 1.1535 happened a little later, but we would also advise ignoring it, because US reports turned out to be unequivocally in favor of the dollar, but the price was moving up at the time of the formation of this signal. Incongruity. But the last buy signal could be worked out, since by that time it had already become clear that traders had ignored important reports from America. However, the long position brought only 20 points of profit and it had to be closed manually, since the price could not reach the nearest level. How to trade on Monday: There is still no trend or horizontal channel on the 30-minute timeframe at this time. Therefore, the current movement still defies description. We still do not recommend tracking signals from the MACD indicator, but we advise you to wait for the formation of a trend line or trend channel. The key levels on the 5-minute timeframe for November 8 are 1,1496, 1,1513, 1,1535, 1,1585, 1,1617 – 1,1622. Take Profit, as before, we set at a distance of 30-40 points. Stop Loss - breakeven when the price passes in the right direction by 15 points. At 5M TF, the target can be the nearest level, if it is not located too close or too far away. If it is located– then you should act on the situation or work on Take Profit. Monday will be an absolutely boring day, since important macroeconomic events either in the United States or in the European Union are not planned for this day. Thus, volatility on this day can seriously decrease (up to 40 points, for example). Basic rules of the trading system: 1) The signal strength is calculated by the time it took to form the signal (bounce or overcome the level). The less time it took, the stronger the signal. 2) If two or more deals were opened near a certain level based on false signals (which did not trigger Take Profit or the nearest target level), then all subsequent signals from this level should be ignored. 3) In a flat, any pair can form a lot of false signals or not form them at all. But in any case, at the first signs of a flat, it is better to stop trading. 4) Trade deals are opened in the time period between the beginning of the European session and until the middle of the American one, when all deals must be closed manually. 5) On the 30-minute TF, using signals from the MACD indicator, you can trade only if there is good volatility and a trend, which is confirmed by a trend line or a trend channel. 6) If two levels are located too close to each other (from 5 to 15 points), then they should be considered as an area of support or resistance. On the chart: Support and Resistance Levels are the Levels that serve as targets when buying or selling the pair. You can place Take Profit near these levels. Red lines are the channels or trend lines that display the current trend and show in which direction it is better to trade now. The MACD indicator (14,22,3) consists of a histogram and a signal line. When they cross, this is a signal to enter the market. It is recommended to use this indicator in combination with trend lines (channels and trend lines). Important speeches and reports (always contained in the news calendar) can greatly influence the movement of a currency pair. Therefore, during their exit, it is recommended to trade as carefully as possible or exit the market in order to avoid a sharp price reversal against the previous movement. Beginners on Forex should remember that not every single trade has to be profitable. The development of a clear strategy and money management are the key to success in trading over a long period of time. The material has been provided by InstaForex Company - www.instaforex.com |


| You are subscribed to email updates from Forex analysis review. To stop receiving these emails, you may unsubscribe now. | Email delivery powered by Google |
| Google, 1600 Amphitheatre Parkway, Mountain View, CA 94043, United States | |


Comments