Forex analysis review
Forex analysis review |
- Gold short-lived rebound, back at support
- EUR/USD challenges a confluence area
- November 26, 2021 : EUR/USD daily technical review and trading opportunities.
- November 26, 2021 : EUR/USD Intraday technical analysis and trading plan.
- November 26, 2021 : GBP/USD Intraday technical analysis and significant key-levels.
- Bitcoin: Waiting for an Impulse? Catch BTCUSD at 52,000
- Ethereum vs Solana: why SOL becomes more attractive than Ethereum, and ETH becomes a coin for the rich?
- Trading signal for Ethereum (ETH) on November 26 - 29, 2021: buy above $4,062 (5/8)
- Black Friday did not bypass the crypto market: Bitcoin drops 20% from recently reached ATH
- Bullish end of the week for EURUSD.
- Daily analysis on Gold for November 26, 2021.
- Goldman Sachs stock price is ending the week under pressure
- EURUSD: Fed's hawkish rhetoric suggests limited potential for correction
- Weekly USDJPY analysis.
- Trading signal for DOW JONES 30 (#INDU) on November 26 - 29, 2021: buy in case of rebound off 34,765 (5/8)
- XRPUSD breaks below support.
- Bitcoin updates its local minimum and is approaching a rebound point
- Trading signal for GBP/USD on November 26 - 29, 2021: buy above 1.3343 (21 SMA)
- The crypto market is terrified of the new COVID-19 strain
- How to earn on EUR/USD changing trend?
- EUR/USD: dollar boosted by risk aversion, as COVID-19 clouds EU economic prospects
- Wave analysis and trading recommendation for BTC/USD 11/26/2021
- Video market update for November 26,,2021
- BTC analysis for November 26,.2021 - Downside pressure
- Analysis of Gold for November 26,.2021 - Upside breakout
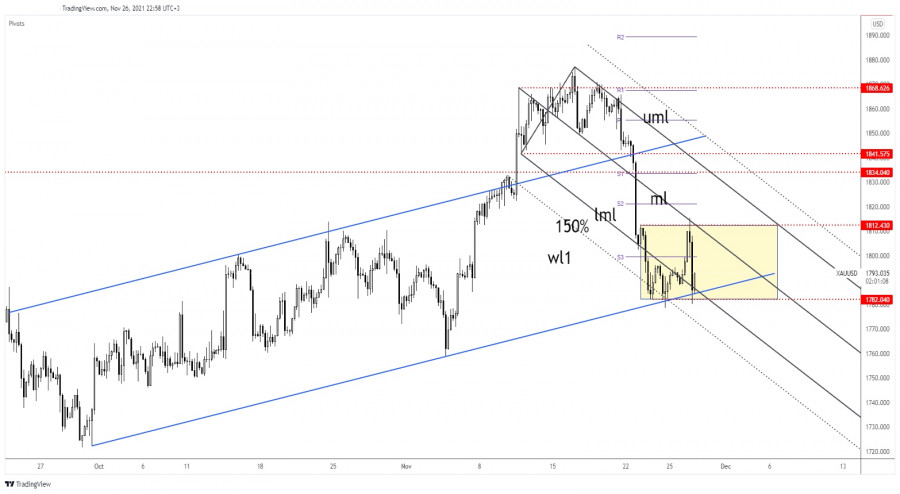
| Gold short-lived rebound, back at support Posted: 26 Nov 2021 01:12 PM PST Gold plunged from today's low of 1,815.57 and now it is traded at 1,793.03 above 1,780.41 today's low. In the short term, the yellow metal is trapped within a range pattern. Escaping from this formation could bring new trading opportunities. XAU/USD rebounded as the Dollar Index was into a corrective phase. Also, a new COVID-19 variant brought a risk-off sentiment into the markets, that's why the yellow metal was very attractive for buyers. XAU/USD range pattern
Gold is trappped between 1,812.43 and 1,782.04 levels. It has registered only a false breakout with great separation through 1,812.43 and above the median line (ml) siganling that the rebound could be over. The yellow metal tries to rebound after its sell-off, it has failed to close below the uptrend line and under 1,782.04. It could still increase as long as it stays above the uptrend line. XAU/USD predictionA valid breakdown below the uptrend line and under 1,782.04 could activate a deeper drop. Staying above the uptrend line followed by a valid breakout above the median line (ml) could announce potential leg higher. The material has been provided by InstaForex Company - www.instaforex.com |
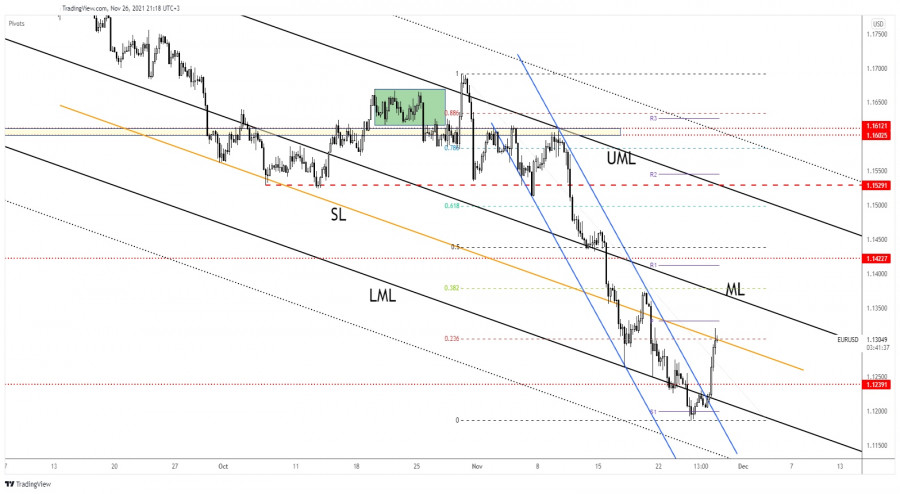
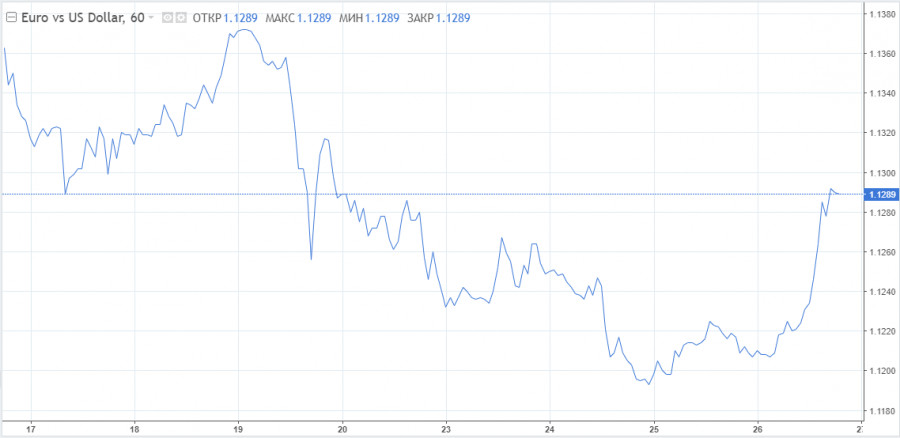
| EUR/USD challenges a confluence area Posted: 26 Nov 2021 11:55 AM PST EUR/USD rallied as the Dollar Index is in a corrective phase. Technically, the currency pair was somehow expected to rebound after its massive sell-off. DXY's further drop could push the pair higher. As you already know from my analysis, we have a strong negative correlation between the Dollar Index and EUR/USD. Fundamentally, the euro received a helping hand from the German Import Prices registered 3.8% growth beating the 2.0% expected. Meanwhile, the Private Loans rose by 4.1% versus 4.0% expected, while the M3 Money Supply jumped from 7.5% to 7.7%, though specialists expected a potential drop to 7.4%. EUR/USD natural rebound
EUR/USD challenges the confluence area formed at the intersection between the 23.6% retarcement level with the inside sliding line (SL). Till now, it has registered only a false breakout. Making a valid breakout through it and stabilizing above these upside obstacles may signal that the pair could extend its rebound. The price has shown oversold signs after failing to come back to test and retest the channel's downside line. Still, the current rebound could be only a temporary one. We can search for new short opportunities. EUR/USD outlookEUR/USD could extend its growth if it stabilizes above the 23.6% retracement level. The median line (ML) is seen as the next upside target. On the other hand, failing to close and stabilize above 23.6% may signal that the rebound is over. The material has been provided by InstaForex Company - www.instaforex.com |
| November 26, 2021 : EUR/USD daily technical review and trading opportunities. Posted: 26 Nov 2021 10:25 AM PST
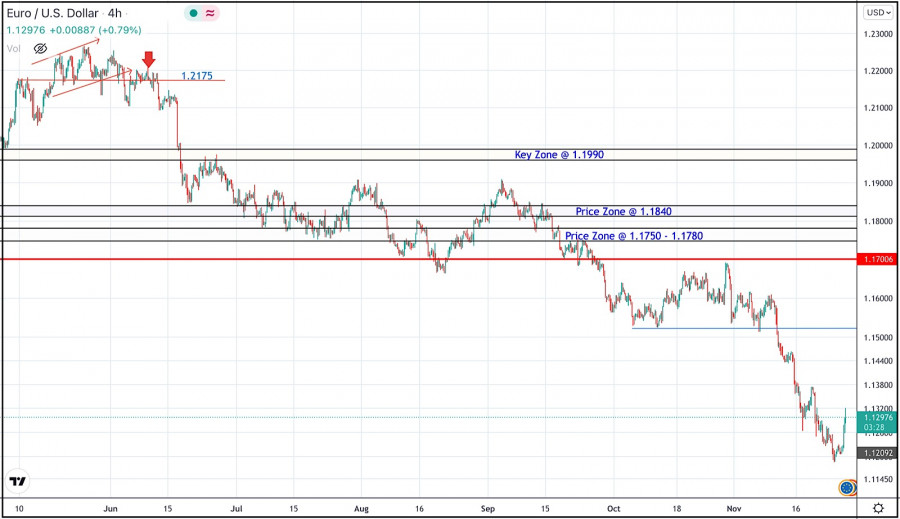
Recently, Persistence below the depicted price zone of 1.1990 indicated further downside movement towards 1.1840 and 1.1780 where a sideway consolidation range was established. During last week, the EURUSD pair has been trapped within a narrow consolidation range between the price levels of 1.1780 and 1.1840. A bullish breakout was executed above 1.1840 shortly after. Temporary Upside pullback was expected towards 1.1990. However, re-closure below the price level of 1.1840 has initiated another downside movement towards 1.1780 which failed to hold prices for a short period of time before significant upside movement was presented into market. Intraday traders were advised to wait for candlestick closure above 1.1780 - 1.1840 for another ascending swing to be initiated. However, immediate downside selling pressure brought the pair down below 1.1700. More downside movement took place towards the price level of 1.1600 where temporary bullish rejection has been maintained for some time. Shortly after, Market price slided below 1.1700 and 1.1600. This has enhanced further decline towards 1.1500. Currently, the price zone around 1.1500 stands as a prominent supply-zone to be watched for SELLING pressure and a possible SELL Entry upon any upcoming ascending movement. Moreover, it is not advised to add new SELL Entries as the pair already looks oversold. The material has been provided by InstaForex Company - www.instaforex.com |
| November 26, 2021 : EUR/USD Intraday technical analysis and trading plan. Posted: 26 Nov 2021 10:15 AM PST
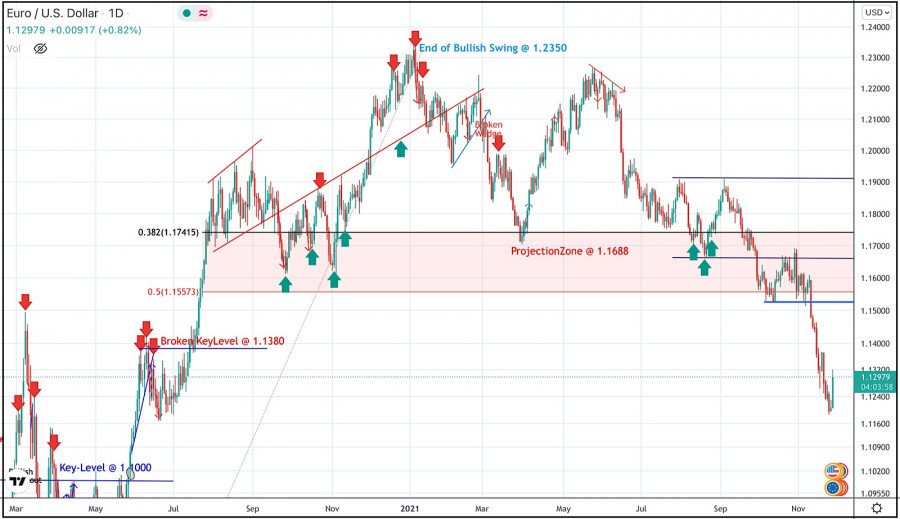
The bullish swing that originated around 1.1650 in August, failed to push higher than the price level of 1.1900. That's why, another bearish pullback towards 1.1650 was executed. Bullish signs were expected around the price levels of 1.1650-1.1700 for sometime as it corresponded to a recent previous bottom. However, extensive bearish decline has pushed the EURUSD pair towards 1.1600 and lower levels was reached. Shortly after, significant bullish recovery has originated upon testing the price level of 1.1570. The recent bullish pullback towards 1.1650-1.1680 was expected to offer bearish rejection and a valid SELL Entry. Significant bearish decline brought the EURUSD pair again towards 1.1550 levels which stood as an Intraday Support zone. Hence, sideway movement was demonstrated until bearish decline occurred towards 1.1325. Please note that any Bullish movement above 1.1500 should be considered as an early exit signal to offset any SELL trades. The price levels around 1.1520 remain a reference zone that needs to be re-visited when the current bearish momentum ceases to exist. The material has been provided by InstaForex Company - www.instaforex.com |
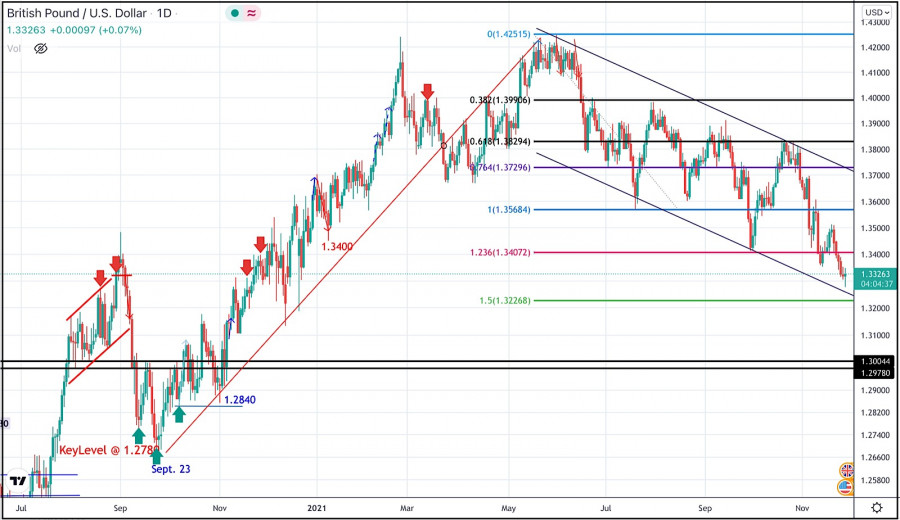
| November 26, 2021 : GBP/USD Intraday technical analysis and significant key-levels. Posted: 26 Nov 2021 10:14 AM PST
The GBPUSD pair has been moving sideways with some bearish tendency while bearish breakout below 1.3600 was needed to enhance further bearish decline. On the other hand, the nearest SUPPLY level was located around 1.4000 where bearish rejection and a valid SELL Entry was anticipated. Bearish breakout below 1.3680 enabled further bearish decline towards 1.3400 which corresponded to 123% Fibonacci Level of the most recent bearish movement. This was a good entry level for a corrective bullish pullback towards 1.3650 and 1.3720 which was temporarily bypassed. Shortly after, the pair was testing the resistance zone around 1.3830 where bearish pressure originiated into the market. Currently, the short-term outlook is bearish as long as the pair maintains its movement below 1.3400. Another bearish visit is expected towards 1.3400 where significant bullish rejection was expressed as it corresponded to significant Fibonacci Expansion Level. The current bearish momentum will probably enable more downside extension towards 1.3270. On the other hand, the price level of 1.3570 stands as an intraday resistance level to be watched either for bearish reversal or a continuation pattern upon any upcoming visit. The material has been provided by InstaForex Company - www.instaforex.com |
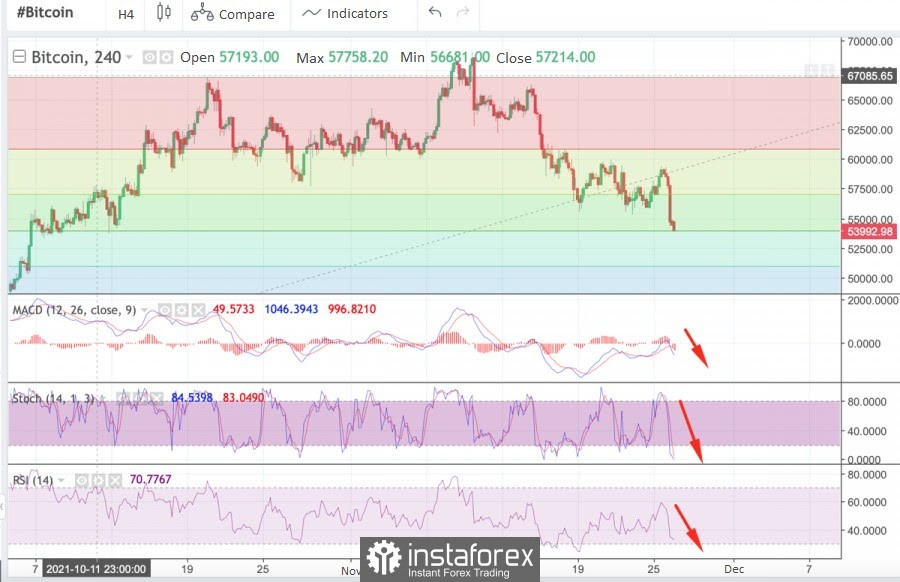
| Bitcoin: Waiting for an Impulse? Catch BTCUSD at 52,000 Posted: 26 Nov 2021 09:13 AM PST Black Friday suddenly turned into a red Friday for the cryptocurrency market. Bitcoin very skillfully bounced off the resistance of the 55,842.84 - 59,283.67 corridor and broke through its support. Now catch BTCUSD at $52,000 per coin. What became the catalyst and how dangerous it is for the crypto market? African Strain of Coronavirus or Thin Market?Markets were shocked by the news of the discovery of a new African strain of coronavirus on Friday. It is distinguished by a large number of still unexplored mutations, as well as a higher propagation rate. Stock and commodity markets collapsed. Does this mean that bitcoin, followed by other cryptocurrencies, also collapsed amid the flight from risk? Perhaps. But here, I think, it was not without the effect of a thin market due to the weekend in the United States. I'm not sure if this works the same on cryptocurrency exchanges as it does on the stock exchange, but I won't completely rule out the impact. Is it worth buying back the fall?Analysts point out that Bitcoin could fall 20% from record highs and this is a great opportunity to "buy back the fall." For large market participants, it may be so, but for private traders, this is clearly not the best opportunity. Catching falling knives in the middle of the range is very risky for a small capital. But when it will be possible to consider purchases, it is when the price reverses in the area of $52,000 per coin. The nearest support zone is visible there. I think the price may stop here. However, it is not necessary to open deals before a clear reversal is formed. It's such a time now where anything can happen locally. Bloomberg claims bitcoin is "bearish"While some are recommending buybacks, popular trader and podcast host Scott Melker warned against following the crowd expecting to buy out even lower levels. Funding rates on exchanges are a sign that sales are likely not over yet. They are still high despite the 24-hour liquidation volume approaching $700 million. Melker also drew attention to an unusual correlation between the US dollar and bitcoin. He believes, as already noted above, that this is due to the impetus given to the market by fears around the virus. Experts usually argue that Bitcoin tends to be inversely correlated with the US dollar, which, incidentally, collapsed on Friday against a basket of currencies. However, now bitcoin has fallen along with the dollar index markets - the correlation (if any) turned out to be direct. There is a strange escape from risk. Or is it just Black Friday?Nevertheless, a similar trend was already observed when at the end of November 2020, Bitcoin fell to about $16,400, but then recovered and for the first time in three years crossed the level of $20,000 per coin. So maybe not everything is so critical yet. At least, in my opinion, there is no need to panic until the area near $52,000 per bitcoin is broken. Meanwhile, other analysts argue that a heavy block of support in the form of buyers' positions at $53,000 stands in the way of further losses of BTCUSD. This is roughly the area that corresponds to Bitcoin's $1 trillion market cap.
|
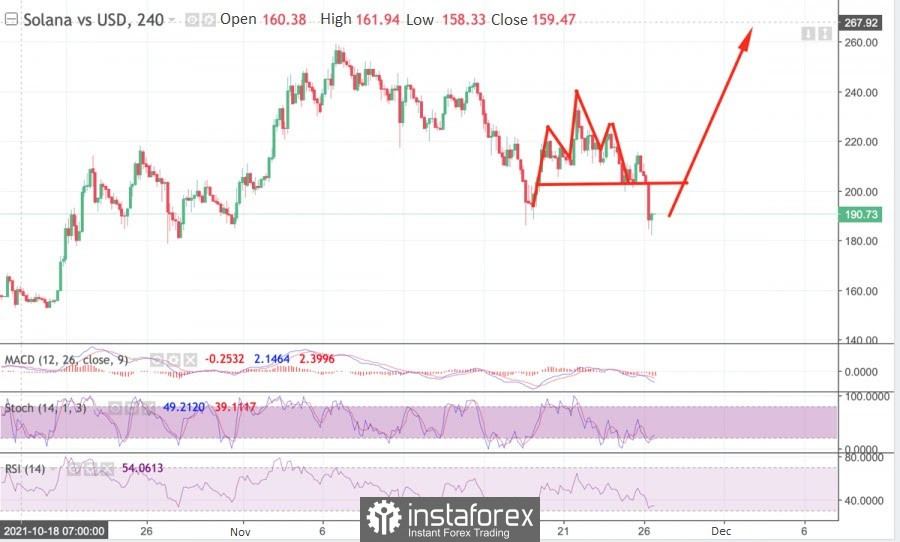
| Posted: 26 Nov 2021 08:48 AM PST The Ether ecosystem has recently become the main source of the coin's price growth thanks to the explosive growth of the DeFi and NFT sectors. However, as of November 2021, the altcoin has no visible competitors, and many potential "ETH killers" did not compete and dropped out of the race for the decentralized finance sector. Despite this, the Solana token is able to compete with ether due to the speed and cost of transactions, as well as the good pace of development of the blockchain. All these processes are taking place against the backdrop of the formation of ETH as a full-fledged second power in the cryptocurrency market. Following the status, the main altcoin loses many of the advantages of its previous status, such as low transactions and network availability for all categories of users. In theory, this means that part of the ETH 1.0 audience will be looking for an alternative, and an excellent way out of the situation would be to switch to SOL. However, first of all, let us consider in what way the broadcast has become not as accessible as before. A clear example of the growth of the ETH network was the statement of the Director of BlockFi, who announced that the company will no longer provide services for the free withdrawal of the main altcoin. The reason for this decision is the significantly increased transaction costs. In other words, fees on the Ethereum network have skyrocketed, and even the London update failed to address the issue. Now, for the first withdrawal of funds from the platform, you will have to pay a commission of 0.015 ETH, which is $64. A similar situation occurs on many decentralized platforms based on ether.
Ultimately, this will lead to an outflow of audience from ETH-based projects and the search for more profitable alternatives. The developers will follow the preferences of the audience, and it is likely that the main altcoin will lose part of its audience. I note right away that there is no need to worry since the increased deflationary component of the coin will allow it to attract much more institutional investment. Altcoin Solana can become an effective alternative to ETH, since it consumes a minimum amount of energy, and, accordingly, the fees on the network are much lower. An illustrative example was provided by the project developers, according to which one transaction on the altcoin network consumes less energy than 2 Google searches. For example, at the moment, ETH consumes 644 million Joules, while SOL is only 1,836 Joules. The situation is likely to change with the transition to the ETH 2.0 version, but Solana's competitiveness is striking and as of November 2021, this altcoin is a profitable alternative to ETH.
To top it off, the architecture of the Solana project allows smart contracts to process many more transactions in a shorter time frame and at a lower cost. In the near future, we can expect a change in the ratio of the number of projects and the cost of blocked funds in DeFi projects based on ETH and SOL. Analyzing the possibility of such a trend, it is worth emphasizing that as ether has surpassed bitcoin in terms of growth, so Solana can surpass ether. Technically, the potential of the coin is in no way inferior to ETH. The material has been provided by InstaForex Company - www.instaforex.com |
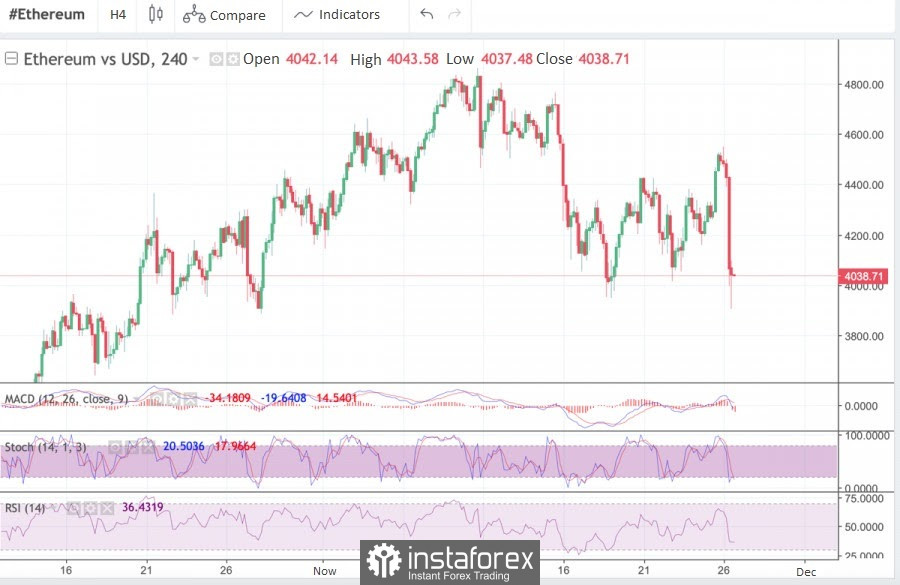
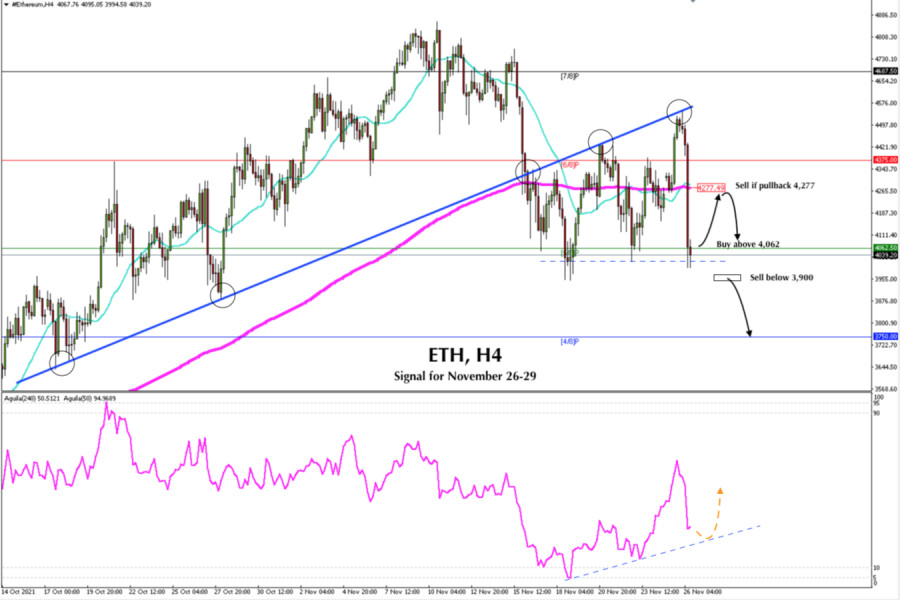
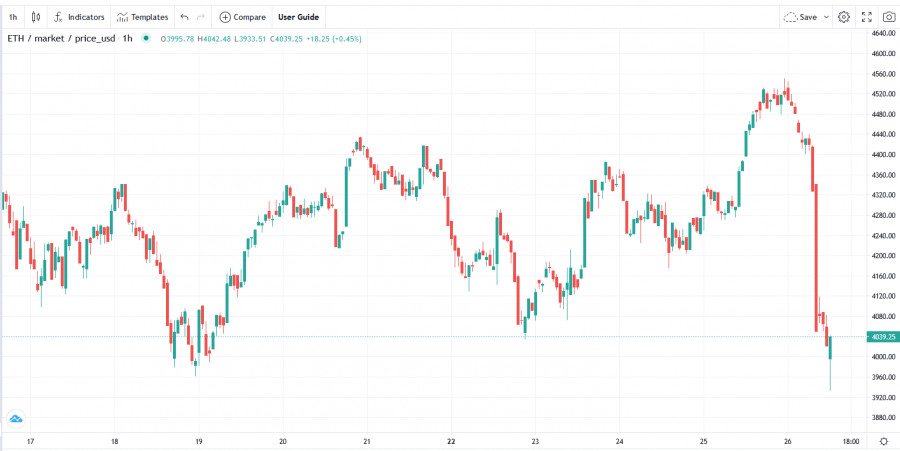
| Trading signal for Ethereum (ETH) on November 26 - 29, 2021: buy above $4,062 (5/8) Posted: 26 Nov 2021 07:48 AM PST
In the last hours, Ethereum (ETH) has lost more than 12% due to risk aversion on the part of investors and the increase in panic regarding a new variant of Covid. According to the 4-hour chart, it can be seen that Ethereum is consolidating around the psychological level of $ 4,000. It is likely that in the next few hours, there is a technical bounce towards the 21 SMA located at 4,277. Around the 21 SMA will be a good opportunity to sell ETH targeting 4,039 to 4/8 murray at 3,750. On the other hand, if Ethereum consolidates below the key level of 3,900, we could see acceleration of the downward movement towards the pivot point of 3,750. After breaking the uptrend channel on November 15, Ether has been testing this resistance more than 3 times. Because it failed to break, it is now retreating and it is a sign that in the short term we could see a drop to the level of 3,500. Considering the bearish outlook for BTC, the price of Ethereum is expected to follow the same trend and fall to the demand zone around 3,750. Our trading plan for the next few hours is to sell in case of a pullback to 21 SMA (4,277) with targets at 4,065 and up to 3,750. On the contrary, if it consolidates above the 21 SMA at 4,300, we can buy with targets towards 4,687 (7/8). Support and Resistance Levels for November 26 - 29, 2021 Resistance (3) 4,596 Resistance (2) 4,327 Resistance (1) 4,159 ---------------------------- Support (1) 4,062 Support (2) 3,750 Support (3) 3,542 *********************************************************** A trading tip for ETH November 26 - 29, 2021 Buy above 4,062 (5/8) with take profit at 4,277 (200 EMA), stop loss below 3,920. The material has been provided by InstaForex Company - www.instaforex.com |
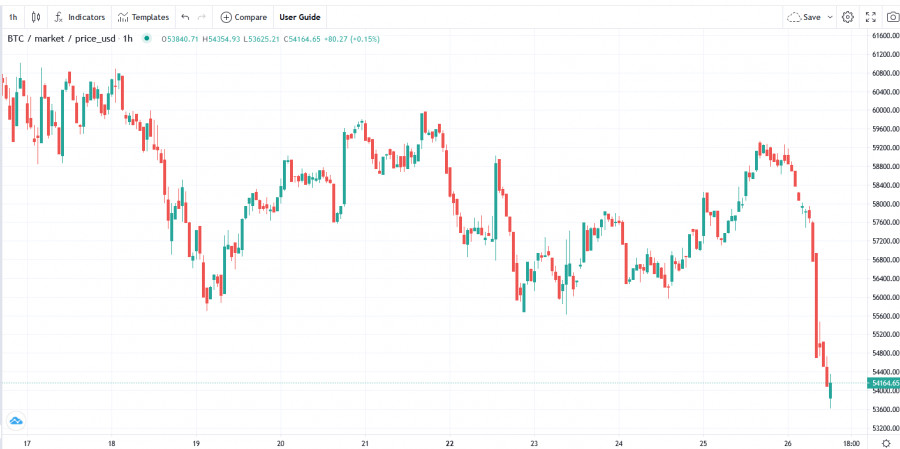
| Black Friday did not bypass the crypto market: Bitcoin drops 20% from recently reached ATH Posted: 26 Nov 2021 07:36 AM PST Bitcoin is down 20% from all-time highs reached earlier this month as many investors begin to take profits as a new variant of the coronavirus is causing panic and sell-off of risky assets. Coronavirus has reached BitcoinThe world's largest cryptocurrency fell 8.9% to 53,624 on Friday, while Ether, the second largest digital currency, fell more than 12%. A new variant of the coronavirus strain was recently identified in southern Africa, which led to the closure of a number of long positions. The option of quarantining European countries and introducing stricter restrictions up to a lockdown now does not seem as ghostly as it used to be. This week, many European politicians talked about such a need if the situation with the spread of the virus gets worse, and then a new more infectious, and rapidly spreading strain only adds to the nervousness and uncertainty. Frankly speaking, the correction has been asking for a long time, but many expected that it would not be as fast and aggressive as in May of this year. Currently, the rate is near its 100-day moving average of $53,940, which served as support during the pullback at the end of September this year. But, judging by the mood, the matter will not be limited to it. We will talk about the technical picture a little below. Some traders expected a different development of events and looked at the market rather optimistically, hoping for a Santa Claus Rally, but now the chart suggests that the weekend will be rather tense. Keep in mind that Bitcoin has been out of favor lately due to US tax reporting requirements for digital currencies and China's fierce regulatory constraint. Surely, this will continue to affect the risk appetite in the speculative sector. However, don't panic. Let's take a look at a few graphs:
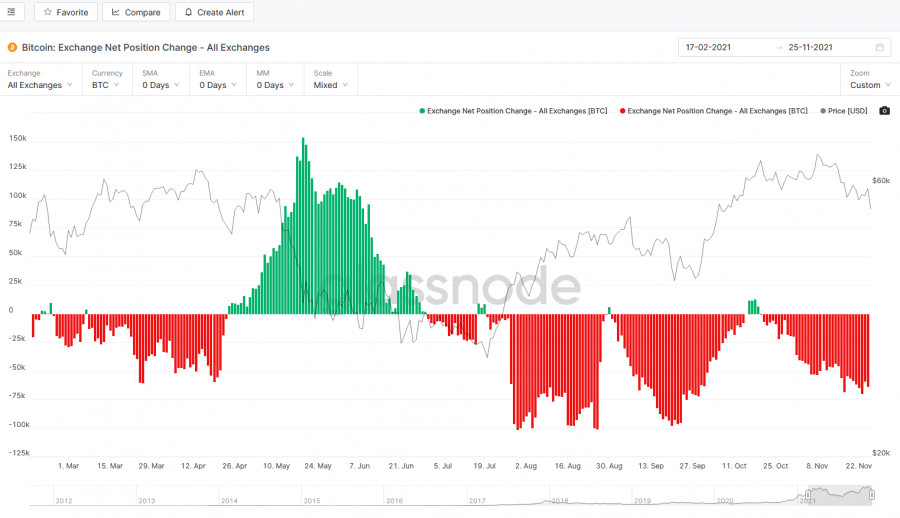
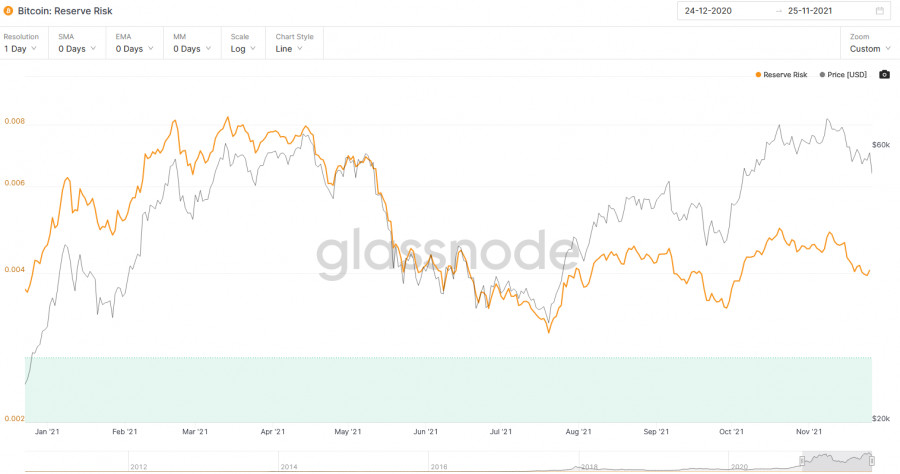
It can be seen that coin holders are not yet rushing to exchanges, which will be additional evidence of the growing hysteria in the cryptocurrency market. The Exchange Net Position Change - All Exchanges chart shows no significant influx into exchanges, which confirms the wait-and-see attitude of many players and their belief in the future of cryptocurrencies. There are no major changes in Bitcoin: Reserve Risk. On the contrary, the attractiveness of cryptocurrencies only grows as the rate depreciates - this suggests that traders will actively buy coins using lower prices. Many expect such a market decline to be nothing more than a correction in an upward trend. Do not forget that today our options for bitcoin and ether are expiring, which can only heat up the markets and lead to a surge in volatility.
Governor of the Bank of England Andrew BaileyIn conclusion, I would like to say a few words about a recent interview with the Governor of the Bank of England, Andrew Bailey, who said that El Salvador's decision to make bitcoin equal to the national currency is worrisome because consumers will clearly be affected by its volatility. "I am worried that a country might choose bitcoin as its national currency," Bailey said, answering a question during a speech at the University of Cambridge's student union. "What worries me the most is whether the citizens of El Salvador understand the nature and instability of the currency they own." He added that the International Monetary Fund, which monitors risks to global financial markets, is unhappy with El Salvador. The Bank of England is currently exploring the possibility of creating its own digital currency system to simplify online payments and provide consumers with a secure way to store cash that will keep up with blockchain technology. "There is a strong case for digital currencies, but we think they need to be stable, especially if they are used for payments," Bailey said. As for the technical picture of BitcoinThe failure of the $55,700 support creates a lot of trouble for traders. Ahead is the test of the $53,190 level, which is located exactly behind the 100-day moving average. Going beyond this range will increase the panic, which will push the first cryptocurrency into the $50,200 and $47,200 areas - that's where you really should be afraid of what is happening, since below this level we have only a 200-day moving average. Its breakdown will be a signal for the formation of a bearish trend. It will be possible to talk about the stabilization of the situation only after the bulls manage to return above $55,700 and gain a foothold in this range with the prospect of recovery to the $60,000 area.
As for the technical picture of the EtherAt the moment, its pullback is not as significant as that of Bitcoin, for the reason that the cryptocurrency has grown significantly in the past few days. Now they are actively buying ether around the level of $3,900, which is generally not surprising - I have repeatedly drawn attention to this support. Its breakdown will not be a catastrophe either, as the 100-day moving average passes below, which is slightly above the support of $3,680. But the breakdown of this area will significantly worsen the prospects for ETH recovery in the near future, which will add panic to the market and bring it down to the $3,400 area. It will be possible to talk about the stabilization of the situation only after the bulls manage to return above $4,140 and consolidate on this range with the prospect of recovery to the $4,360 area.
In any case, the weekend is pretty hot. As long as the whole world is happy to spend money on Black Friday, the markets will do their dirty work. The material has been provided by InstaForex Company - www.instaforex.com |
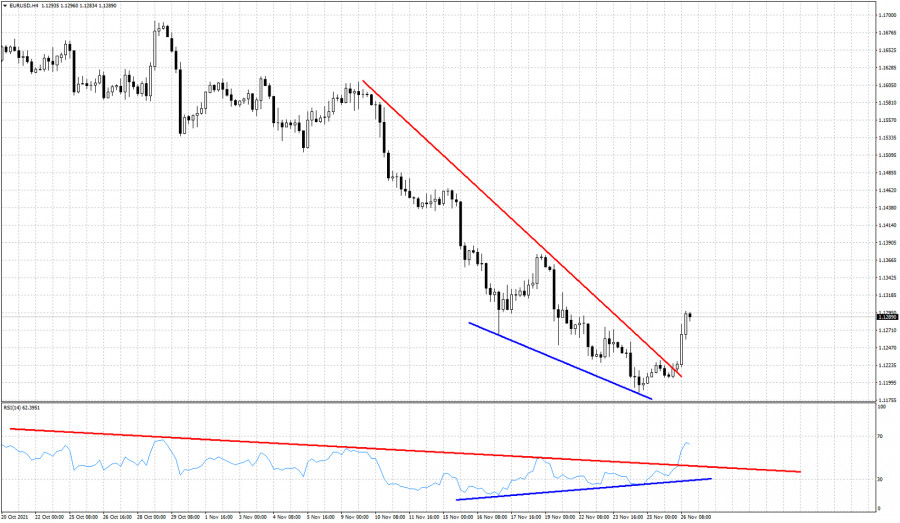
| Bullish end of the week for EURUSD. Posted: 26 Nov 2021 07:20 AM PST In yesterday's analysis we warned bears that the time for a trend reversal in EURUSD was close. Price has broken today above and out of the downward sloping wedge pattern it was in and is trading towards 1.13.
Blue lines - bullish divergence The RSI has warned us on time of the imminent reversal. Price has now broken the resistance trend line and has moved above the recent high of 1.1275. This constitutes a trend change, at least for the near term. Taking into consideration the fact that we are at a major turning point, we warned traders that between 1.12 and 1.13 which was our target area, we turned neutral if not slightly bullish. There is huge potential for the upside in EURUSD. It is still too early to talk about a major low. Bulls need to take this one step at a time. Currently I believe that they start taking control of the trend. The material has been provided by InstaForex Company - www.instaforex.com |
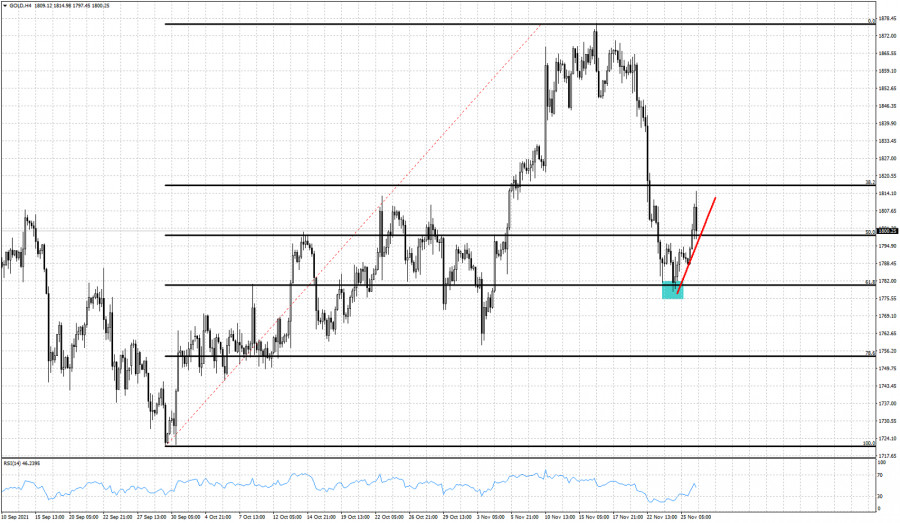
| Daily analysis on Gold for November 26, 2021. Posted: 26 Nov 2021 07:14 AM PST Gold price is trading above $1,800 after reaching earlier as high as $1,814. Gold price is showing reversal signs as we expected. In our previous posts we noted the increased chances of a trend reversal in Gold as the double bottom around $1,780 and the bullish RSI divergence signals, were enough to make me bullish.
Blue rectangle - support Red line -expected path Gold price so far has been following our expected path higher. Price has held the 78.6% Fibonacci retracement and is now moving higher. Resistance is at $1,815 where we also find the 38% Fibonacci retracement of the latest decline from $1,870. Price has started making higher highs and higher lows. In order for trend to change this pattern must continue higher and break above $1,815. The RSI has started turning higher in the 4 hour chart and since it has not reached the overbought area, there is still room for some upside. The material has been provided by InstaForex Company - www.instaforex.com |
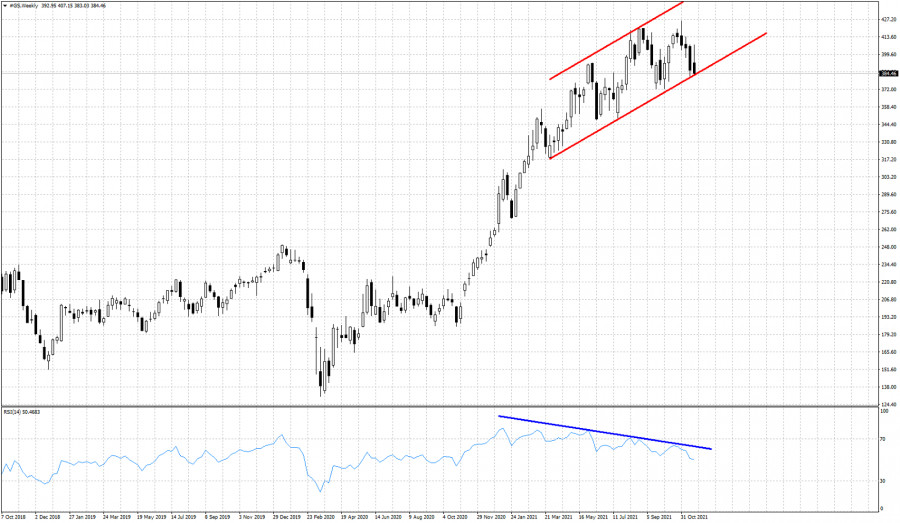
| Goldman Sachs stock price is ending the week under pressure Posted: 26 Nov 2021 07:06 AM PST In our analysis yesterday on the stock price of Goldman Sachs we noted that at current levels we prefer to be neutral if not slightly bearish. The chances of a major reversal are high and I expect to see more downside.
Blue line- bearish divergence Goldman Sachs stock price continues to respect the red channel. Price is now challenging the lower channel boundary just above $380. As we noted in our previous posts, the bearish RSI divergence was a key characteristic that made us expect a reversal lower. Breaking below $380 will increase chances of price moving towards our target area of $320-$300. The material has been provided by InstaForex Company - www.instaforex.com |
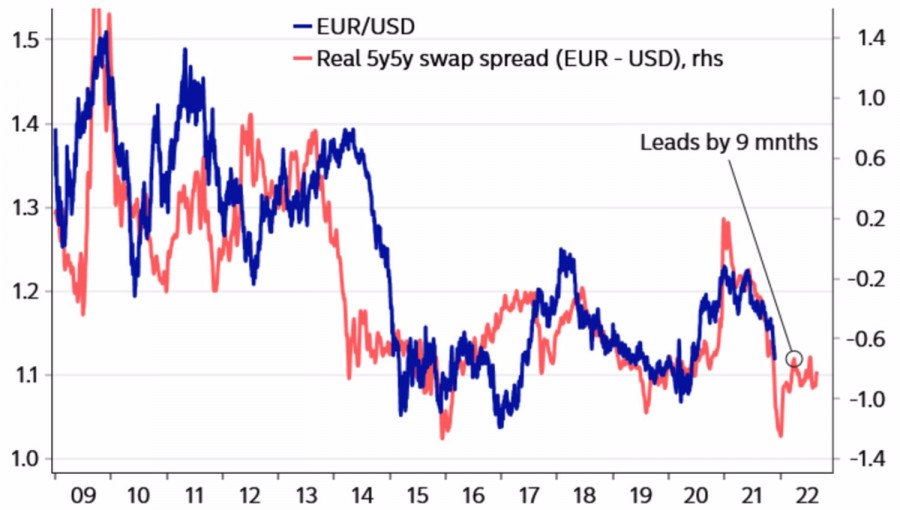
| EURUSD: Fed's hawkish rhetoric suggests limited potential for correction Posted: 26 Nov 2021 07:03 AM PST The idea of central bank independence looks good, especially against the background of Turkish President Recep Tayyip Erdogan's interference in his activities and the related currency crisis in the country, but it often comes under a flurry of criticism. If the government and the head of state serve the people, is there a group of people who do not serve him? In practice, the Central Bank acts in tandem with the executive branch, and the Fed sets this example. After being appointed as the chair and vice-chair of the Federal Reserve, both Jerome Powell and Lael Brainard vowed to U.S. President Joe Biden that they would do their best to fight inflation. They were echoed by a whole chorus of FOMC representatives, and as a result, markets considered the Fed's rhetoric "hawkish" and lowered the EURUSD quotes to the lowest levels since summer 2020. By the week of November 26, investors realized that "doves" could cry not only in the U.S. but also in Europe and began to take profit on shorts. The pair bounced to the top of the 12th figure, although it still looks overvalued in the medium and long term. Dynamics of EURUSD and interest rate swap differential
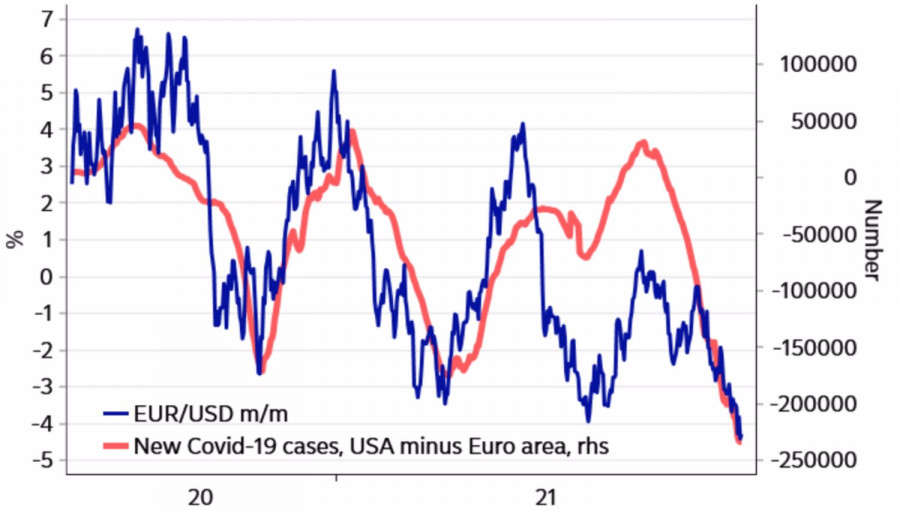
Of course, the acceleration of German inflation to 5% and European inflation to 4.4% may scare many euro bears. Just as the risks of the ECB's "hawkish" rhetoric at the December 2 meeting. Nevertheless, the core CPI in the currency block, according to Bloomberg experts, will grow slightly above the target by 2.2%, which indicates that the main driver of inflation growth is energy prices. If they remain the same as at present, the CPI will begin to slow down in the second half of 2022. And significantly. The ECB's patience policy is justified and the best thing Christine Lagarde and her colleagues can do in December, is to announce the completion of PEPP in March and an increase in APP purchases by €20 billion per month. The markets know about all this, they are waiting, so it is unlikely that this kind of news can change the trend. The euro is under pressure from the fourth wave of COVID-19 in Europe and rumors of a new virus strain from South Africa. The deterioration of the epidemiological situation and risk appetite, which is manifested in the fall of world stock indices, is a clear negative for the bulls on EURUSD. This speaks of the limited potential for the correction of the main currency pair. Dynamics of EURUSD and the ratio of infections in the USA and the Eurozone
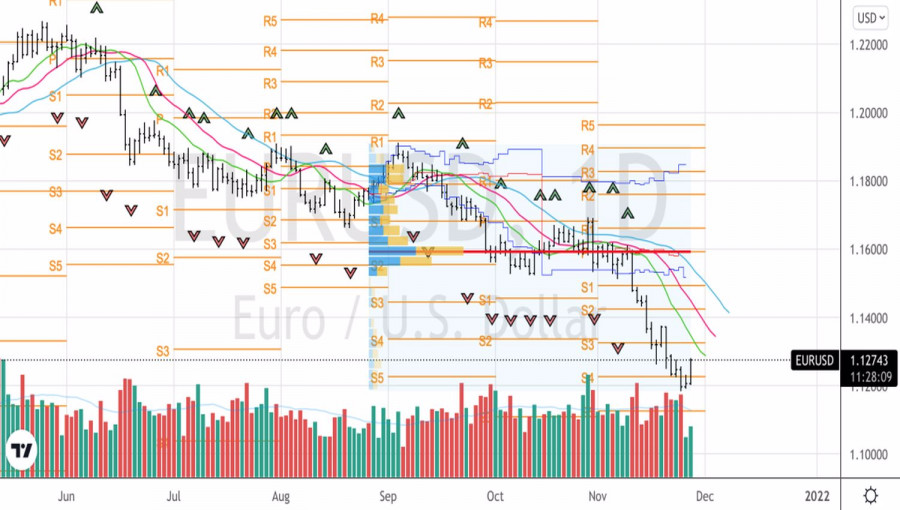
It cannot be said that the attention of investors in the week to December 3 will be completely focused on the Eurozone. The release of U.S. employment data for November will be a litmus test of what the Fed will do at its last meeting in 2021. The growth of Nonfarm Payrolls by 563,000 as expected by Bloomberg experts, coupled with the acceleration of average salaries to 5% YoY, are strong arguments in favor of a faster tapering of QE than is currently assumed. Technically, the rebound from the pivot point at 1.122 allowed the bulls to launch a counterattack. Nevertheless, there is no reason to doubt the strength of the downward trend for EURUSD, therefore unsuccessful assaults of resistances at 1.133 and 1.142 should be used for selling. EURUSD, Daily chart
|
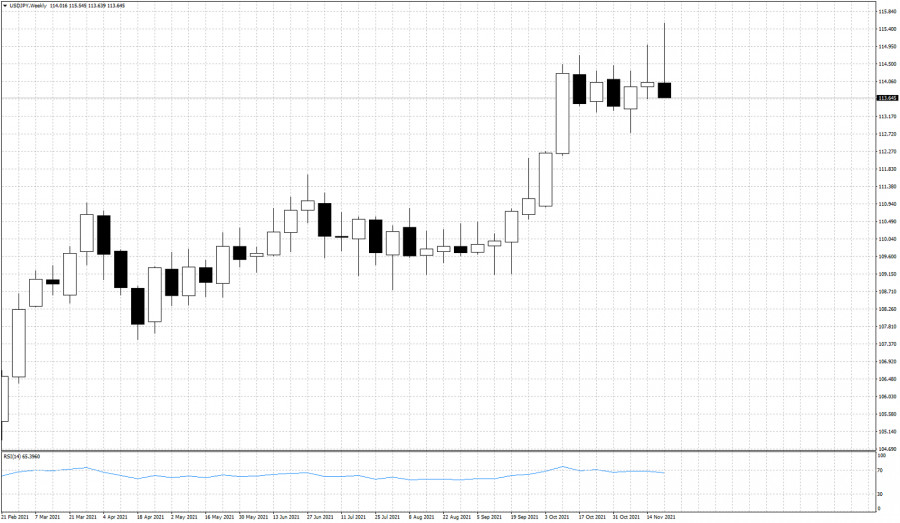
| Posted: 26 Nov 2021 07:02 AM PST In our last week's USDJPY analysis we warned traders of the bearish hammer candlestick pattern that we noticed in the weekly USDJPY chart. However this week started on a very different note with a strong Dollar and price making new higher highs. The funny thing with weekly charts is that traders need to be patient and wait and see where the weekly candle closes. This week was something like a bad surprise for USDJPY bulls.
USDJPY not only has formed another bearish hammer candlestick pattern, price is below last week's close and we are very close to breaking below last week's lows. Despite making a new higher high, this does not look sustainable by bulls. The bullish trend is weak and I continue to support a multi week pull back in USDJPY. Traders need to be cautious. The material has been provided by InstaForex Company - www.instaforex.com |
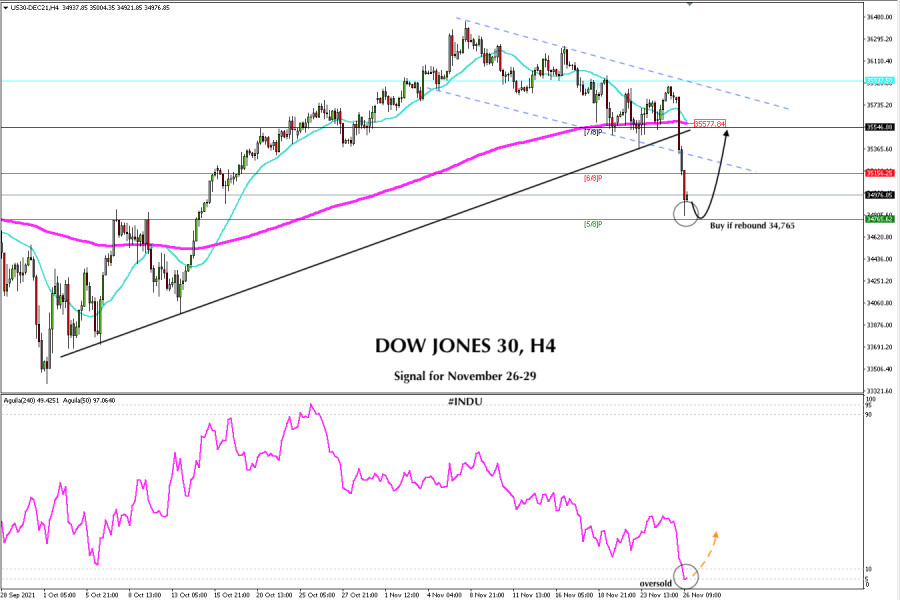
| Posted: 26 Nov 2021 07:01 AM PST
In the early hours of the American session, the Dow Jones 30 Technology Index (#INDU) is bouncing above 5/8 of murray located at 34,765. In the last 12 hours, the Dow Jones has lost more than 900 points reaching oversold levels, the biggest drop in daily charts. According to the minutes of the US Federal Reserve, lawmakers said they would be open to increase the pace of tapering the bond-buying program and move more quickly to raise interest rates if high inflation persists. This information convinced investors to stop investing in industrial stocks and shift focus towards high-tech stocks, denting the strength of the Dow Jones index. In the 4-hour chart, we can see that the Dow Jones sharply broke the uptrend channel formed since October 1. This is a negative sign and its downward trend is likely to continue in the coming days. But first we should expect a technical bounce towards the 200 EMA located at 35.577. The eagle indicator on November 26 touched the 5-point level which signals an imminent technical rebound. Supported by this indicator, we must buy the Dow Jones 30 in the next few hours with targets at 35,156 and up to the 200 EMA at 35,577. Our trading plan for the next few hours is to buy above 5/8 at 34,765. We should expect the DJ30 to consolidate around this support to buy again targeting 35,156 and up to 200 EMA at 35,540. Support and Resistance Levels for November 26 - 29, 2021 Resistance (3) 35,281 Resistance (2) 35,156 Resistance (1) 35,000 ---------------------------- Support (1) 34,765 Support (2) 34,530 Support (3) 34,375 *********************************************************** A trading tip for DOW JONES 30 November 26 - 29, 2021 Buy in case of rebound off 34,765 (5/8) with take profit at 35,156 (6/8) and 35,546 (200 EMA), stop loss below 34,700. The material has been provided by InstaForex Company - www.instaforex.com |
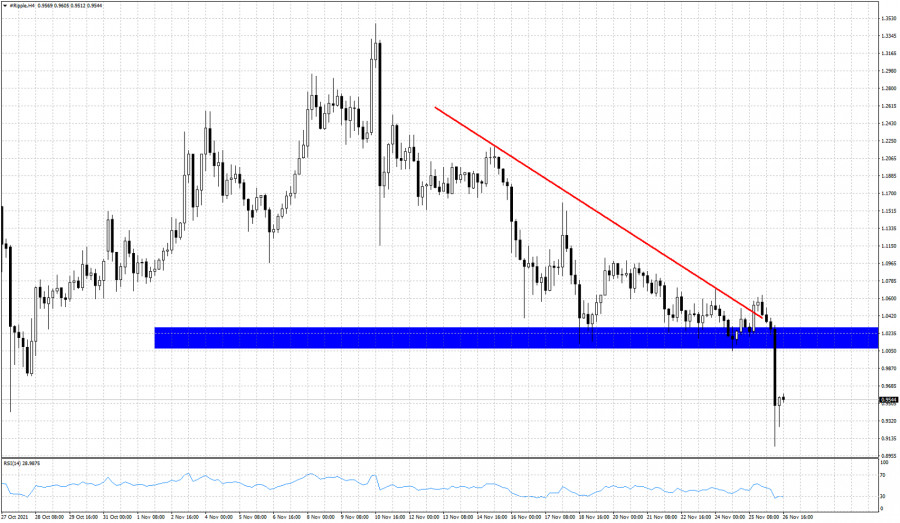
| Posted: 26 Nov 2021 06:57 AM PST In previous posts we noted the bearish pattern in XRPUSD as it had formed a descending triangle pattern. Price was respecting the support around the $1 price level. However the bounces where getting weaker and weaker.
Red line -resistance XRPUSD is trading around $0.95 after making a low around $0.90. Price is in a bearish trend as price continues making lower highs and new lower lows. We have warned bulls that as long as price was below $1.13-$1.25, XRPUSD would remain vulnerable to a move towards $0.85-$0.80. Yesterday highs are where the key short-term resistance is found, so bulls will need to break above $1.05-$1.065 in order to change trend to bullish. The material has been provided by InstaForex Company - www.instaforex.com |
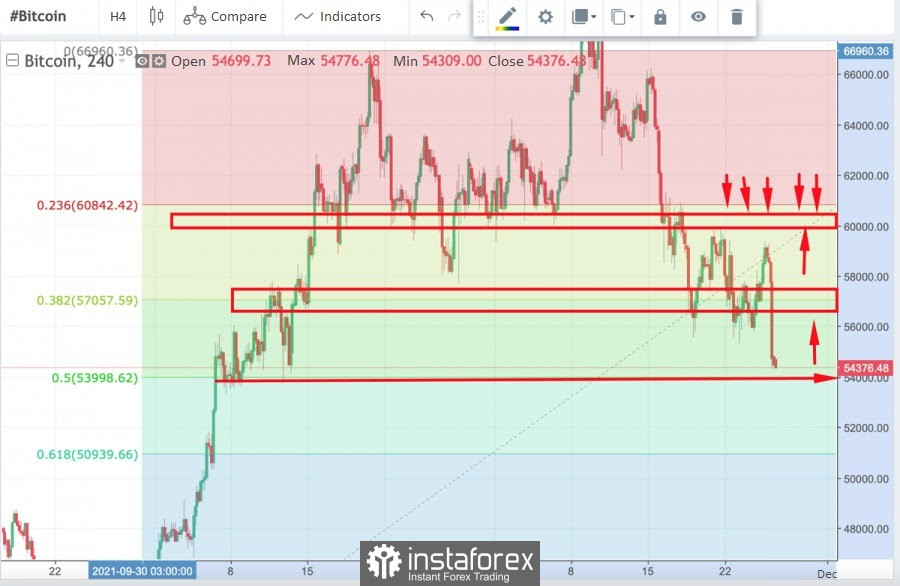
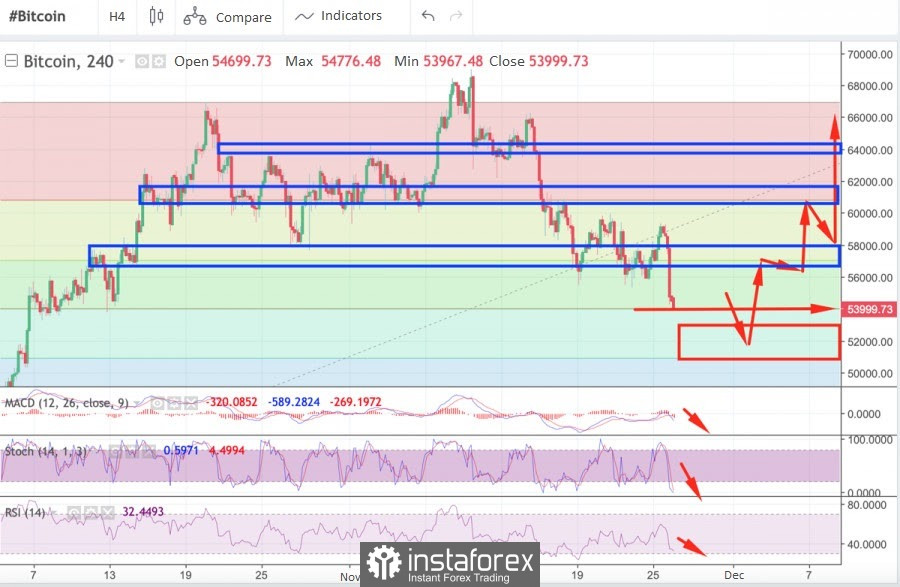
| Bitcoin updates its local minimum and is approaching a rebound point Posted: 26 Nov 2021 06:18 AM PST The cryptocurrency market, following the stock markets, fits perfectly into the timings and begins the second wave of correction. The main catalyst for the fall of the entire market was Bitcoin, which began to decline after the obvious uncertainty of buyers. Now the coin has slowed down in the support area, but there is every reason to believe that the market will try to play on the decline and buy back the price in a more profitable and safe zone. Most likely, the price will continue to decline towards the final segment of this correction in the $53.7k area. Not far from this zone, there is a Fibo level of 0.5, which is also a powerful support zone. However, as of 10:00 UTC, the coin found a local support zone near $54.5k, near which the 0.5 Fibo line runs. Taking this into account, we can assume two scenarios for the development of events.
In the first case, Bitcoin will touch the 0.5 Fibo line and bounce into the upper range of the current correction, above $57k. In this case, the price has the potential to grow further, to the $60k mark. Then the problems begin, as the price has not crossed the area around $61k for more than two weeks, where the buying area is concentrated and the Fibo level of 0.236 passes. Most likely, there will be a price rebound back to the range of $56k-$58k in this area. There is another option that should be considered at the current level of volatility. Buyers accumulate all their resources and squeeze out the price above $62k, which breaks the corrective structure and creates a powerful upside potential.
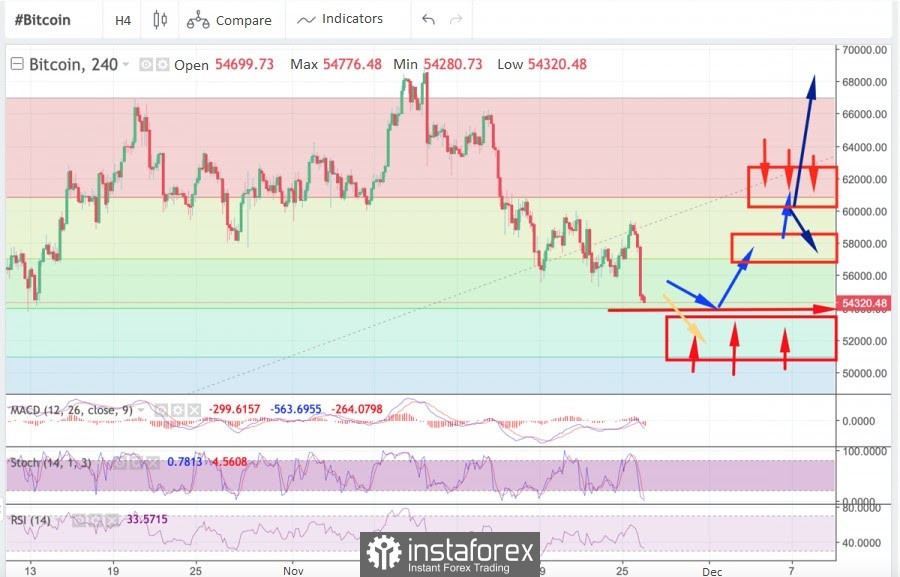
At the same time, the technical indicators of the cryptocurrency signal the continued downward dynamics and the absence of prospects for the development of even a local upward impulse. However, recall that the end of November is a particularly volatile period for Bitcoin, which was shown by the current decline, and therefore the rebound cannot be denied. I suppose that the buyback of current positions can begin when the price stabilizes after a strong impulse movement. But so far the charts do not confirm the likelihood of such a rebound.
There is a second option, it is more radical, but pleasant for those who want to play on the rise. The price continues to fluctuate in the current range, testing the 0.5 Fibo level around $53.9k several times, followed by a confident bearish breakout of this area. In the future, we can expect the price to fall to the lower border of the range and rebound from the 0.618 Fibo level, but I suppose that the massive buyback will begin much earlier. If the $53.9k mark is broken, I expect a massive activation of buyers and the opening of long positions. Taking this into account, the price will be allowed to reach $53.6k, after which a strong upward impulse will follow. Then the price will jump from the Fibo levels, and the completion of the main recovery period will be marked by a bullish flag at the top of $62k.
Taking into account the significantly increased volatility, I assume that Bitcoin will continue to decline with a small probability of a rebound. The market is scared because of such a sharp decline, and therefore the buy-off for speculative purposes will be in higher positions, which makes the exit from the current range more calm. At the beginning of the upward movement, sharp price pullbacks can be expected due to the activation of retail and speculative traders. But in general, Black Friday sums up the correction period before updating historical highs. The material has been provided by InstaForex Company - www.instaforex.com |
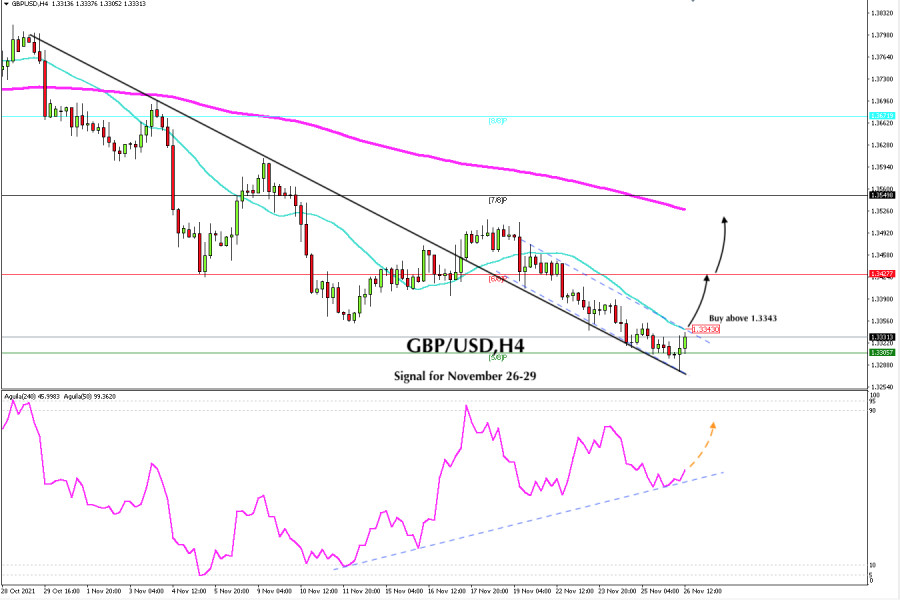
| Trading signal for GBP/USD on November 26 - 29, 2021: buy above 1.3343 (21 SMA) Posted: 26 Nov 2021 06:08 AM PST
After falling to price levels of December 21, 2020 around 1.3277, GBP/USD has managed to gain momentum and has started to rebound towards the 21 SMA located at 1.3343. This technical correction is observed in all crosses against the dollar, because the USDX in the last hours is falling below 8/8 of a murray. Parallel to the main downtrend channel, a second channel was formed. A sharp break above this channel and above the 21 SMA will be a clear signal to buy the GBP / USD pair with targets at 1.3427 and up to the 200 EMA at 1.3530. The key level to watch in the next few hours is the level of the 21 SMA located at 1.3343. If GBP/USD manages to settle above this level, we can expect a bullish move to the 200 EMA located at 1.3530. Support to the downside is located at 1.3305, around the zone of 5/8 murray. At this level, a technical rebound is expected. If the pound sterling falls towards these levels, it could enter into a strong oversold stage because this support coincides with the bottom of the downtrend channel formed since October 28. The eagle indicator is showing a bullish bias, moving above a trend channel. A recovery is likely to follow in the coming days as long as the pair remains above 1.3305. As GBP/USD is above the 21 SMA located at 1.3343, we have a good opportunity to buy in the next few hours. On the contrary, if the pound remains below this level, we should expect a technical rebound around 1.3305. Support and Resistance Levels for November 26 - 29, 2021 Resistance (3) 1.3391 Resistance (2) 1.3372 Resistance (1) 1.3343 ---------------------------- Support (1) 1.3305 Support (2) 1.3275 Support (3) 1.3246 *********************************************************** A trading tip for GBP/USD November 26 - 29, 2021 Buy above 1.3343 (21 SMA ) with take profit at 13427 (6/8) and 1.3530 (200 EMA), stop loss below 1.3305. The material has been provided by InstaForex Company - www.instaforex.com |
| The crypto market is terrified of the new COVID-19 strain Posted: 26 Nov 2021 06:03 AM PST At the auction on Friday, the first cryptocurrency shows a sharp decline against the backdrop of a global fall in world stock markets. So, in the morning, the price of digital gold reached $57,647, and after lunch it broke through the $55,000 mark, losing more than 7% and updating the minimum value level for a month and a half. At the time of writing, Bitcoin is trading around $54,000. The total capitalization of the crypto market is $2.56 trillion, and the BTC indicator in it is $1.03 trillion.
Leading altcoins instantly picked up the trend of the main digital coin and sank by more than 10%. The virtual asset market is falling against the backdrop of an active decline in securities, oil, and other risky assets. The reason for the concern of world markets was the news that the World Health Organization (WHO) has scheduled an emergency meeting due to the identification of the South African strain of coronavirus. Recall that on the eve of the National Institute of Infectious Diseases told about a new strain of COVID-19, first identified in South Africa and Botswana. The new strain is spreading faster than previously identified, and is also more contagious and less susceptible to existing vaccines. Against the background of this statement, Israel and the United Kingdom stopped air traffic with some African countries. All world markets reacted instantly to the frightening news from South Africa. Thus, the European STOXX Europe 600 index instantly lost 3.88%, the Chinese CSI 300 sank by 0.74%, the futures for the S&P 500 index fell by 1.82%, and the Moscow Stock Exchange index fell by 2.94%. The concern of market participants continues to grow due to fears of the approach of a new large-scale wave of coronavirus. At the same time, hopes for a rapid economic recovery are becoming less and less achievable, since the message about the new COVID-19 strain appeared against the background of an already unstable epidemiological situation in the world Crypto market analysts warn that today, in conditions of increased market volatility, investors in digital assets should be extremely careful. Historically, Bitcoin becomes as vulnerable as possible before exiting risky assets when the sale concerns everything, despite the prospects. The material has been provided by InstaForex Company - www.instaforex.com |
| How to earn on EUR/USD changing trend? Posted: 26 Nov 2021 05:58 AM PST
The euro bulls are gaining momentum. It seems that the euro has taken advantage of holidays in the US, and the trend is changing dramatically for the US currency. Investors were overwhelmed by the negative coronavirus news at the end of the week and still cannot fully digest it. Their first reaction to the news was rather strong, at least in the beginning. Their further perception of the situation will depend on the estimates of the World Health Organization. Since the main support for USD comes from the stimulus cut and the expected rate hike in 2022, news of a new virus strain undermined the position of the greenback. The outbreak of an even more dangerous and vaccine-resistant virus could harm the US economy. This means that against this backdrop, the Fed is unlikely to accelerate the reduction of its bond purchases and raise the rates earlier than planned. Investors have started to reassess the forecast for the Fed's monetary policy. According to the CME Group FedWatch Tool, markets have already priced in a 34% chance that the key rate will remain unchanged by June 2022. Back on Thursday, it was about 18%. Treasury yields fell by more than 7% from the opening price. At the moment, the coronavirus issue can benefit the US dollar only if we consider risk assets. It is difficult for the greenback to strengthen against the euro relying on this factor. Moreover, the markets prefer not to take into account the divergence between the monetary policies of the Fed and the ECB. Thus, the EUR/USD pair managed to hold near the level of 1.1200. Probably, the current support has turned out to be surprisingly strong. A couple of days ago, traders almost gave up on the euro. Today, however, they point out the euro's stability and say that it is not as weak as it may seem. The strategists have two different views on the pair. Some advocate for the growth of the euro, saying that it is too early to state the euro's defeat. There is still time for the pair to return closer to the 1.1600 level by the end of the year.
Others do not believe that on Friday the European currency will be able to show impressive growth. The rally in the US dollar is likely to continue through the next week after a short pause and an expected correction. The panic over the coronavirus should calm down soon unless no worrisome news appears over the weekend. Experts from the WHO say that for now "there is no need to worry." An unprecedented number of mutations can make a virus strain "unstable" and prevent it from spreading. Meanwhile, the authorities of Great Britain and Israel have imposed travel restrictions on several African countries, while other countries remain silent. The US has briefly commented on the situation. According to the Director of the National Institute of Allergy and Infectious Diseases, Anthony Fauci, at the moment there is no evidence that the new virus strain has penetrated into the United States. Washington will consider appropriate measures when more information becomes available. Fauci also added that the US was in close contact with scientists from South Africa. Meanwhile, the EUR/USD pair has tested the 50-SMA at 1.1280 today, confirming its rise towards the psychological level of 1.1300. Consolidation above this level promises good prospects for the euro in the short term. The nearest support levels are located at 1.1230, 1.1200, and 1.1185 The material has been provided by InstaForex Company - www.instaforex.com |
| EUR/USD: dollar boosted by risk aversion, as COVID-19 clouds EU economic prospects Posted: 26 Nov 2021 05:47 AM PST
On Friday, the US dollar continued its retracement, easing off its 17-month high of 96.93 set on Wednesday. The euro continues to recover from its 2-week long decline. Nevertheless, analysts note that factors which caused the dollar rally and sent the EUR/USD pair to the low of June 2020 remain in place. The divergence of US and EU economic growth and monetary policies is likely to push the pair down even further. Amid the highest inflation in 30 years, other macroeconomic indicators show that the US economic recovery still has momentum. Morgan Stanley has improved its outlook of US GDP growth in this quarter from 3% to 8.7%. JPMorgan Chase's outlook has been revised from 5% to 7%, while the Federal Reserve Bank of Atlanta adjusted its outlook from 8.2% to 8.6%. Debates continue in the Federal Reserve regarding further monetary policy tightening. While some Fed officials call for accelerating bond-buying to give the regulator extra flexibility in raising the key interest rate, other call for a more cautious approach, wishing to get more data. Last week, Christopher Waller, a member of the Federal Reserve Board of Governors, said high inflation made him favor faster QE tapering. Richard Clarida, Vice Chair of the Federal Reserve, said he would look closely the data released from that moment until the December Fed meeting. He added that the Fed could discuss accelerating QE tapering at the December meeting. This week, Mary Daley, president of the Federal Reserve Bank of San Francisco, said she would support accelerating QE tapering, depending on the economic reports on inflation and hiring. On interest rates, Daley sees the Fed hike the rate in late 2022. "It wouldn't surprise me at all if it's one or two by the latter part of next year", she added.
At a press conference following the November meeting of the FOMC, the Federal Reserve's chairman Jerome Powell reiterated that the Fed would not rush with raising interest rates due to incomplete recovery of the US labor market. He said that the regulator still continues to view high inflation as transitory. Traders now eye economic data in the run-up to the next Fed meeting of 14-15 December, which could give hints on the Fed's decision regarding QE tapering. If the Federal Reserve accelerates the winding down of bond-buying to $30 billion in December, the QE would be over in March 2022, raising the probability of an interest rate hike in the first half of 2022. The fed funds futures market has fully priced in the scenario of a hike in June 2022. The chance of a rate hike in May 2022 has risen to 65%. The US payroll data set for release next Friday would greatly influence Fed monetary policy. "Medium term, we continue to favor the USD. However, with the market now long USD and short EUR and the money market very aggressively positioned for Fed rate hikes next year, there is scope for pullbacks in the currency pair," Jane Foley, senior FX strategist at Rabobank said. Foley pointed at $1.15 as a potential target and noted the payrolls report as a potential trigger. On Thursday, EUR/USD rose modestly, extending its growth on Friday, supported by the dollar's rebound amid falling US treasury bond yields. The fall of US bond yields was triggered by concerns over the new COVID-19 strain discovered in South Africa. The yield of US 10-year Treasury notes fell by more than 11 basis points to 1.52%, as investors sought refuge in US bonds.
USDX is currently below its 17-month high by 0.7%. The demand for dollar as a safe-haven asset prevents the index from further decline. Despite the current retracement, the US dollar still has upside potential. Its rally is very likely to continue. The 97.00 mark is the closest target, with the next resistance level being 97.80. USDX could continue moving upward from its September low of slightly below 94.00, surpassing the 2-month support level. The dollar is expected to remain on the upside if it continues to be above the 200-day MA, which is currently near 92.30. The outlook for the euro remains cloudy amid the rise of COVID-19 cases in Europe, contiuing logistical issues and the energy crisis. An upsurge in infections has led to lockdowns in several European countries. The deteriorating coronavirus situation could put pressure on the euro and create further divergence in monetary policy expectations between the Fed and the ECB, ING analysts say. "Given overnight developments, a major question now is whether the new variant has already reached Europe (which is geographically closer to Africa). This could deal another blow to EZ sentiment and the EUR", they commented. "We have heard some ECB members this week indicating that PEPP will end in March: we'll see whether the many scheduled speakers (including Christine Lagarde and Philip Lane) for today will touch on this subject again. Still, the EUR has been quite unreactive to policy comments with most of the focus on the current Covid-related re-rating of EC growth expectations", ING analysts added. EUR/USD gathers has some upside traction and could find short-term support at the 1.1240-1.1180 zone, Axel Rudolph, Senior FICC Technical Analyst at Commerzbank, said. "Any bounces will find tough resistance at the 1.1604 five-month downtrend and while capped here, the overall bias remains negative", Rudolph noted. The closest resistance levels are 1.1374 and 1.1413. A breakout below 1.1160 would target 1.1100, the 78.6% retracement of the move seen in 2020, he added. The material has been provided by InstaForex Company - www.instaforex.com |
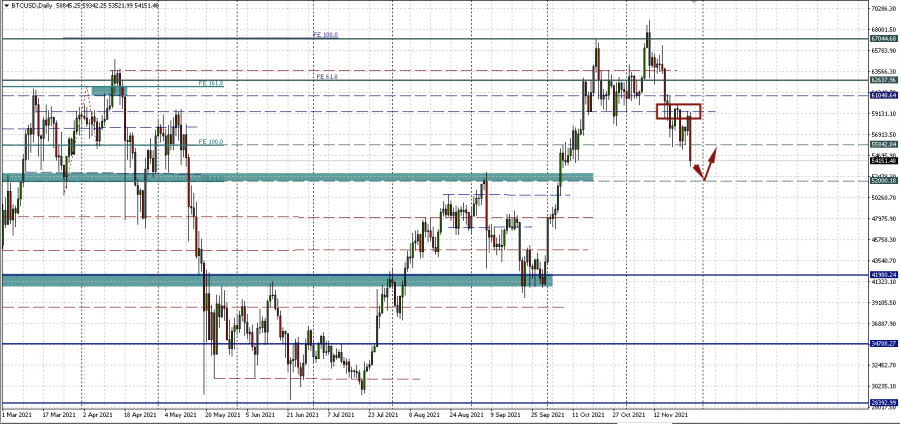
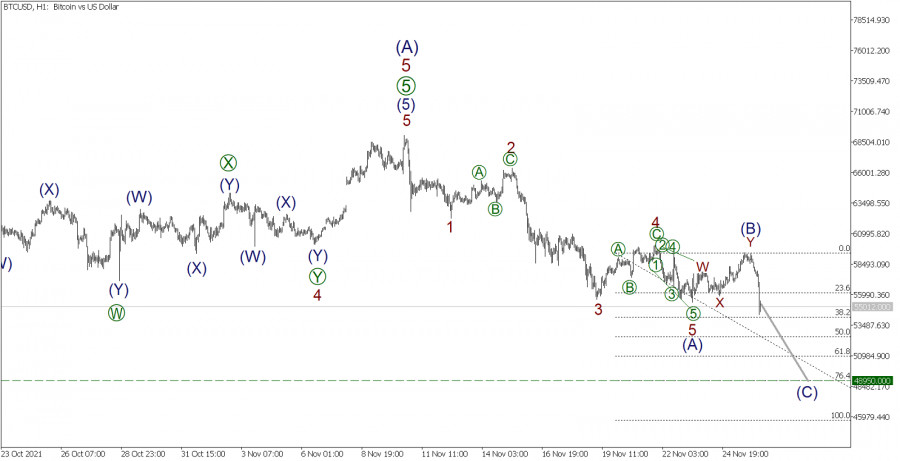
| Wave analysis and trading recommendation for BTC/USD 11/26/2021 Posted: 26 Nov 2021 05:37 AM PST BTCUSD, H1:
In the long term, a bullish trend is expected to develop for the BTCUSD cryptocurrency pair, taking the form of a simple zigzag (A)-(B)-(C). The first impulse wave (A) looks complete so far. In the last section of the chart, we see the formation of a new bearish zigzag. As part of this zigzag, the bearish impulse wave (A) came to an end. It consists of five subwaves of the smaller wave level 1-2-3-4-5. The final wave 5 took the form of the final diagonal. The upward corrective wave (B) also looks fully completed. It is a double zigzag W-X-Y. After the completion of the correction (B), the price began to decline rapidly, which may indicate the beginning of the development of the final impulse wave (C). Its completion is expected at the level of 48,950.00. At this price level, it will be 76.4% of impulse (A). The probability of achieving the specified ratio is high. Thus, in the coming days, the rate may fall in the indicated wave. In the current situation, it is recommended to consider opening sell deals in order to take profit at the specified level. Trading recommendations: Sell from the current level, take profit 48,950.00. The material has been provided by InstaForex Company - www.instaforex.com |
| Video market update for November 26,,2021 Posted: 26 Nov 2021 05:31 AM PST Watch for the potential reversion to the mean on AUD.... The material has been provided by InstaForex Company - www.instaforex.com |
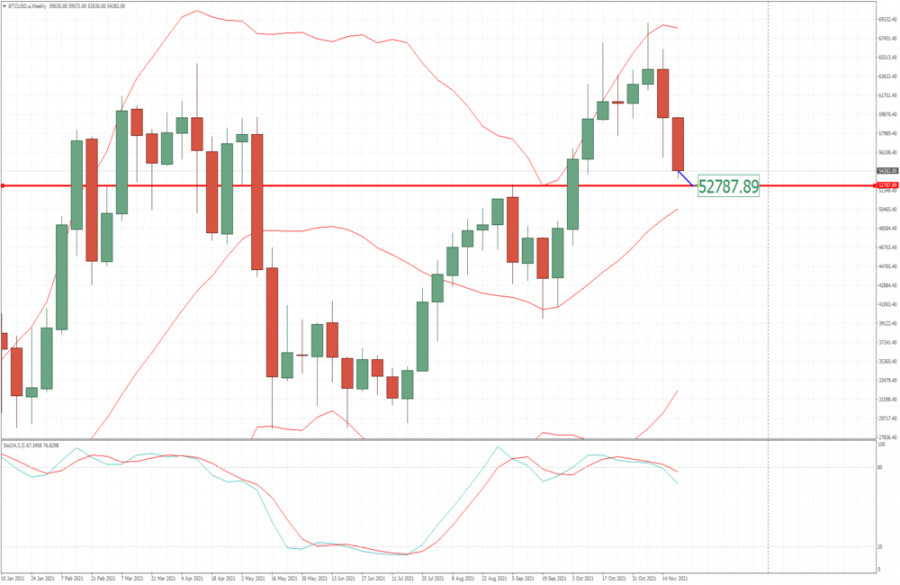
| BTC analysis for November 26,.2021 - Downside pressure Posted: 26 Nov 2021 05:30 AM PST Technical analysis:
BTC is trading downside with good momentum and there is still potential for the downside continuation. Trading recommendation: Due to strong downside movement and potential for the further drtop I see potential for the selling opportunities on the rallies. Watch for selling opportunities on the rallies with the downside target at the price of $52,790. Stochastic is showing is showing weekly bearish divergence, which is sign that there is potential fort further downside movement. Resistance level is set at the price of $59,400 The material has been provided by InstaForex Company - www.instaforex.com |
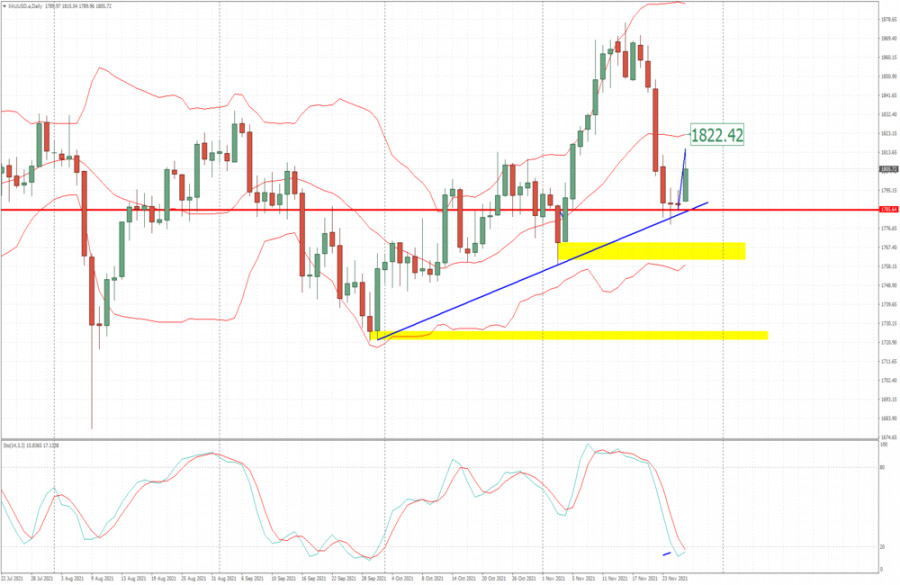
| Analysis of Gold for November 26,.2021 - Upside breakout Posted: 26 Nov 2021 05:14 AM PST Technical analysis:
Gold has been trading upside as I expected. The price is heading towards my upside objective from yesterday at $1,822. Trading recommendation: Due to upside breakout today and strong relative strength on the Gold, watch for potential buying opportunities on the pullbacks. Upside target is set at the price of $1,822 Stochastic is showing potential for the bullish cross and extreme downside condition. Support level is set at $1,780 The material has been provided by InstaForex Company - www.instaforex.com |

| You are subscribed to email updates from Forex analysis review. To stop receiving these emails, you may unsubscribe now. | Email delivery powered by Google |
| Google, 1600 Amphitheatre Parkway, Mountain View, CA 94043, United States | |


Comments