Forex analysis review
Forex analysis review |
- Litecoin bullish continuation pattern
- Gold further growth expected
- Bitcoin may still experience "parabolic rise"; what does Bitcoin Taproot upgrade have to do with it?
- EUR/USD analysis on November 12, 2021. Low market activity and weak news background
- Bitcoin will cost $100,000 in December: Anthony Scaramucci
- GBP/USD: British pound updates annual low
- Analysis of GBP/USD for November 12: British currency recoups some of its losses
- BTC analysis for November 12,.2021 - Watch for the upisde movement towards $65.300
- Analysis of Gold for November 12,.2021 - Strong upside presssure and potetnial for test of $1.900
- EUR/USD analysis for November 12, 2021 - Potential for the upside breakout
- Video market update for November 12,2021
- Bitcoin gets new investment, SEC considers spot ETF launch: BTC holds $63.5k support level and continues to recover
- November 12, 2021 : EUR/USD daily technical review and trading opportunities.
- November 12, 2021 : EUR/USD Intraday technical analysis and trading plan.
- Ethereum approaches correction: why is it good?
- November 12, 2021 : GBP/USD Intraday technical analysis and significant key-levels.
- Trading signal for Ethereum (ETH) on November 12 - 15, 2021: sell below $4,722 (7/8)
- Rising dollar and gaining gold simultaneously: Inflation wreaks havoc, Fed expected to take urgent action
- Johnson & Johnson announced the separation of the corporation
- Wave analysis of EUR/USD for November 12, 2021
- USDCHF approaches key Fibonacci resistance area.
- EUR/USD bears tired but bulls may continue the rally
- Bitcoin back tests break out area.
- Ichimoku cloud indicator analysis on Gold for November 12, 2021.
- Ichimoku cloud indicator analysis on EURUSD for November 12, 2021.
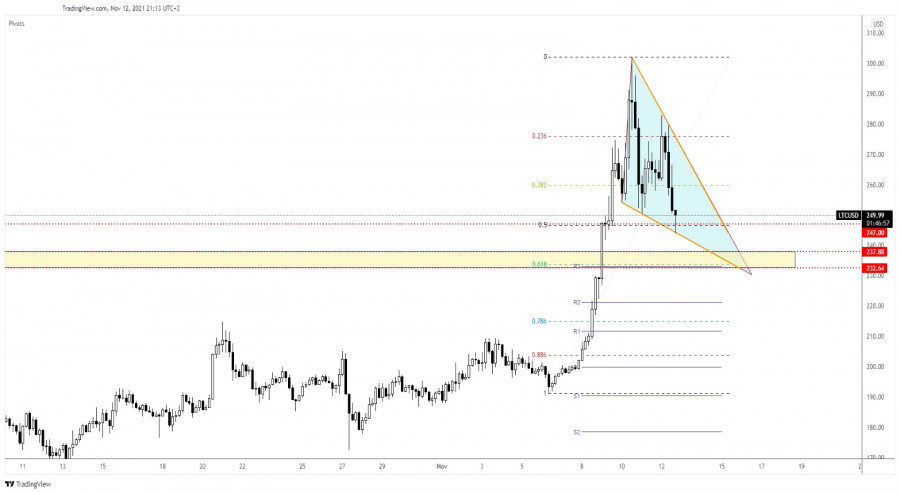
| Litecoin bullish continuation pattern Posted: 12 Nov 2021 12:22 PM PST Litecoin dropped in the short term but the correction could be over soon. The price action developed a bullish pattern. If this formation is confirmed, LTC/USD will give birth to a new leg higher. The crypto was traded at 253.22 at the time of writing above 243.86 today's low. In the last 7 days, LTC/USD is up by more than 26%. In the short term, the crypto slipped lower also because the price of Bitcoin has retreated after reaching a fresh all-time high of 69,000. LTC/USD falling wedge
Litecoin retreated after failing to stabilize above 300.00 psychological level. It has developed the Falling Wedge pattern. Still, the pattern is far from being confirmed. The rate dropped below the 50% retracement level, but it has rebounded and now is traded far above it. The area of 237.88 - 232.64 stands as a support area. It remains to see if the sellers will be strong enough to be able to push the rate down towards this demand zone. Litecoin predictionAfter the correction ends, we may have good long opportunities. Staying above the 237.88 - 232.64 area and making a valid upside breakout from the Falling Wedge could signal a new leg higher, an upwards movement. The material has been provided by InstaForex Company - www.instaforex.com |
| Posted: 12 Nov 2021 12:21 PM PST
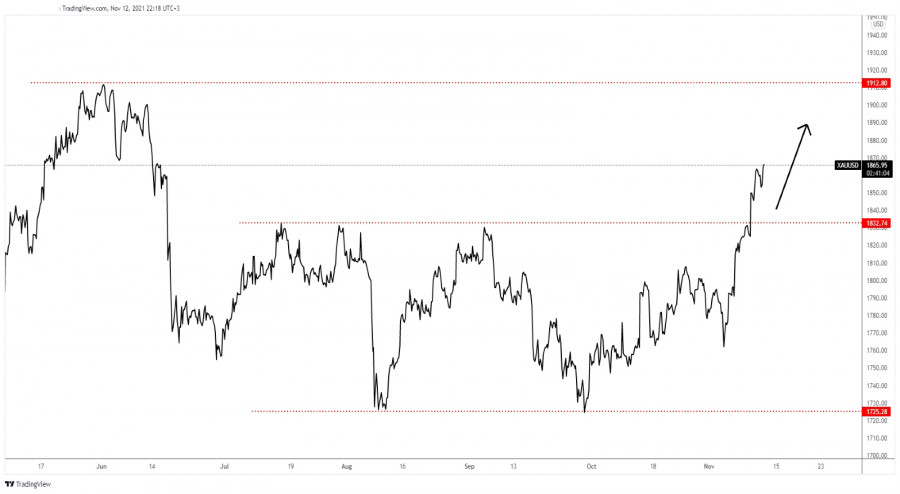
Gold uptrendGold was trading at the 1,864.97 level at the time of writing. As you can see, it has moved sideways between 1,725.28 and 1,832.74 levels. Now it has escaped from this range movement ignoring the 1,832.74 level which represented an upside obstacle. Technically, XAU/USD is somehow expected to resume its growth despite minor and temporary declines. The higher high of 1,912.80 is seen as a major upside target, as an upside obstacle. Gold predictionAfter its aggressive growth, we cannot exclude a temporary decline. So, a minor retreat or a sideways movement could bring new buying opportunities. As long as it's traded above 1,832.74, Gold could resume its growth. From the technical point of view, its breakout above 1,832.74 was seen as a buying opportunity. Further growth could be invalidated only by a drop below 1,832.74. The material has been provided by InstaForex Company - www.instaforex.com |
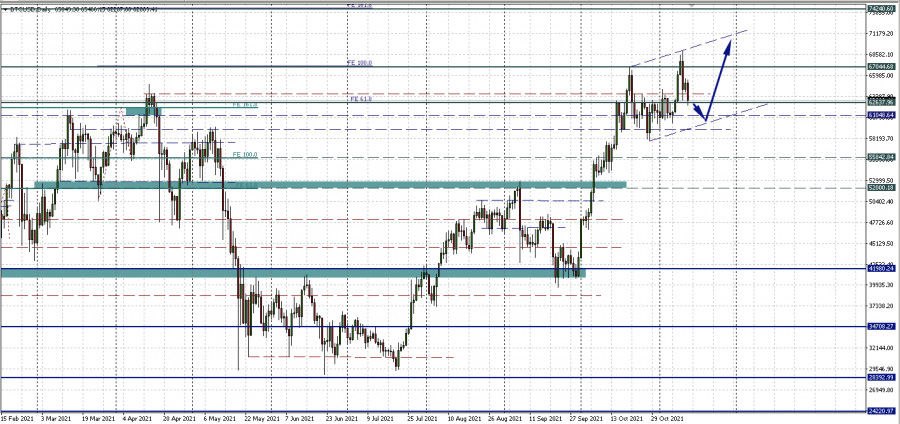
| Bitcoin may still experience "parabolic rise"; what does Bitcoin Taproot upgrade have to do with it? Posted: 12 Nov 2021 10:59 AM PST Bitcoin continues to decline on Friday. But an unclosed bearish daily candle is a shaky benchmark for analysis. There have been no fundamental technical changes since Thursday: support at 62,637.96 may turn out to be the lower border of a new sideways consolidation range. The second presumed technical scenario is the formation of an upward channel. The second minimum, at which the support line can be drawn, has not yet been formed. But if we assume that this border will be parallel to the resistance of the two rising highs (although this is not true, let's assume), then the correction could go deeper into the area of $60,000-$61,000 per coin. Profit-taking or fundamental pressure? Such a beautiful bearish engulfing on the daily chart is more of a sign of profit-taking by buyers. And the correction was strengthened by the removal of part of the long positions opened with the leverage. The situation is familiar and has been discussed by us here more than once. Although, in support of Thursday's assumption, asset management expert from Tellurian ExoAlpha confirmed the likelihood of the hype about the China Evergrande financial crisis on some digital assets, including Friday. He believes that the news from Evergrande is causing a violent reaction in the digital currency ecosystem as a whole, but this is only a temporary phenomenon and preparation for a rebound to new highs. Well, here we seem to agree. Inflation shock and BTC update: there is every chance for growth I will not repeat once again that inflationary pressure is one of the factors urging institutional investors to flee to bitcoin. This topic has been covered many times. One has only to recall the latest data of this week - the growth of the consumer price index (CPI) in October exceeded 6.2%. This, among many other factors, could push even private investors to invest in bitcoin as a way of hedging investment portfolios from this inflationary surge. The discussion of the parabolic rise of the main cryptocurrency against the background of the upcoming update will become more interesting. Analysts compare the current bull cycle since the previous halving with the previous ones and note that the market has not yet experienced the final parabolic rally. Although the situation is not identical to the 2013 or 2017 rallies, the foundation is still being laid for this so-called "parabolic takeoff." In terms of local news, not only a final decision is expected on Sunday on whether or not filing a spot Bitcoin ETF in the US will be allowed. The fate of blocking the Bitcoin Taproot soft fork will also be decided. "The last time bitcoin underwent such a major update was the Segwit update in August 2017. Bitcoin was priced at $4,000 at the time and then surged to nearly $20,000 over the next four months," noted Decentrader analysts, who suggest the update could trigger a new surge in volatility. "Will we see a similar rally this time? Considering how optimistic many macro indicators look right now, as well as the influx of new funds into the cryptocurrency, this is certainly possible." Against this background, BTCUSD volatility may increase over the weekend. But for now, I leave the actual technical guidelines on the chart. They may have to be updated from the next week.
|
| EUR/USD analysis on November 12, 2021. Low market activity and weak news background Posted: 12 Nov 2021 10:49 AM PST |
| Bitcoin will cost $100,000 in December: Anthony Scaramucci Posted: 12 Nov 2021 10:44 AM PST
Anthony Scaramucci is still bullish towards Bitcoin. Scaramucci is confident that digital gold will cost $100,000 in December, so he advised all new investors to invest in their chance as soon as possible. Scaramucci has been very flattering about Bitcoin lately. The founder of Skybridge Capital used to be very skeptical about cryptocurrency, but over time he changed his position. He is now confident that Bitcoin is quickly breaking into the monetary policy of countries, and due to its protection from today's inflation and decentralization, it will oust the dollar from the international arena. Scaramucci founded the Skybridge Bitcoin Fund this year, which is designed specifically for investing in Bitcoin. The CEO of Skybridge is confident that now is the best time to jump onto the departing carriage. The cryptocurrency is scalable, the amount of funds that come to the market is increasing, and there are more and more investors. In addition, Scaramucci also says to pay attention to Ethereum. In addition to the Bitcoin fund, his company also created the Ethereum fund. The company even applied for an Ethereum-based ETF with the SEC. This procedure was undertaken after the application for the Bitcoin ETF. Scaramucci is confident that his foundation will be able to attract more than $100 million from institutions. He is also very closely watching other altcoins in order to create similar funds to attract investor funds, but the priority is of course on the side of bitcoin and ethereum. Scaramucci is confident that Bitcoin and Ethereum will continue to scale and grow over the next 20 years. He also advises ordinary investors not to come into cryptocurrency trading if they are afraid of a fall in the market and long bearish rallies. An investment should be viewed as an investment of your own funds for the long term, otherwise, you should give up the idea of investing your own money. The material has been provided by InstaForex Company - www.instaforex.com |
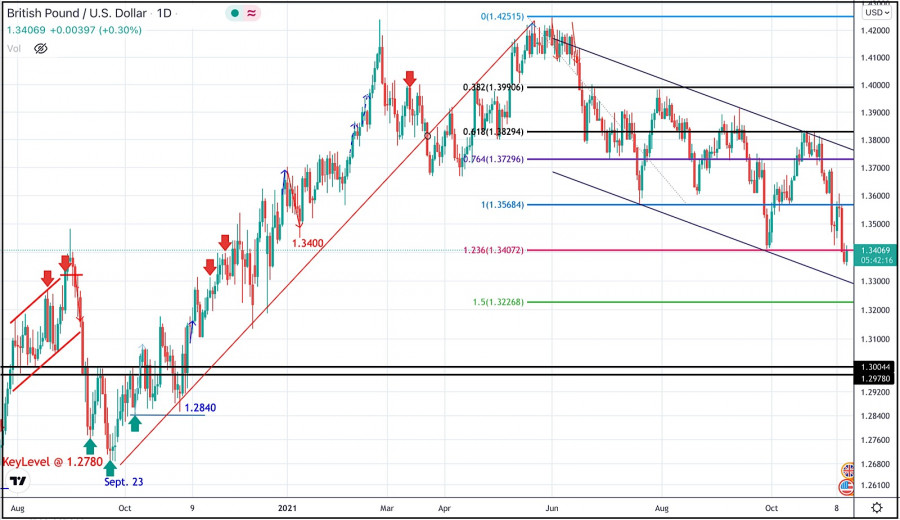
| GBP/USD: British pound updates annual low Posted: 12 Nov 2021 10:32 AM PST The pound paired with the dollar continues to slide down, updating new price lows. Although recently, the British pound was the favorite of the foreign exchange market, thanks to hawkish rumors about possible actions of the Bank of England. Traders assumed that the British regulator would outpace the Fed and raise the interest rate by 15 basis points at the November meeting, reacting to a strong increase in inflation and good data in the labor market. But this scenario did not materialize. At this year's penultimate meeting, the Bank of England adopted a cautious and wait-and-see attitude. Despite the fact that the "hawk wing" of the central bank was strengthened by another member of the Committee (Catherine Mann), most of her colleagues decided not to get ahead of the story. As Andrew Bailey noted, before talking about the tightening of monetary policy parameters, it is necessary to look at the dynamics of key macroeconomic indicators without the influence of stimulus programs. And here it should be noted that one of these programs completed its operation quite recently, at the beginning of autumn (the so-called "Furlough-scheme"). At the same time, the latest data on the UK labor market were published only for August (unemployment rate, wage dynamics) and September (an indicator of an increase in the number of applications for unemployment benefits). Therefore, members of the Bank of England will be able to assess the state of the labor market without the influence of incentives only at the end of this year. In particular, the October unemployment rate will be published as early as December. |
| Analysis of GBP/USD for November 12: British currency recoups some of its losses Posted: 12 Nov 2021 10:26 AM PST |
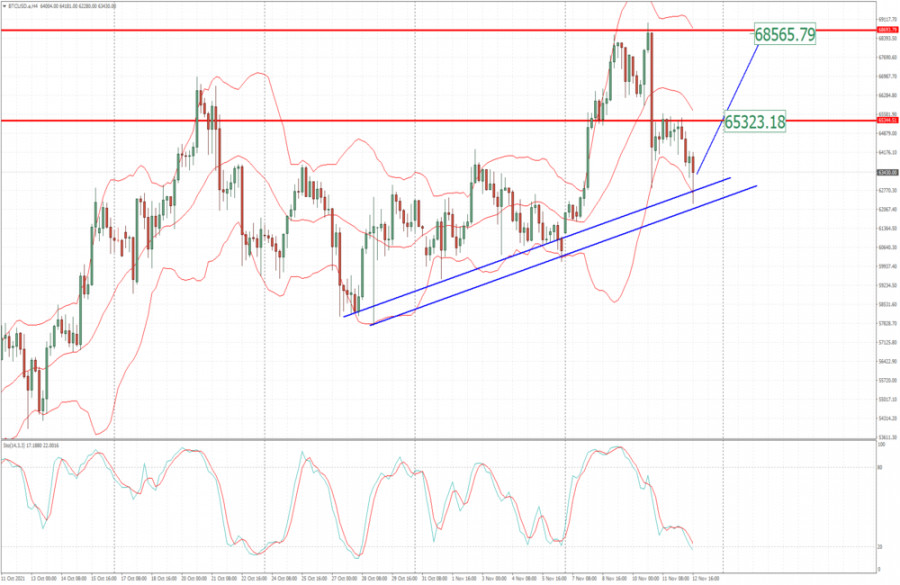
| BTC analysis for November 12,.2021 - Watch for the upisde movement towards $65.300 Posted: 12 Nov 2021 09:59 AM PST Technical analysis:
BTC has been trading downside today but it found support at the rising trend line, which is good sign for further rally. Trading recommendation: Due to strong upside trend in the background, watch for potential buying opportunities. Upside targets are set at the price of $65,320 and at the price of $68,565. Stochastic is showing oversold condition, which is sign that there is potential for the upside rotation. Support level is set at the price of $61,500 The material has been provided by InstaForex Company - www.instaforex.com |
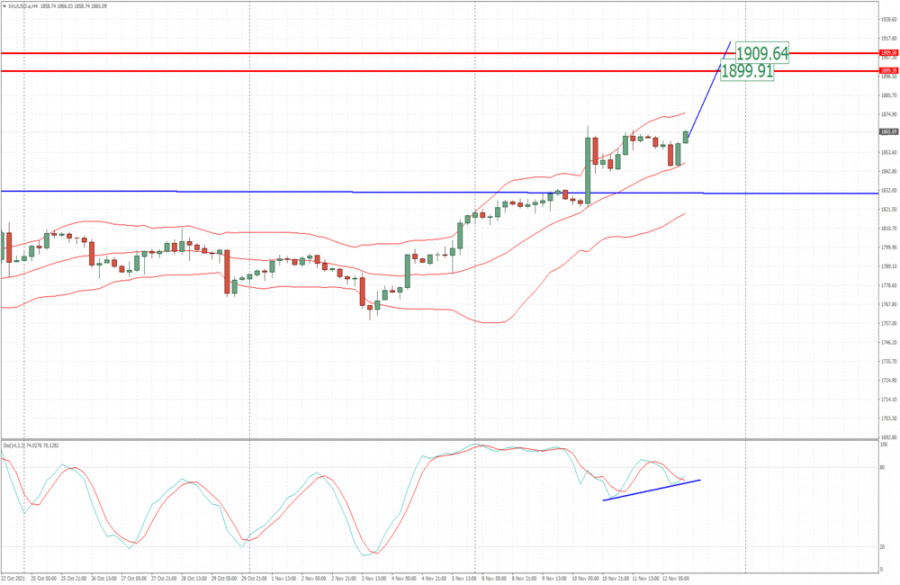
| Analysis of Gold for November 12,.2021 - Strong upside presssure and potetnial for test of $1.900 Posted: 12 Nov 2021 09:53 AM PST Technical analysis:
Gold has been trading bullish today and there is potential for the bigger rally towards $1,900. Trading recommendation: Due to strong bullish condition and continuation al pattern, I see potential for further rally. Watch for buying opportunities on the pullbacks with the next upside targets at $1,900 and $1,909, Stochastic is showing fresh bull cross, which is another sign and confirmation for the bullish swing. Support level is set at the price of $1,841 The material has been provided by InstaForex Company - www.instaforex.com |
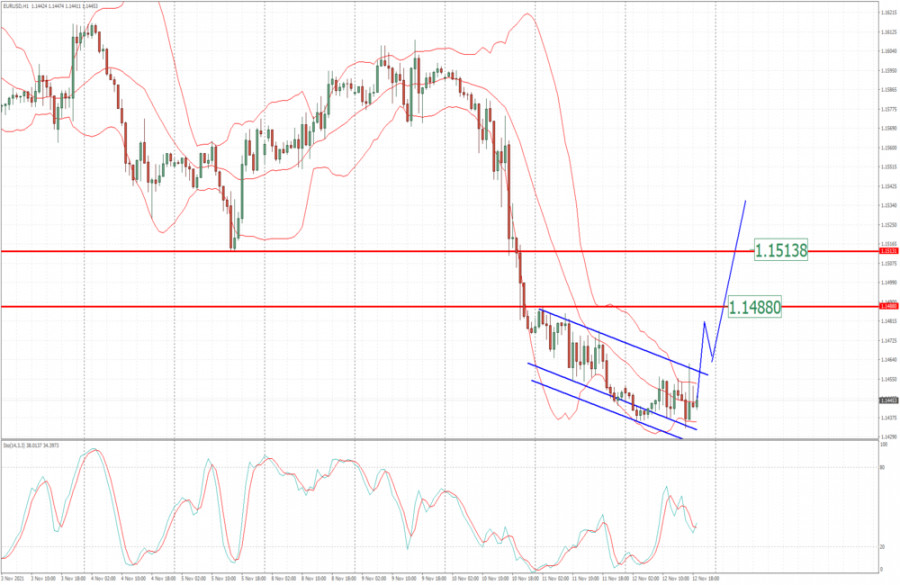
| EUR/USD analysis for November 12, 2021 - Potential for the upside breakout Posted: 12 Nov 2021 09:47 AM PST Technical analysis:
EUR/USD has been trading sideways at the price of 1,1450 but I see potential for the bullish movement in the next period. Trading recommendation: Due to downside exhaustion and downside channeling mode, my advice is to watch for the upside breakout to confirm bullish movement. IN case of the upside breakout watch for buying opportunities with the upside targets at 1,1485 and 1,1513. Stochastic is showing fresh bull cross, which is another sign and confirmation for the bullish swing. Support level is set at the price of 1,1430 The material has been provided by InstaForex Company - www.instaforex.com |
| Video market update for November 12,2021 Posted: 12 Nov 2021 09:30 AM PST BTC on the pullback... The material has been provided by InstaForex Company - www.instaforex.com |
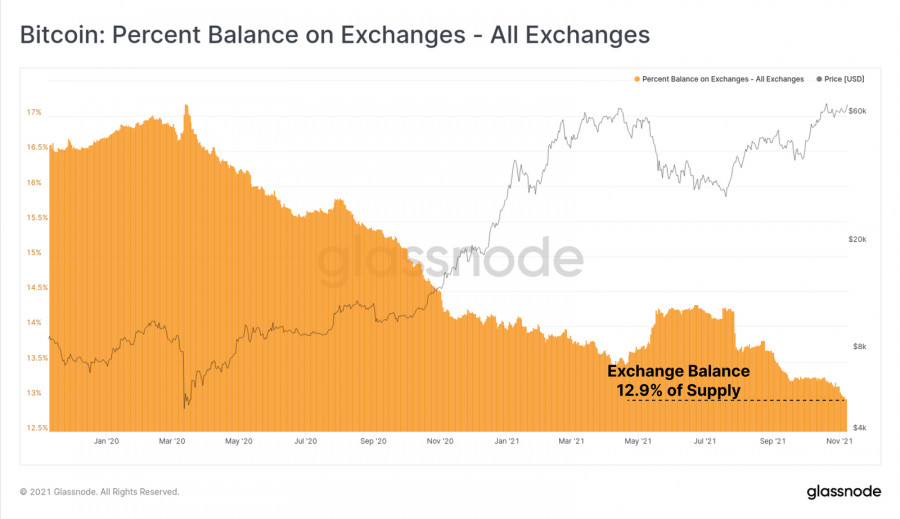
| Posted: 12 Nov 2021 09:26 AM PST Over the past week, Bitcoin has successfully updated its all-time high and plummeted 9% due to fake news. Due to such impulsive market behavior, the coin is busy holding the support zone, rather than a broad upward movement towards the $100,000 forecast level. Despite this, the situation around the first cryptocurrency remains as positive as possible: the crypto attracts new players and investments, and is also preparing for the Taproot upgrade. As of November 12, Bitcoin is trading in the $64,000 region and is trying to recover above the swing zone to resume the bullish rally. If the news background remains neutral or positive, the asset will be able to break the $65,500 mark by the end of the current trading week. This is directly related to the bullish sentiment of the main crypto audience, which is reflected in the preservation of an important support zone at $63,500. In addition, the recent collapse did not scare investors away from BTC, which is confirmed by Glassnode experts, according to which cryptocurrency exchanges have lost 5,000 BTC over the past few weeks, while only 900 coins were mined.
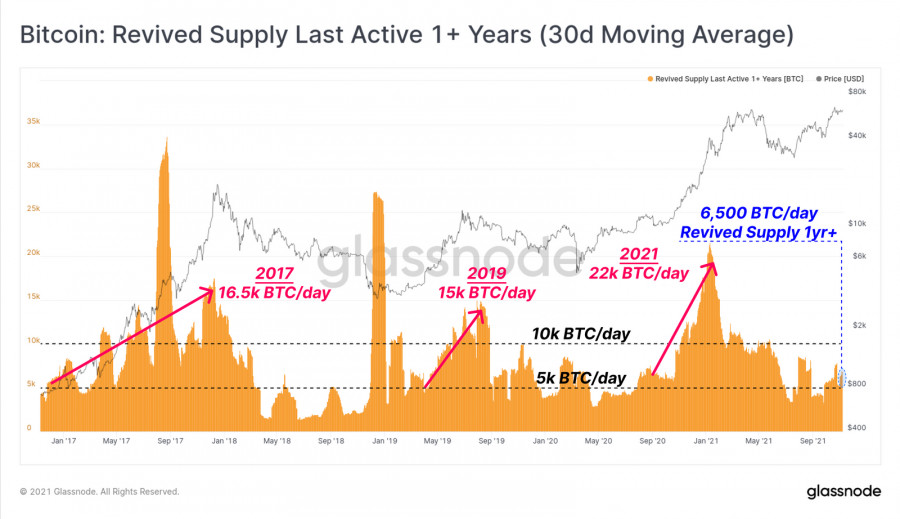
Another important bullish signal for Bitcoin is attracting a fresh audience. It became known that with a Bitcoin price of $53,000 and a capitalization of $1 trillion, the total volume of coins moved was 3.5 million. In other words, more than 18% of the total number of coins in circulation moved at a rate above $53,000, which is direct evidence of an inflow of new capital. In addition, the recently launched Bitcoin futures ETFs are already generating record investments: exchange-traded funds BITO from Proshares and BTF from Valkyrie received record investment volumes in two weeks. Thanks to this, BITO entered 2% of the largest funds in terms of volume, with a result of $1.4 billion. All this has a positive effect on the psychology of investors and directly on the BTC/USD quotes.
In addition, the market is waiting for two extremely important events that can significantly increase the prospects of Bitcoin in the fourth quarter of 2021. By the end of this week, the SEC is obliged to consider VanEck's application to launch a spot ETF for Bitcoin. Recall that the CEO of MicroStrategy described the multibillion-dollar prospects of such a financial institution, and therefore the market is waiting with high hopes for a decision from the regulator. The second important announcement that will contribute to the growth of BTC is the Taproot upgrade, designed to improve the operation of smart contracts in the network of the first crypto asset. With this in mind, PlanB's forecasts of a bitcoin price of around $96,000 by the end of November look very likely. Meanwhile, Bitcoin managed to defend the $63,500 mark, which increased the likelihood of further upward movement as part of the recovery in quotes. Despite the local positive, the price has already rebounded from the $65,500 resistance zone several times, and therefore the quotes are now moving to retest the $63,500 support zone, and judging by the technical indicators, the probability of its breakdown is growing. The MACD indicator continues to decline and enters the red zone below the zero mark, which indicates a loss of strength by the upward momentum. At the same time, the stochastic oscillator also goes down and breaks through the lower border of the bullish zone, which indicates an increase in the number of sell orders and market confidence in the breakdown of $63,500. If the BTC price still breaks through the current purchase level, then further resistance during the decline is formed at $57,700. Further downward movement can significantly worsen the panic and call into question the medium-term upward trend. At the same time, with an adequate market reaction, the rebound from the zone below $57,700 increases significantly, and a key support zone passes at $53,600.
|
| November 12, 2021 : EUR/USD daily technical review and trading opportunities. Posted: 12 Nov 2021 08:26 AM PST
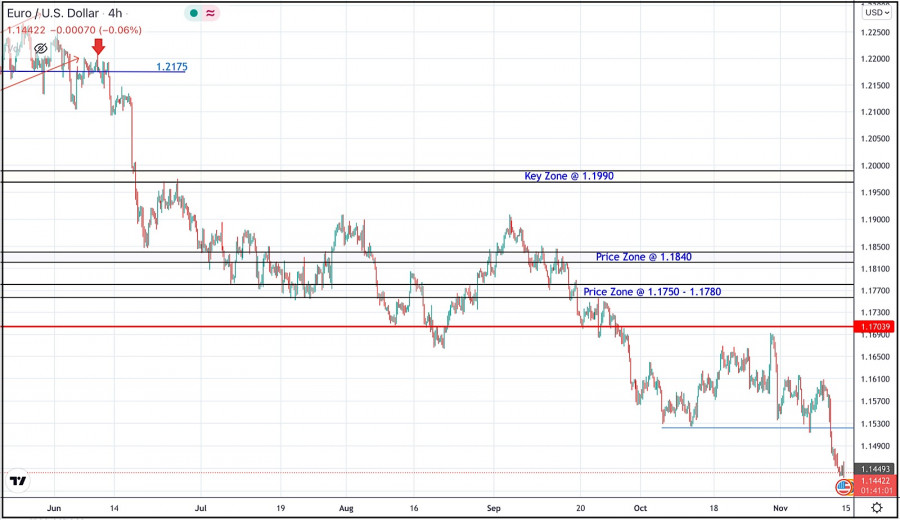
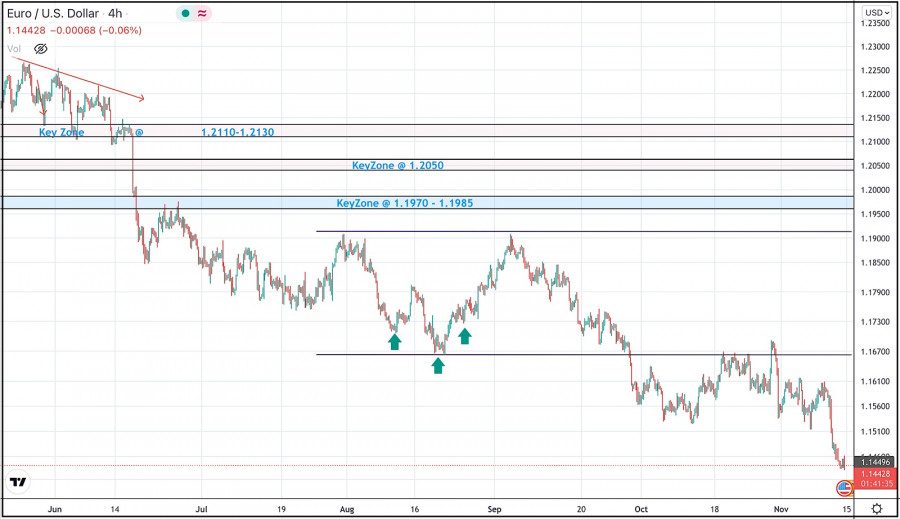
Recently, Persistence below the depicted price zone of 1.1990 indicated further downside movement towards 1.1840 and 1.1780 where a sideway consolidation range was established. During last week, the EURUSD pair has been trapped within a narrow consolidation range between the price levels of 1.1780 and 1.1840. A bullish breakout was executed above 1.1840 shortly after. Temporary Upside pullback was expected towards 1.1990. However, re-closure below the price level of 1.1840 has initiated another downside movement towards 1.1780 which failed to hold prices for a short period of time before significant upside movement was presented into market. Intraday traders were advised to wait for candlestick closure above 1.1780 - 1.1840 for another ascending swing to be initiated. However, immediate downside selling pressure brought the pair down below 1.1700. More downside movement took place towards the price level of 1.1600 where significant buying pressure existed. Market price slided below 1.1700 and 1.1600. This has enhanced further decline towards 1.1500. Currently, the price zone around 1.1700 stands as a prominent supply-zone to be watched for SELLING pressure and a possible SELL Entry upon any upcoming ascending movement. Currently, it is not advised to add new SELL Entries as the pair already looks oversold. The material has been provided by InstaForex Company - www.instaforex.com |
| November 12, 2021 : EUR/USD Intraday technical analysis and trading plan. Posted: 12 Nov 2021 08:25 AM PST
Bearish persistence below the price zone of 1.2050-1.2000 allowed the recent downtrend to be established. So, the EURUSD pair has expressed significant bearish decline while the price level of 1.1650 stood as a prominent demand level that prevented further bearish decline. The bullish pressure that originated around 1.1650 failed to push higher than the price level of 1.1900. That's why, another bearish pullback towards 1.1650 was executed. Bullish signs were expected around the price levels of 1.1650-1.1700 as it corresponded to a recent previous bottom. However, extensive bearish decline has pushed the EURUSD pair towards 1.1600 and lower levels was about to be reached if sufficient bearish momentum was maintained. Moreover, significant bullish recovery has originated recently upon testing the price level of 1.1570. The recent bullish pullback towards 1.1650-1.1680 was expected to offer bearish rejection and a valid SELL Entry. Significant bearish decline brought the EURUSD pair again towards 1.1550 levels which stood as an Intraday Support zone. Hence, sideway movement was expected until bearish decline occurred towards 1.1450 again. Please note that any Bullish movement above 1.1680 should be considered as an early exit signal to offset any SELL trades. The material has been provided by InstaForex Company - www.instaforex.com |
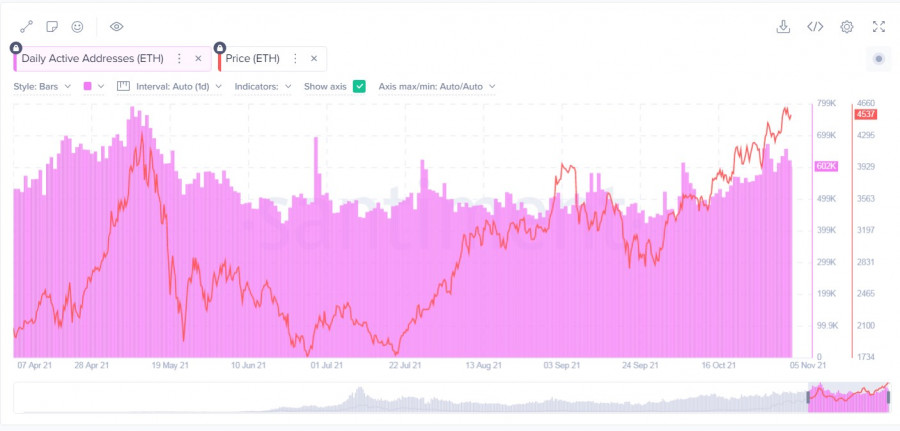
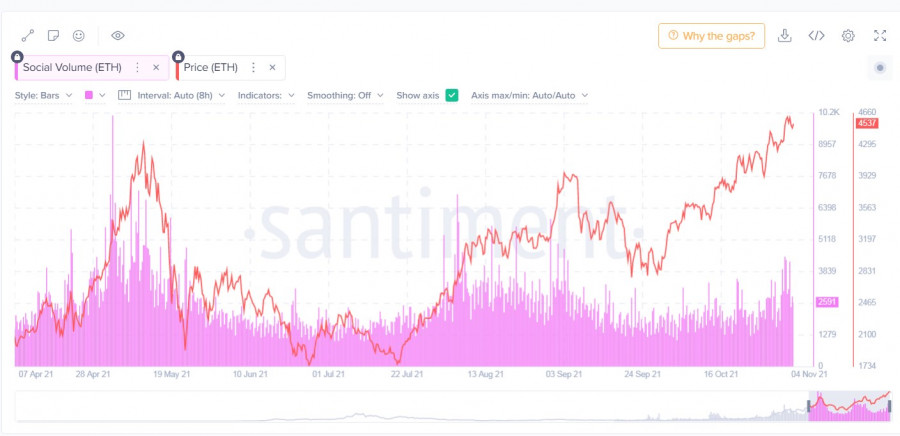
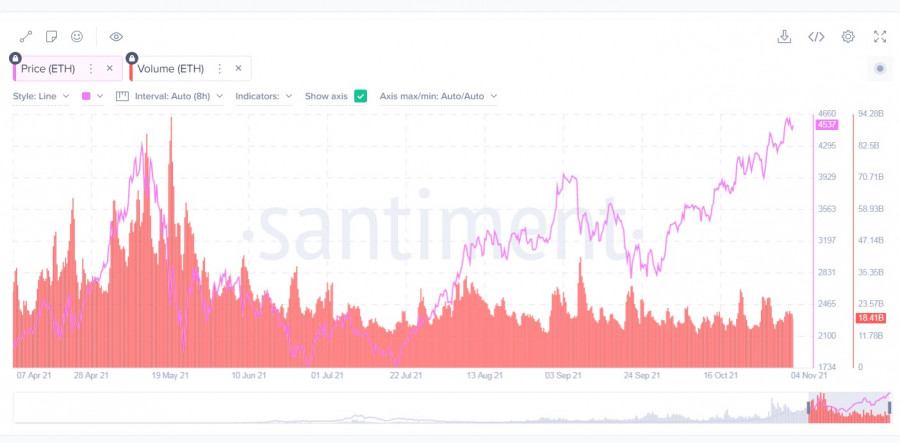
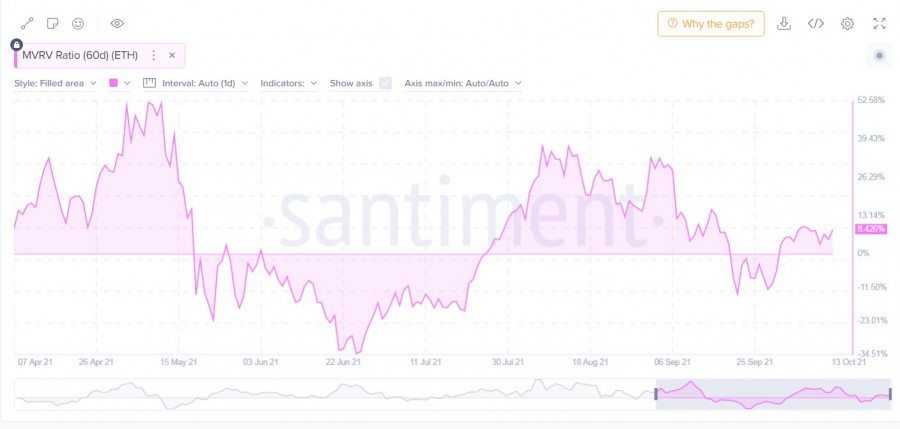
| Ethereum approaches correction: why is it good? Posted: 12 Nov 2021 08:24 AM PST After a productive two weeks, during which Ethereum hit its all-time high several times, the coin suspended its upward movement. As of November 12, Ethereum is trading in a narrow range with a constant bias towards the lower border of the channel. At the same time, there is a certain decline in the network activity, and the decision to introduce ether into the Discord messenger was negatively perceived by users and was canceled. Taking this into account, the likelihood of a correction in the main altcoin market increases significantly. In addition to the fundamental factors that provoked a significant collapse of most classic markets and the cryptocurrency market, the decline in activity in the main network indicates the correction of ETH. Over the past two weeks, ether quotes have updated the historical maximum several times, and this process has always been accompanied by an increase in on-chain indicators and trading volumes. Now the situation is changing, and the divergence hidden behind the impulsive activation of traders has begun to manifest itself in all major metrics. The number of active addresses in the asset's network stopped the upward movement, despite the continuation of the price rally. The indicator stopped at 600,000 and has not been able to overcome it for more than two weeks. At the same time, impulsive jumps in the growth of the number of addresses are noticeable shortly before the establishment of new historical highs, which locally contributed to hiding the growing divergence. Similar dynamics can be traced in the trading volumes, which are trying to rise above the level of the first maximum, but fail and begin to decline.
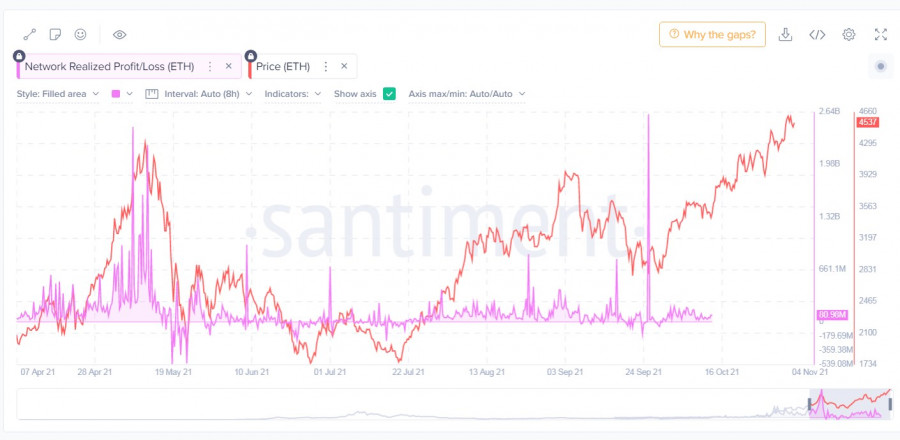
In addition, there is an atypical situation when investors are in no hurry to fix profits, despite the establishment of several historical records in a short period of time. This suggests that traders continue to play for an increase and are waiting for more profitable positions to exit the asset. The NPL indicator reflects the lack of demand for the sale of ether, which suggests that the market is overheated. Santiment experts believe that the price continues to grow by inertia, but soon the divergence will reach the point of no return, after which a powerful corrective wave will begin. Taking into account the fact that most investors are in the black, according to the MVRV metric, which crossed the +8% mark, we can expect the start of a panic sale in the hope of keeping the maximum profit.
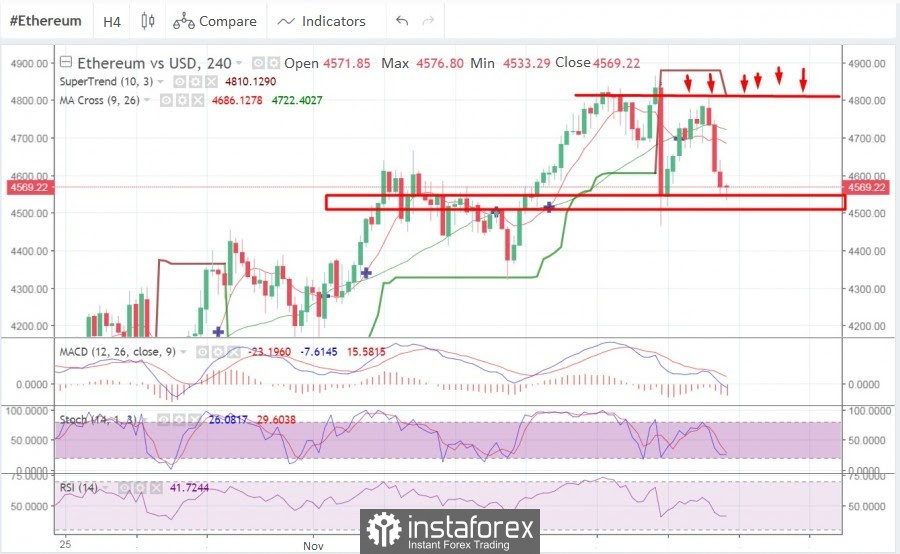
Meanwhile, on the four-hour chart, the cryptocurrency is prone to decline, and sellers' positions are much more confident than buyers. In two days, the price has formed two confident bearish impulse candlesticks, which is a strong signal for a decline. The bulls tried to resume the upward momentum and push the price above the supertrend line, but the quotes failed to pass the resistance zone at $4,800. Technical indicators of the cryptocurrency also signal a further decline in the price and a move to the support zone at $4,600. The MACD crossed the zero mark and fell into the red zone, which indicates the attenuation of the medium-term upward momentum. At the same time, the stochastic oscillator and the relative strength index demonstrate the prerequisites for recovery: the stochastic moves flat and can form a bullish intersection, and the RSI resumes its upward movement to the bullish zone at around 50.
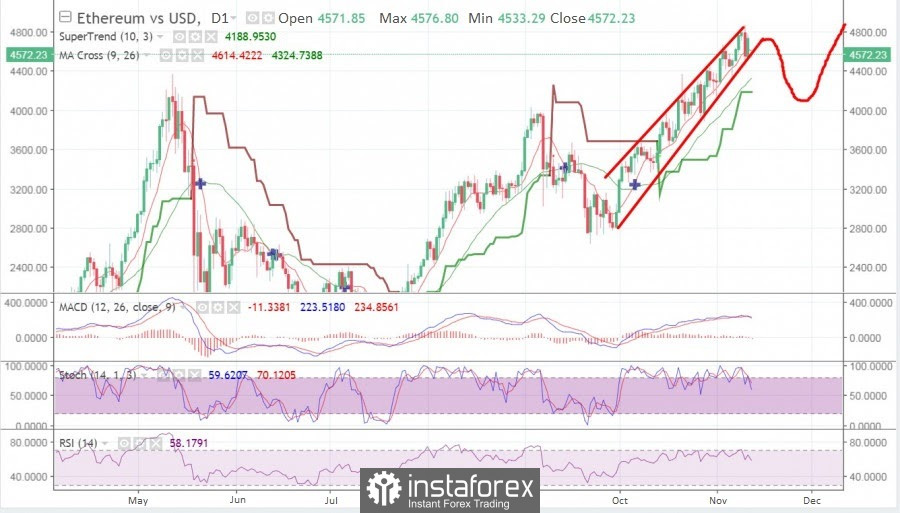
On the daily chart, you can see that the confident medium-term upward trend of the ether has been going on since September 30 and since then the coin has not made a single impulsive decline. In addition, the previous trading day ended on a bullish note, but with an unpleasant aftertaste, as the bulls failed to contribute to the formation of a "bullish engulfing" pattern. This indicates weak activity of buyers and the growing strength of bears, which will become a catalyst for a downward movement. Technical indicators also signal the weakness of the upward trend: the MACD formed a bearish intersection and began to decline, while the stochastic and the RSI index are moving towards the 50 mark and risk leaving the bullish zone, which will indicate the complete dominance of sellers.
Considering the on-chain and technical analysis of Ethereum, there is every reason to believe that the coin will go for a correction, which should be taken as normal during a continuous monthly upward trend. Taking into account that the price has already touched the Fibo level of 1.618, we should expect the start of a correction on the weekend. The nearest key support levels for the cryptocurrency are located in the $4,250-$4,300 zone, but most likely the price will continue to decline to deeper positions. The most likely places for a rebound will be $3,970 and $3,660, where a new BOOM of activity may occur. It is necessary to take liquidity from this zone after three cost records in two weeks. Such a deep correction contributes to an even more powerful rally, which promises to coincide in the time frame with the full launch of the deflationary protocols of the cryptocurrency. The material has been provided by InstaForex Company - www.instaforex.com |
| November 12, 2021 : GBP/USD Intraday technical analysis and significant key-levels. Posted: 12 Nov 2021 08:23 AM PST
The GBPUSD pair has been moving sideways with some bearish tendency while bearish breakout below 1.3600 was needed to enhance further bearish decline. On the other hand, the nearest SUPPLY level was located around 1.4000 where bearish rejection and a valid SELL Entry was anticipated. The recent bullish rejection witnessed around 1.3600 as well as the temporary bullish breakout above 1.3830 indicated a high probability that this bullish movement may pursue towards 1.4025 then 1.4100. However, the pair remained trapped within a fixed price range until significant bearish momentum emerged into the market. Bearish breakout below 1.3680 enabled further bearish decline towards 1.3400 which corresponded to 123% Fibonacci Level of the most recent bearish movement. This was a good entry level for a corrective bullish pullback towards 1.3650 and 1.3720 which was temporarily bypassed. Shortly after, the pair was testing the resistance zone around 1.3830 where bearish pressure originiated into the market. Currently, the short-term outlook is bearish as long as the pair maintains its movement below 1.3730 and 1.3570. Another bearish visit was expected towards 1.3400 where significant bullish rejection was expressed as it corresponded to significant Fibonacci Expansion Level. Any bearish decline below it will probably enable more bearish extension towards 1.3270. On the other hand, the price level of 1.3570 stands as an intraday resistance level to be watched either for bearish reversal or a continuation pattern upon any upcoming visit. The material has been provided by InstaForex Company - www.instaforex.com |
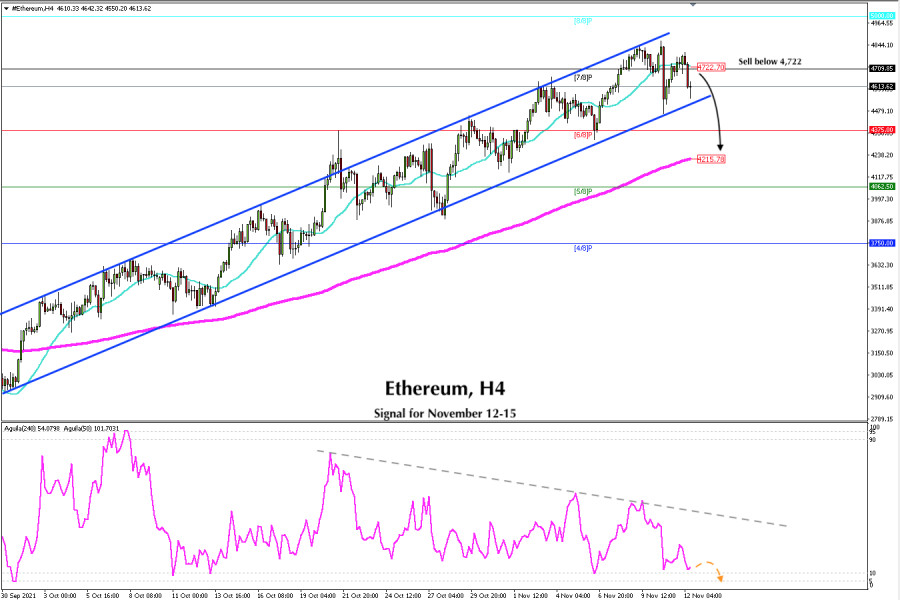
| Trading signal for Ethereum (ETH) on November 12 - 15, 2021: sell below $4,722 (7/8) Posted: 12 Nov 2021 07:54 AM PST At the beginning of the American session, Ethereum (ETH) is trading below 7/8 murray and below the SMA of 21 located at 4,722. It is likely that the downward correction will continue and may reach the bottom of the uptrend channel. A decisive and sharp break below the uptrend channel formed since September 29 could accelerate the decline of Ether to the 200 EMA located at 4,215.
In the meantime, we expect a consolidation below 4,700, and it will be an opportunity to continue selling with targets up to the support 6/8 murray around 4,375. A return in the price of Ether above 4,800 would open the bullish scenario and could help reach the psychological level of 5,000 located at 8/8 of murray. Cryptocurrency market sentiment is showing some caution in the face of rising US inflation. Consequently, investors are taking refuge in gold and some altcoins. If BTC does not gain any more momentum and remains below 65,000, it could drag ETH lower, and it could fall to the support level of 4,215, zone of the 200 EMA. The key is to keep an eye on the 21 moving average while Ether trades below this zone. The technical correction is expected to continue and in the short term it may fall to the psychological level of 4,000. Support and Resistance Levels for November 12 - 15, 2021 Resistance (3) 4,937 Resistance (2) 4,811 Resistance (1) 4,677 ---------------------------- Support (1) 4,476 Support (2) 4,375 Support (3) 4,220 *********************************************************** A trading tip for ETH for November 12 - 15, 2021 Sell below 4,722 (7/8) with take profit at 4,375 (6/8) and 4,215 (EMA 200) stop loss above 4,820. The material has been provided by InstaForex Company - www.instaforex.com |
| Posted: 12 Nov 2021 07:46 AM PST
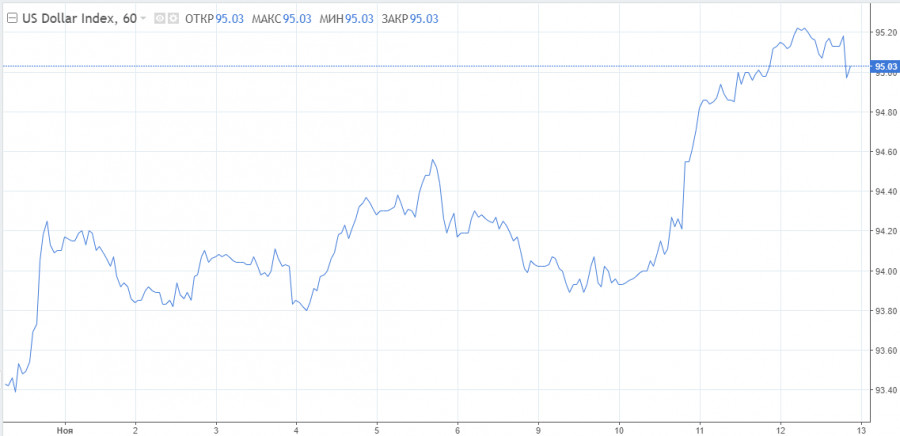
The US currency ends the week favourably. The exchange rate has strengthened markedly in recent sessions and analysts expect it to continue to rise in the coming months. The dollar index was near 95.50 on Friday. This is the level of the middle of last year. Next, buyers will target 96.00. The reason is evident: rising inflation and the labor market are leading to speculation of an accelerated stimulus tapering, which implies the first Fed rate hike next year. A policy tightening in summer of 2022 is the most optimistic forecast. Markets assume that the Fed will have to raise rates. Moreover, the US authorities no longer believe inflation is temporary. However, this fact is not acknowledged officially. MUFG Bank representatives said that the short-term outlook for the dollar remained positive, and the sharp rise in Treasury yields amid high inflation continued. They noted that the 10-year Treasury and bond yield spread was testing the level of 180 again and might break it for the first time since early March. The managers also added that usually the increase in volatility of the government bond market tended to stimulate the growth of the US currency that year.
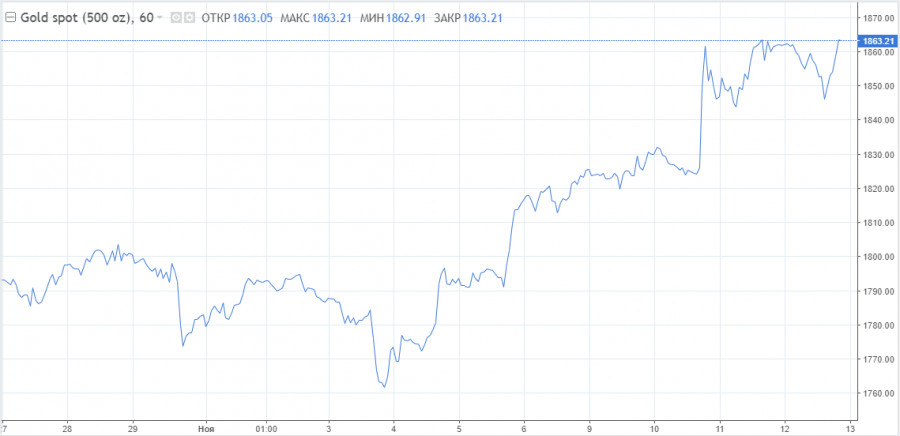
The US regulator will likely become one of the first major global central banks, who decided to take such a step. Taking into account the dollar's significance and its share in international finances, the Fed's actions will be perceived much differently than those of other regulators. Apart from the strengthening of the dollar, precious metals have increased sharply. Gold is rising despite the fact that its price is quoted in US dollars. Gold is very sensitive to changes in monetary policy, especially when it concerns the US Central Bank. Currently, inflation risks are of key importance. If the Fed will continue to state that inflation is temporary and will not take any action, while the growth of consumer prices will continue, an increased price rise in gold is possible. Notably, the yellow metal is used by investors as a protective asset, including inflationary risks. The XAU/USD pair is declining before the weekend, so investors are likely to take profits. However, growth is still possible. Then the Fed is to take action, i.e. to adopt or not the inflation measures. The XAU/USD pair was trading near 1850 on Friday and the downward correction could go deeper into the significant short-term support at 1835. The bullish trend will not be affected. As long as gold is above the key support levels of 1800, 1797, growth is highly favourable.
If the local resistance level, 1868, is broken, the XAU/USD pair will continue growing. The recent events on the markets made the strategists of Societe Generale revise the forecasts for gold. The XAU/USD pair is expected to trade at an average of 1,950 in the first quarter of next year. The bank officials believe the Fed is unwilling and will not raise rates in the near future. Monetary and fiscal policy will remain accommodative. This fact together with high inflation, creates a perfect combination of negative real rates for gold. Rising gold is a temporary phenomenon as the situation normalizes, that is, by the fourth quarter of next year, the XAU/USD pair will go back down to 1700. Platinum is becoming more expensive as well. It becomes the main target for bying by those investors who want to dilute positions on gold and silver. Platinum prices rose despite the pessimism of analysts about the metal. The chart of platinum, led by gold, gained a bullish momentum. Besides, this week may end with an increase of 5%, which is a powerful gain in a month and a half. In the short and medium term, this metal can break the levels of $1124 and $1155, according to the forecasts of technical analysts. The levels of $1050 and $1030 will be considered as support. The material has been provided by InstaForex Company - www.instaforex.com |
| Johnson & Johnson announced the separation of the corporation Posted: 12 Nov 2021 07:41 AM PST On Friday, it became known that the American pharmaceutical giant Johnson & Johnson plans to separate its business project into a separate public company aimed at producing products to ensure the health of consumers. According to the company's release, the separation of J&J will lead to the formation of two international leaders capable of implementing more narrowly focused business ideas. So, Johnson & Johnson plans to separate the consumer goods division into a separate company within 1.5-2 years.
In addition, the chief executive officer of Johnson & Johnson, Alex Gorsky, said that after the separation of the consumer goods division into a separate business, the company plans to conduct an IPO of the securities of the new company in the US stock market. Another important news from J&J was the announcement that from January 3, Gorsky will transfer his powers to Joaquin Duato. To date, Johnson & Johnson is the world's largest company selling health products. The corporation includes 265 companies in 60 countries of the world, the total number of Johnson & Johnson employees is more than 126,000 people. Among the most popular brands of the pharmaceutical giant is Clean & Clear, Johnson's baby, and Reach. Stock market participants instantly reacted to the spectacular news from J&J with a positive attitude, and soon the securities of the American company rose in value by 5% to $ 171.5 per share. Later, the quotes began to decline to 4%, and their price sank to $ 169.7. Recall that on the eve of the future division into several separate businesses, General Electric and Toshiba corporations announced. Thus, General Electric plans to split into three public companies by the beginning of 2023, and the Japanese concern Toshiba will separate businesses by March 2024. The material has been provided by InstaForex Company - www.instaforex.com |
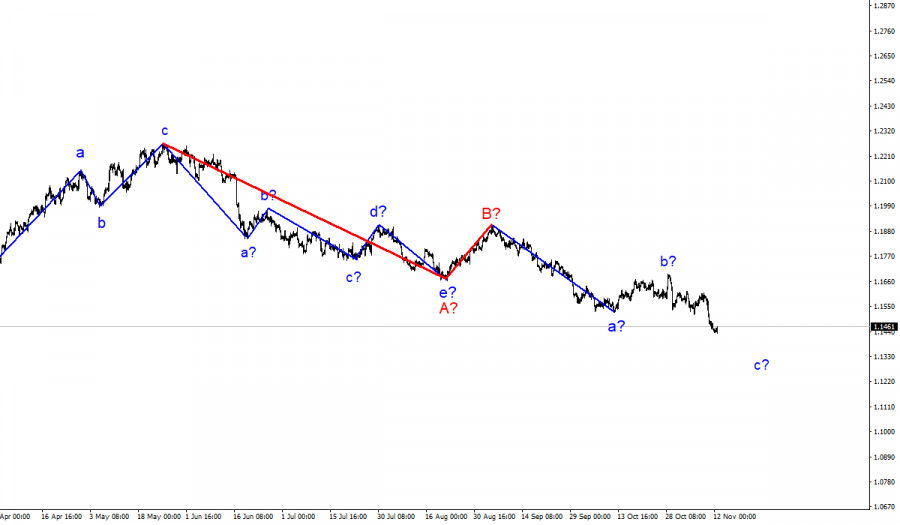
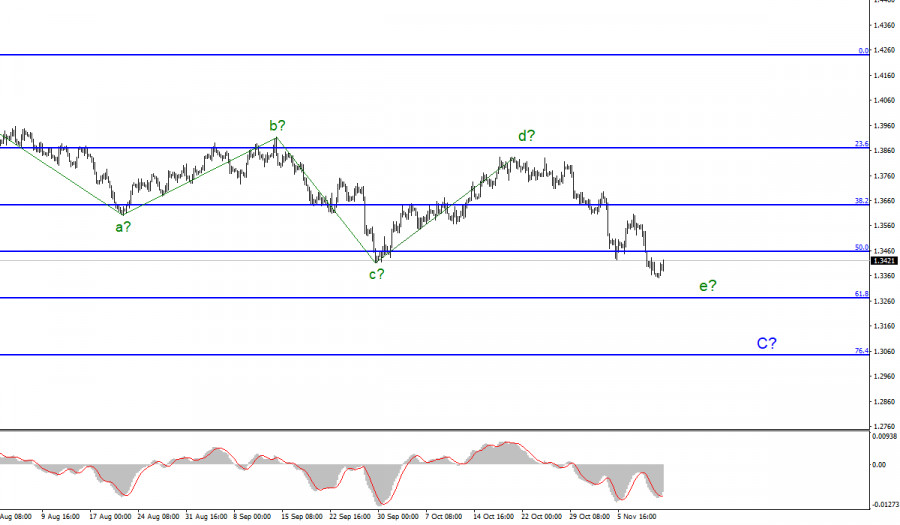
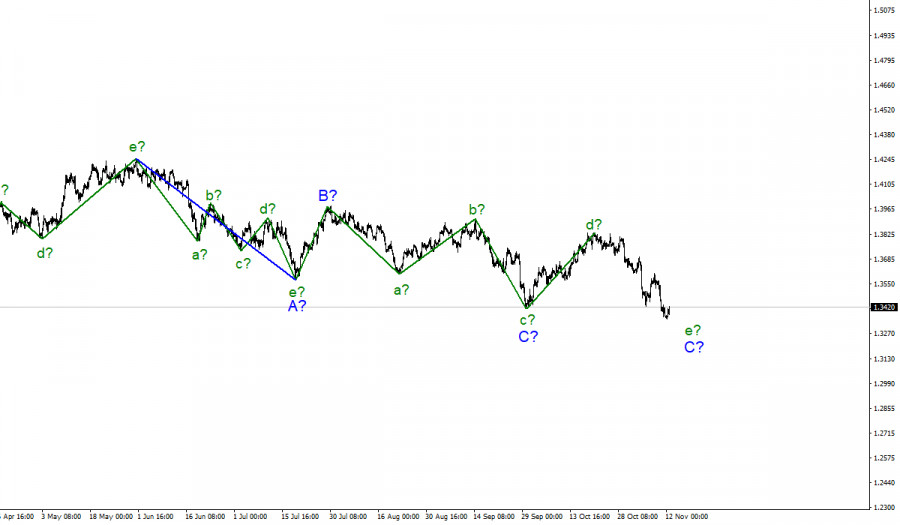
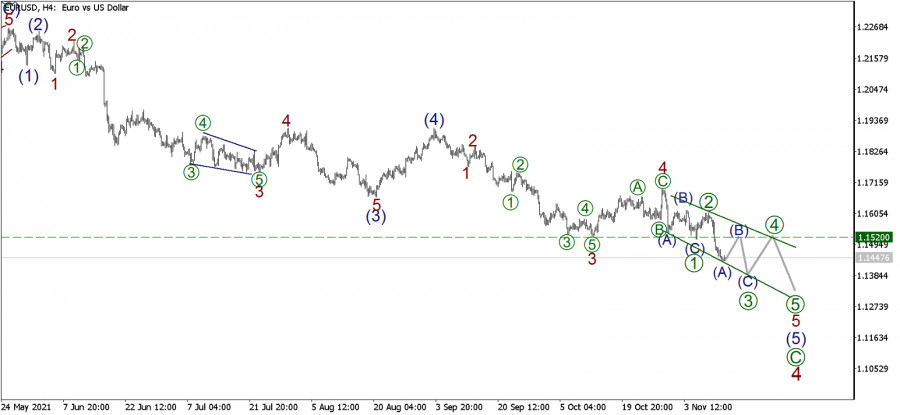
| Wave analysis of EUR/USD for November 12, 2021 Posted: 12 Nov 2021 07:26 AM PST EURUSD, H4:
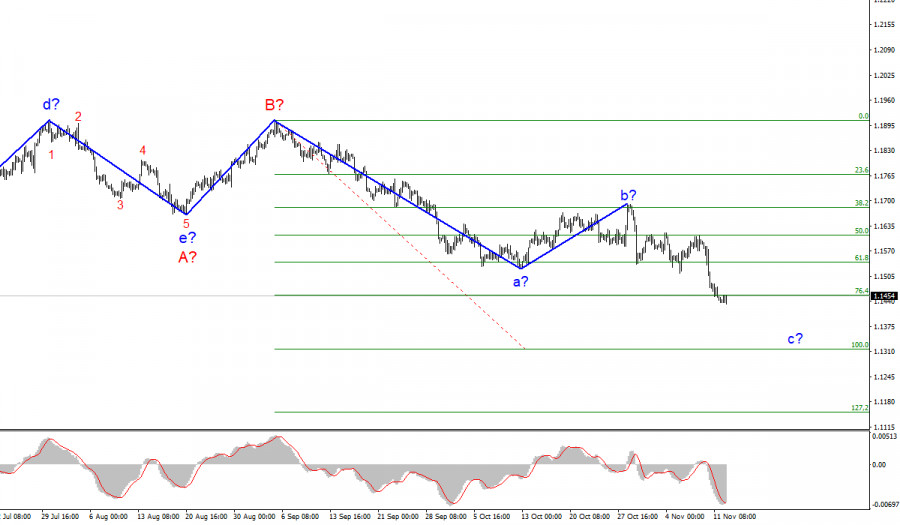
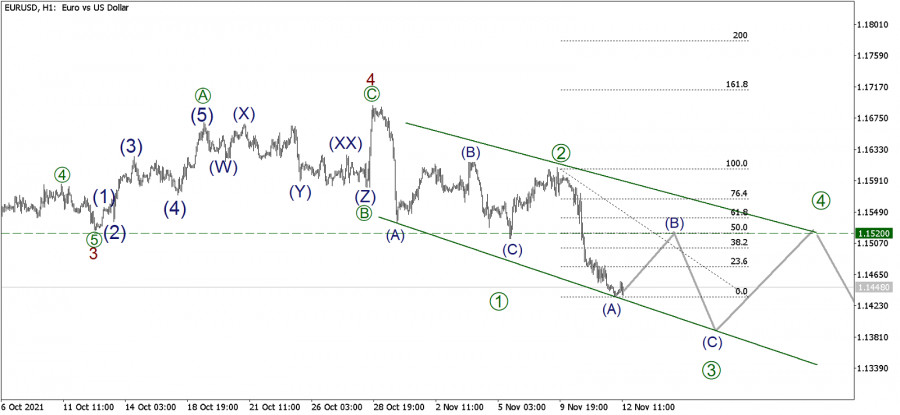
The market continues to move in a long-term downward trend. Most likely, the last part of this trend is forming. This bearish trend consists of sub-waves (1)-(2)-(3)-(4)-(5), now its last wave (5) is forming, in which we see sub-waves 1-2-3-4-5, marked with red numbers. Wave 4 was completed in the form of a zigzag, but wave 5, which is now forming, is the final diagonal. It should be noted that the final diagonal always appears at the end of the trend. Now we see the formation of wave [3] of this diagonal, consisting of sub-waves (A)-(B)-(C). Impulse (A) has been completed, correction (B) has just begun its construction. Consider the markup on H1 to clarify judgments.
We see that the impulse (A) has been completed. Now the development of a bullish correction (B) is in the initial phase, within which the price may rise in the coming trading days. We can see a rise to the 1.1520 area, at which the value of the entire correction (B) will be 50% of the previous downward impulse (A). In this regard, in the current situation, it is possible to open long positions with the target at 1.1520. Also, the upward movement of the price may be influenced by the data on the number of job openings from the Job Openings and Labor Turnover Survey (JOLTS) at 15:00 UTC. Trading recommendations: Open long positions from the current level of 1.1448 and the target at 1.1520. The material has been provided by InstaForex Company - www.instaforex.com |
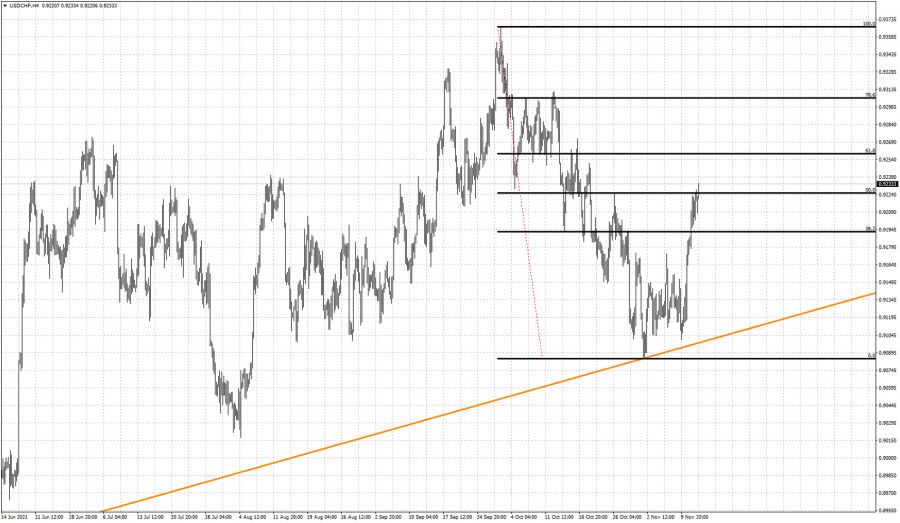
| USDCHF approaches key Fibonacci resistance area. Posted: 12 Nov 2021 05:47 AM PST USDCHF is trading above 0.9220 which was our initial target. Price has retraced 50% of the entire decline and I believe we could see a move towards the 61.8% Fibonacci retracement level over the next few hours. Short-term trend is bullish after the reversal around the 0.91 level.
Black lines- Fibonacci retracement We turned bullish USDCHF once it was testing the orange support trend line. Price has turned higher and so far broken above the 50% retracement level. I expect to see price reach the 61.8% level and at that point I would prefer to take my profits if I was long. So our next target is at 0.9250. Support is at 0.9170. Concluding, we remain bullish looking to take profits a little bit higher from current levels. The material has been provided by InstaForex Company - www.instaforex.com |
| EUR/USD bears tired but bulls may continue the rally Posted: 12 Nov 2021 05:46 AM PST
The greenback took a pause in growth after hitting its highest level since July 2020 around 95.25 points. Nevertheless, USD is close to perform its best week in nearly five months against itscounterparts, including the euro. The US dollar strengthened this week and broke through its two-month trading range. Experts are predicting an even greater rise in the USD. "We don't think this is the end of the move and expect the US dollar to remain strong into the first half of 2022 as we will be going into the first half of 2022 with the Fed's taper coming to a conclusion and a looming rate hike will offer support for the dollar in this period," Mizuho strategists said. The US econimic data released on Wednesday showed the biggest annual jump in consumer prices in the last 30 years and triggered the USD rise. The data questioned the Fed's claim that price pressures would be "temporary" and prompted investors to think that the regulator would raise interest rates sooner than expected. By September 2022, the Fed is expected to increase the rates twice by 0.5%. "With annual inflation now topping 6%, is this sufficient to force the Fed's hand? This long, long transitory period has to heap pressure on the Fed," Principal Global Investors specialists said. The Fed officials are still confident that inflation will come down over time, without the need to raise interest rates.
According to Mary Daly, president of the San Francisco Fed, the central bank still has to remain patient. "We need to wait to see how this percolates through the economy," before changing monetary policy in response to it," she added. "We know that the recovery from the pandemic will not be linear," Biden's Council of Economic Advisers said in a nod to prices rising still faster than anticipated. The CEA "will continue to monitor the data as they come in," the office said. "Clearly higher inflation is becoming problematic for both the Administration and the Fed," economists at ING said. With this in mind, further dollar gains look likely, especially against the euro after European Central Bank President Christine Lagarde said last week that higher interest rates next year were very unlikely, pushing back on market bets for a move as soon as next October. In its latest bulletin, the ECB acknowledged that inflation has been rising longer than previously thought, but reiterated that for the most part, price pressures are temporary. Meanwhile, the European Commission raised its estimate for eurozone GDP in 2021 to 5% from 4.3%, while the inflation forecast for this year is 2.4%. However, this news could not confirm the change in the sentiment of the ECB and help the euro. The "1.1500 support has given way in EUR/USD without much fanfare," said ING, and "technically, the spot move looks as though it can extend to the 1.1300/1330 area this month." According to some analysts, the pressure on the EUR/USD pair has an increase in US Treasury bond yields, which rose markedly after the release of US inflation data for October.
On Friday, the yield on ten-year treasuries rose to 1.573% from the previous close of 1.558%. On Tuesday (when no inflation data had been published yet) the yield in these securities was estimated at 1.439%. "Therefore, the intensity of any further EUR/USD depreciation will be determined by the bond markets again," Unicredit said. "Investors don't appear to be rushing for an intense drop of EUR/USD with earlier declines more moderate than the sell-off indicated by charts, which suggest it should have dropped to 1.12-1.10 and potentially lower," the bank added. The EUR/USD pair is currently trading at levels last seen in July 2020, and the 1.1430 mark is limiting the fall for now. Capital flows timed for the end of the week and profit taking could help the pair recover before the weekend. However, fundamental data still on the side of the dollar, especially after strong US inflation data confirmed the likelihood of earlier-than-expected tightening by the Fed, while the ECB is unlikely to change its extremely soft policy in the near future. Next week in the US, retail sales and industrial production data for October will be released. In Europe, the region's revised third-quarter GDP and last month's consumer inflation estimates will be released. As for the technical picture, a breakout of low of 2021 at 1.1436 may create a target for bears at 1.1400 and further at 1.1370. Resistance is located at 1.1500, 1.1530 and 1.1550. The short-term outlook for the pair is expected to remain negative as long as it trades below 1.1630. The material has been provided by InstaForex Company - www.instaforex.com |
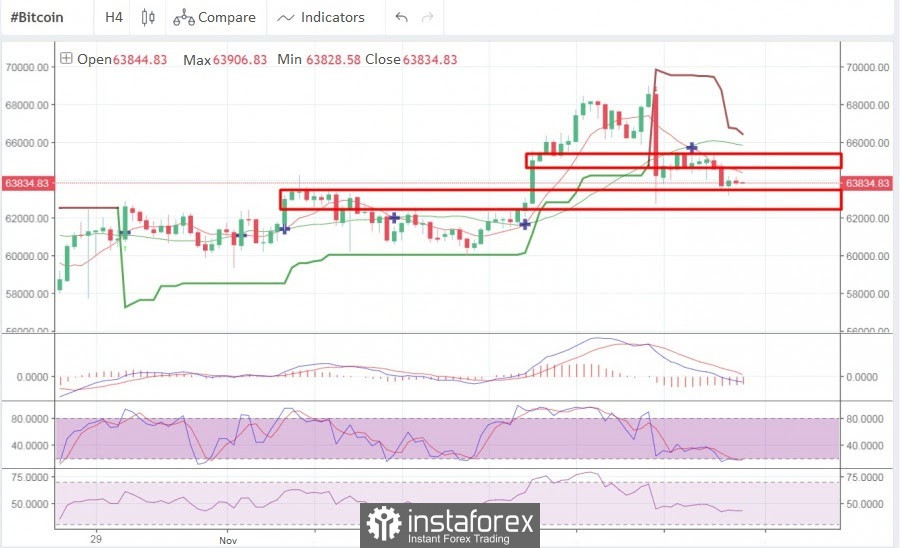
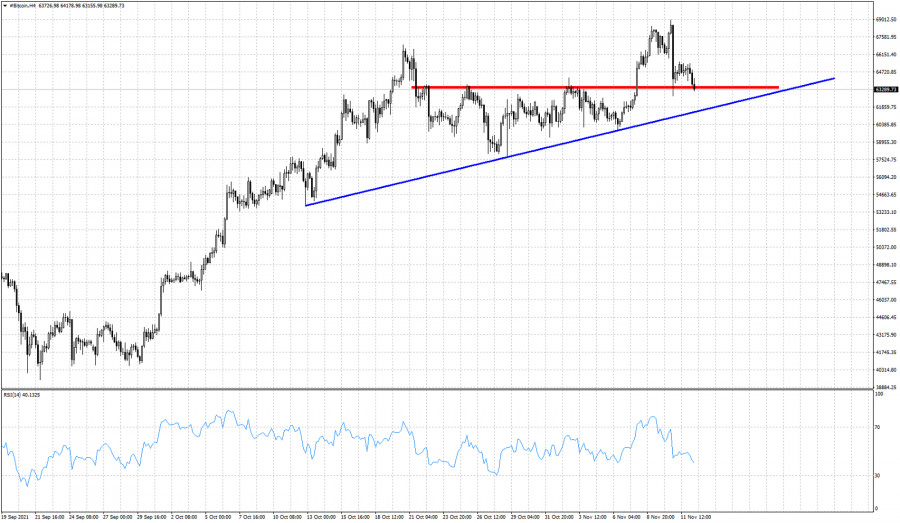
| Bitcoin back tests break out area. Posted: 12 Nov 2021 05:43 AM PST Bitcoin reached as high as $68,520 but price is pulling back towards the break out area and the horizontal support at $63,450, which was once resistance. It is important for bulls to bounce off this area in order to decrease any chances of making a false break out.
Blue line - support trend line Bitcoin has support at $63,450 and next at the blue upward sloping trend line at $61,500. Failure to stay above these two levels will be an important bearish signal. Such price action would suggest that the break out was a trap and a fake move to trap more bulls. Bulls need to defend these two support levels and push prices higher. Concluding, trend remains bullish as long as price is above $61,500. The material has been provided by InstaForex Company - www.instaforex.com |
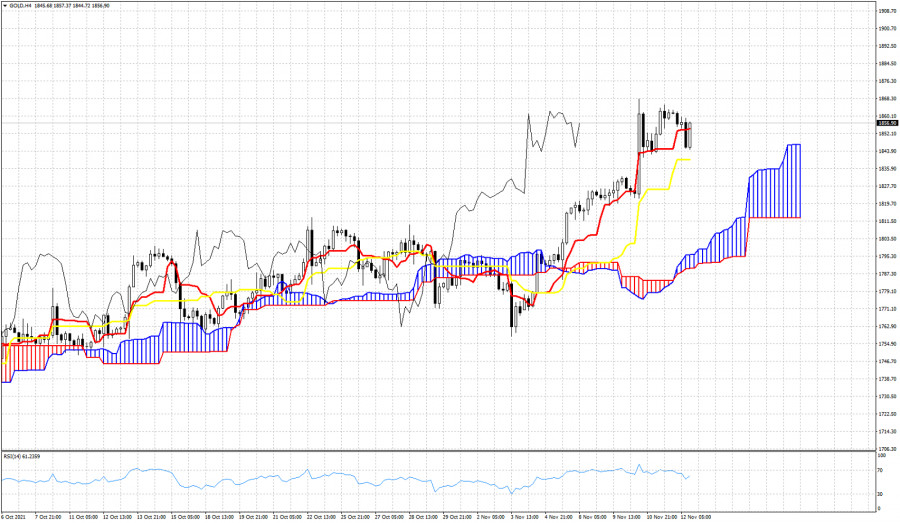
| Ichimoku cloud indicator analysis on Gold for November 12, 2021. Posted: 12 Nov 2021 05:39 AM PST Gold price remains in a bullish trend as price is above both the tenkan-sen and kijun-sen indicators in the 4 hour chart. Price continues making higher highs and higher lows after our latest bullish signal at $1,825 when price broke above the neckline resistance of the Head and Shoulders pattern.
|
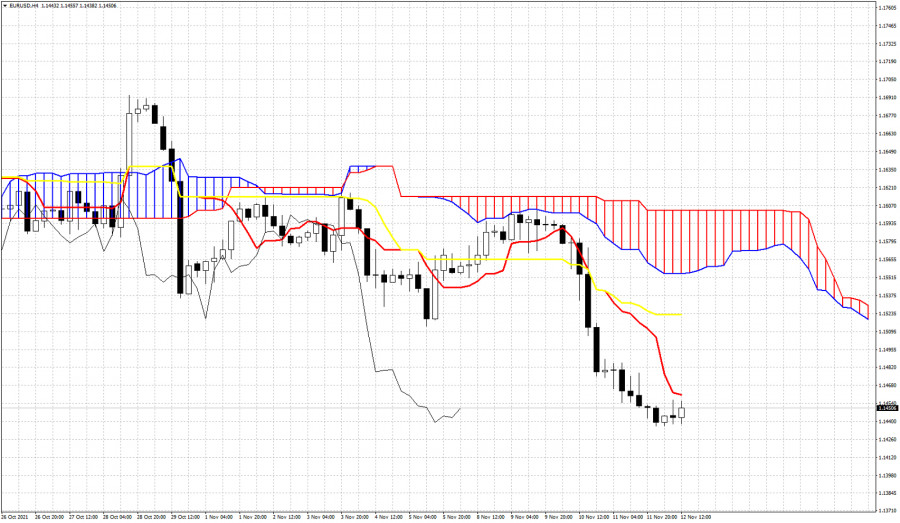
| Ichimoku cloud indicator analysis on EURUSD for November 12, 2021. Posted: 12 Nov 2021 05:36 AM PST EURUSD is in a bearish trend making lower lows and lower highs. After our latest bearish signal at 1.1535, EURUSD is found at the end of the week near the weekly lows at 1.1450. There is no sign of a reversal, however some profit taking by bears,as it is end of the week, could lift prices higher towards 1.15.
|


| You are subscribed to email updates from Forex analysis review. To stop receiving these emails, you may unsubscribe now. | Email delivery powered by Google |
| Google, 1600 Amphitheatre Parkway, Mountain View, CA 94043, United States | |


Comments