Forex analysis review
Forex analysis review |
- Trading tips for gold
- Technical analysis recommendations of EUR/USD and GBP/USD on November 17, 2021
- Why did cryptocurrencies have a sell-off?
- Trading tips for AUD/CAD
- Bitcoin dips below $ 60,000. US is holding crypto-related hearings
- Forecast of interest rate hikes in Canada and the UK
- US stocks bounce to record highs amid robust economic data
- EUR/USD reaches major dynamic support
- Gold attracts more buyers
- Bank of America says the fight of Fed against inflation could be a boon to dollar
- Trading plan for starters of EUR/USD and GBP/USD on November 17, 2021
- Bullard confirms the probability of the start of an interest rate hike in the first quarter of 2022
- Analysis and trading tips for GBP/USD on November 17
- Strong data is fueling a renewed interest in risk. Overview of USD, NZD, and AUD
- Fed openly hints at a more aggressive approach on monetary policy
- EUR/USD. Bears have already tested the 1.12 mark
- Indicator analysis of GBP/USD for November 17, 2021
- Daily Video Analysis: AUDCHF, H4 Reversal Opportunity
- Gold may gain 7% by beginning of 2022, Goldman Sachs forecasts
- EUR/USD: US dollar is rising, but the euro is not
- Trading plan for Bitcoin for November 17, 2021
- Trading tips for novice investors (analysis of yesterday's transactions) EUR/USD, November 17
- Trading plan for EUR/USD on November 17, 2021
- GBP/USD: plan for the European session on November 17. COT reports. The pound is pending important inflation data. Things
- BTC drops to $60K amid regulations tightening in US and China. When BTC to stop falling?
| Posted: 17 Nov 2021 03:06 AM PST
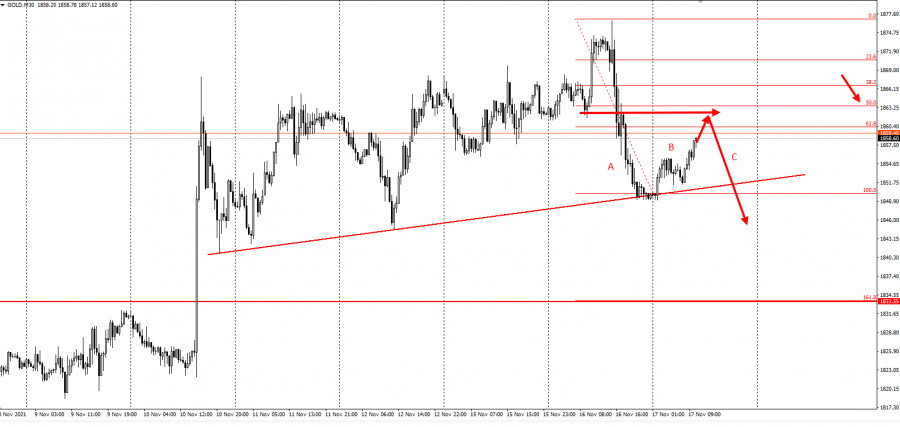
Gold declined yesterday after a week-long rally. It remained at lows until the close of the trading session. Accordingly, bulls were able to set stop loss under $ 1,845.
As seen in the chart, there are three wave patterns where wave A represents the selling pressure seen on Tuesday. This enables bears to take short positions up to the 50% retracement level of $ 1,860 - $ 1,864. As such, stop loss could be set at $1,872, while profit could be taken on the breakdown of $1,848, $1,844 and $1,840. The profitability of this transaction is 1.5:1. Good luck and have a nice day! The analysis is based on Price Action and Stop Hunting methods. The material has been provided by InstaForex Company - www.instaforex.com |
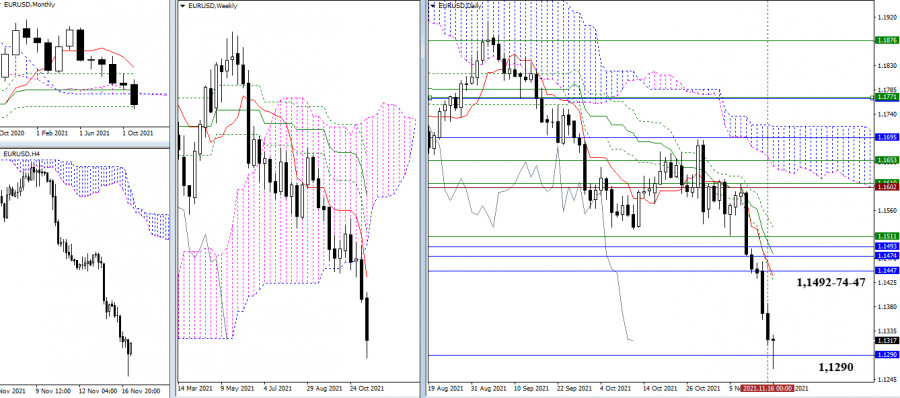
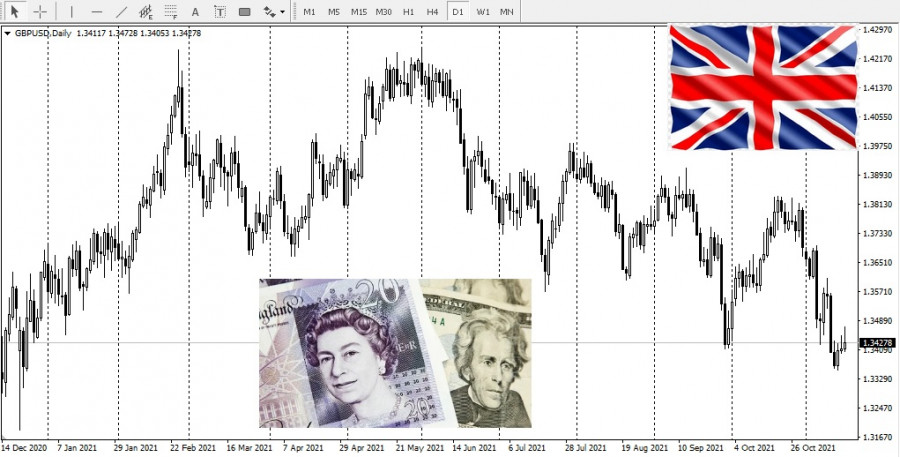
| Technical analysis recommendations of EUR/USD and GBP/USD on November 17, 2021 Posted: 17 Nov 2021 03:00 AM PST EUR/USD
The bears declined to the final level of the Ichimoku's monthly gold cross (1.1290). It should be noted that the result of the interaction is important for future prospects to appear. The breakdown of the level and elimination of the monthly cross will allow us to consider the formed bearish targets for the breakout of the weekly and monthly Ichimoku clouds as pivot points. On the contrary, the implementation of the rebound from the met support will allow us to consider the development of an upward correction. Its closest and significant pivot point in the higher timeframes is currently the resistance zone, which consists of the monthly levels of 1.1492 - 1.1474 - 1.1447 broken the day before (Ichimoku cloud + medium-term trend).
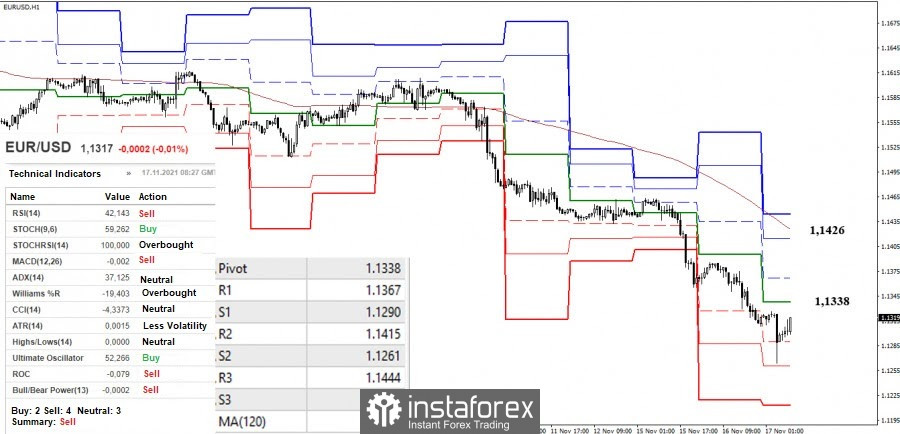
The advantage in the smaller timeframes currently belongs to the bears. They tested the second support of the classic pivot levels (1.1261), after which the third support (1.1213) remains as a guide for the intraday decline. After testing the second support, a slowdown was outlined. But if the upward correction develops, then the interests of the bulls will be directed primarily at returning themselves to the central pivot level (1.1338), and then on rising to the key resistance in the same timeframes, which determines the current advantage (1.1426). Towards the weekly long-term trend (1.1426), the nearest resistances of the classic pivot levels (1.1367 -1.1415) can be noted. GBP/USD
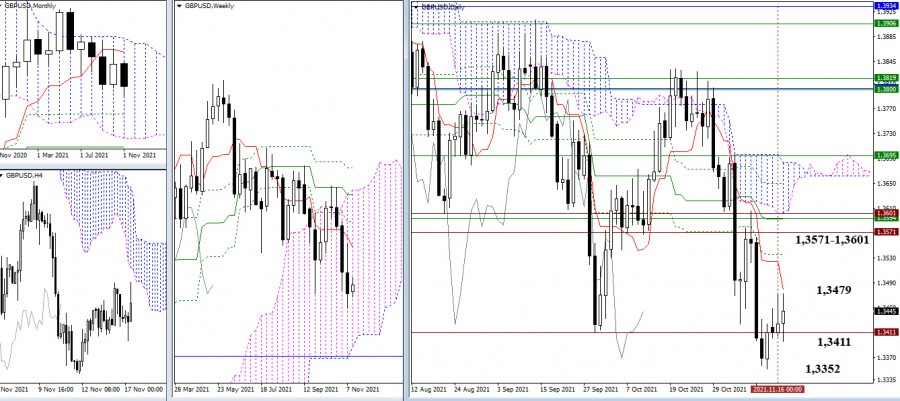
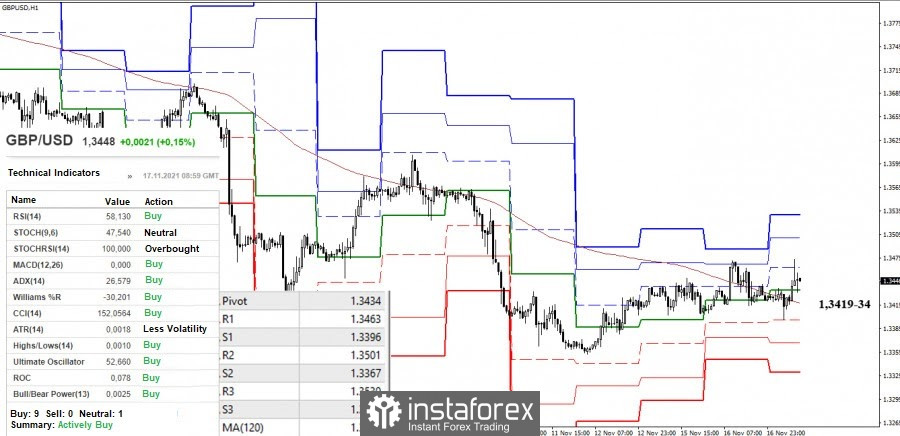
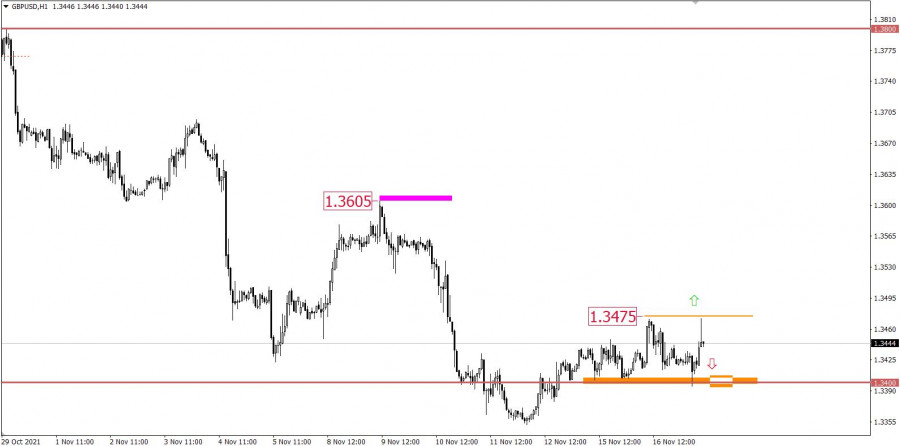
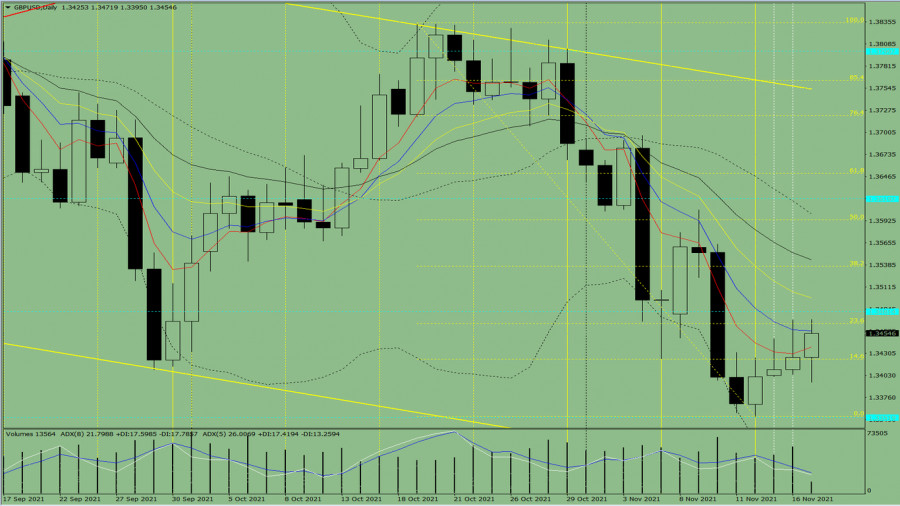
The attraction and influence zone, formed by the border of the past minimum extreme (1.3411), continues to keep the situation from developing. For the bears, it is important to break through the support level of 1.3411, update the current low (1.3352) and continue the decline. As for the bulls, it is important to identify not only deceleration but also to implement a full-fledged corrective rally, which may further strengthen the bullish mood. The nearest resistance can now be noted at 1.3479 (daily short-term trend), and the main interest is concentrated in the area of 1.3571 - 1.3601 (historical levels + weekly short-term trend + daily medium-term trend).
Bullish traders strive to achieve more than a corrective recovery of positions in the smaller periods, so they are trying to conquer the key levels, which combine their efforts in the area of 1.3419-34 (central pivot level + weekly long-term trend) today. A consolidation above will be defined as a bullish advantage. Their next pivot points can be noted at 1.3501 and 1.3530 (classic pivot levels). But if bearish activity returns below 1.3419-34 area, then the main significance will be to restore the downward trend (1.3352). *** Ichimoku Kinko Hyo (9.26.52) and Kijun-sen levels in the higher time frames, as well as classic Pivot Points and Moving Average (120) on the H1 chart, are used in the technical analysis of the trading instruments. The material has been provided by InstaForex Company - www.instaforex.com |
| Why did cryptocurrencies have a sell-off? Posted: 17 Nov 2021 02:05 AM PST
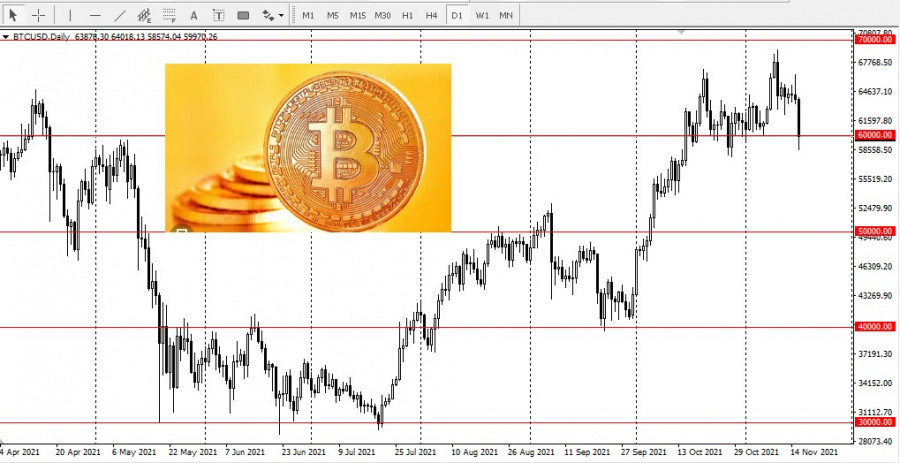
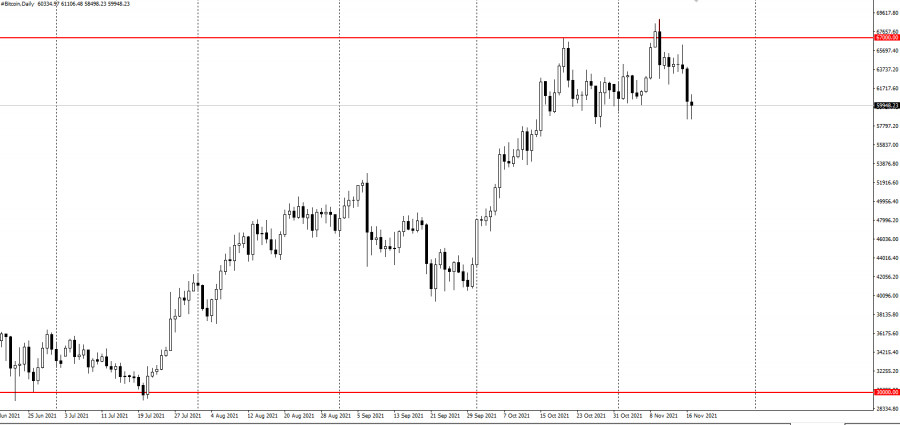
There has been a significant sell-off in the crypto space over the past 24 hours, with Bitcoin falling nearly 9%.
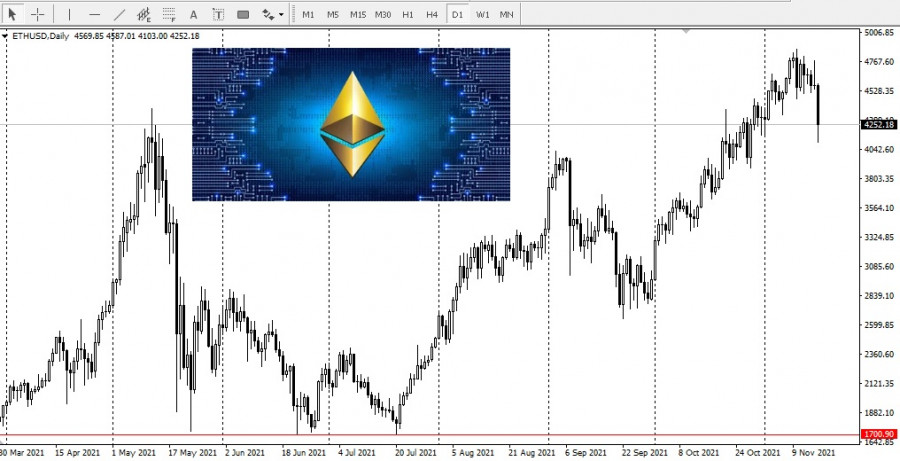
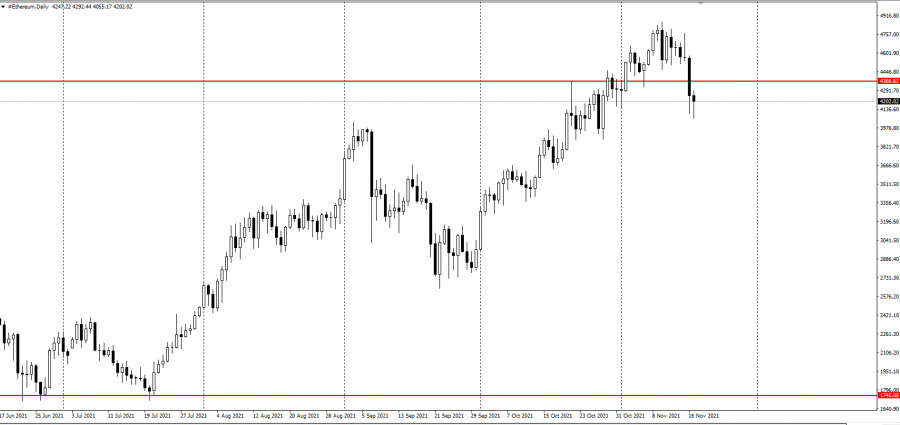
Meanwhile, Ethereum declined by 10% at some point:
The correction was widespread, and cryptocurrencies such as Solana, Binance Coin, and Cardano also suffered losses. The total market capitalization of cryptocurrencies has fallen below $3 trillion. Earlier, it was at $2.8 trillion. One of the reasons for the rollback was the statement of the National Development and Reform Commission (NDRC) of China that the continuation of the fight against mining is included in its plans, and in the state plans. The second reason in parallel to China's statement was the strengthening of the US dollar on expectations that the Fed will raise the interest rate at the beginning of next year by at least 1.5%. Moreover, the yield of 5-year treasury bonds has almost doubled since the beginning of August. Investors began to shift their funds simply into capital, reducing positions in other assets. China's harsh measures against mining and trading cryptocurrencies led to the collapse of the cryptocurrency market earlier this year. Nevertheless, the pullback did not cause much panic in the crypto space. It seems that both Bitcoin and Ethereum have found their bottom. OANDA's Senior Market Analyst Craig Erlam said that the $ 60,000 level acts as solid support right now, just $ 9,000 off Bitcoin's recent new all-time highs. But if Bitcoin declines below this level of $ 60,000, the analyst warned that it could face a larger sell-off. Well-known economist Mohamed El-Erian reported this week that he bought Bitcoin a few years ago when it was worth $ 3,000, and then sold it at a price of $ 19,000 a few months before it reached $ 60,000. El-Erian added that as soon as speculation disappears from the market, he will buy it again. The material has been provided by InstaForex Company - www.instaforex.com |
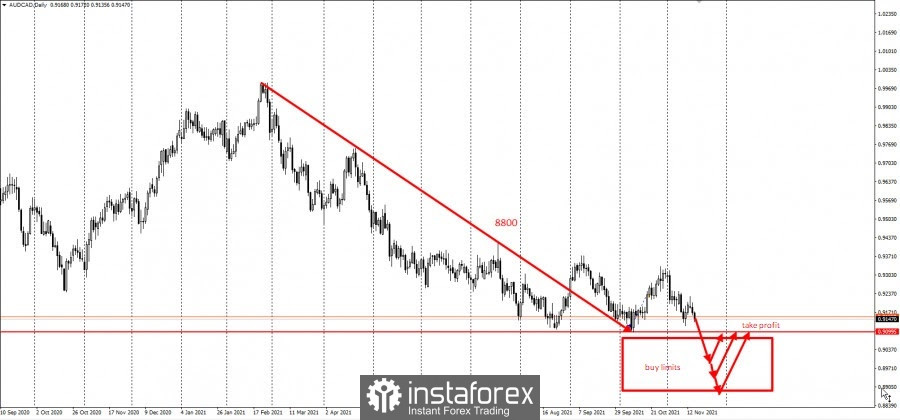
| Posted: 17 Nov 2021 01:56 AM PST AUD/CAD has lost around 9,000 pips over the past year and is currently trading at the lows of October and this year - 0.91. Traders can provoke a false breakout by doing this strategy:
As presented in the chart, a false breakout could occur if we place buy limits from 0.91 and below, with an increment of 500 pips. Take profit on the breakout of 0.91, or at 1 pip above the first order. This strategy is called grid trading, which is usually used on cross rates. It involves holding positions that are significant in time and distance. For this reason, it is recommended to use swap-free accounts, not increase the volumes in the grid (0.01 standard lot for every $ 1000 of the deposit) and monitor price movements. Good luck and have a nice day! The material has been provided by InstaForex Company - www.instaforex.com |
| Bitcoin dips below $ 60,000. US is holding crypto-related hearings Posted: 17 Nov 2021 01:49 AM PST
Bitcoin continued to plunge and is now trading below $ 60,000, the lowest level in three weeks. The reason was increased concerns on US taxation and stronger crypto crackdown in China.
According to data, BTC is down 3% to $ 55,500, declining for four consecutive days. Ethereum also fell 4% to $ 4,055, its lowest level since October 28. All major tokens have dropped by at least 10% over the past seven days.
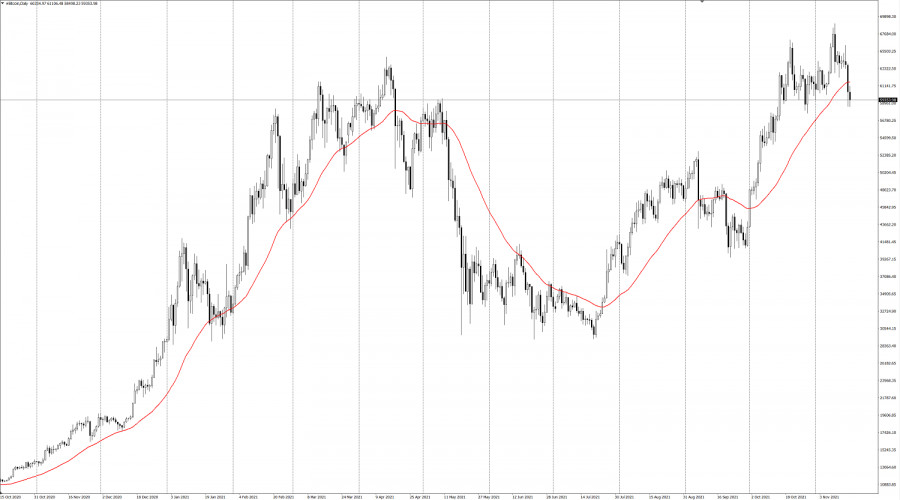
The crypto industry initially performed very well this year, but concerns over tax provisions in the US and ongoing crackdown from China have dampened momentum. Nevertheless, the hash rate, which measures the processing power of Bitcoin, has largely recovered from its mid-year crash when China resumed its crackdown on the crypto industry. Bitcoin was near its 50-day moving average during Tuesday's plunge, but prices retreated below $ 60,000 on Wednesday.
Today, all attention should be given to the US Congress, as it will hold hearings related to cryptocurrencies. The material has been provided by InstaForex Company - www.instaforex.com |
| Forecast of interest rate hikes in Canada and the UK Posted: 17 Nov 2021 01:43 AM PST
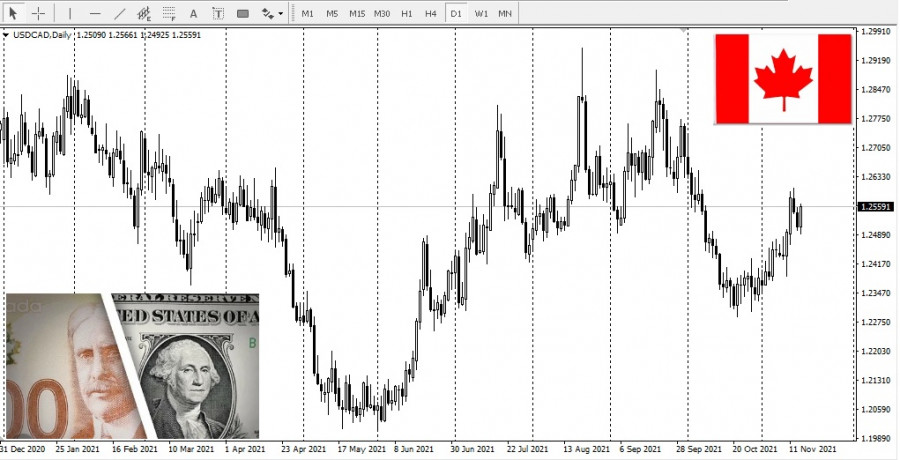
Governor Tiff Macklem said that the Bank of Canada is not going to raise its base interest rate until the weakness in the country's economy is eliminated. Macklem also noted that the central bank continues to view the recent dynamics as temporary despite the fact that the risk of inflation has increased due to increased demand, disruptions in the supply chain, and increased energy prices. He added that the basis of the central bank's policy is a flexible inflation target focused on 2% in the 1-3% control range. This means that Canadians can be confident that the bank will keep inflation under control while maintaining a full recovery. Inflation has risen sharply in recent months. The overall inflation rate in Canada rose to 4.4% in September, which exceeds the bank's target range for the sixth month in a row. Last month, the Bank of Canada announced that its first rate hike could happen as early as April 2022, and there will be only five in 2022.
On the other hand, the Governor of the Bank of England, Andrew Bailey, said he was very concerned about the prospects for inflation, and that his decision to leave interest rates unchanged earlier this month, which shocked financial markets, was very reasonable. He said the lack of official data on what happened to the roughly 1 million workers who are still on vacation made him wait a bit and not raise rates. On November 4, the Bank of England said that most of the nine members of the Monetary Policy Committee would like to wait for additional data on the labor market, saying that raising rates was the right step. This decision confused many investors who thought Bailey's previous comments meant that the Bank of England would announce a rate hike this month. Michael Saunders, one of two MPC members who voted to raise rates earlier this month, said the likelihood of overall inflation rising is high enough to justify higher borrowing costs.
|
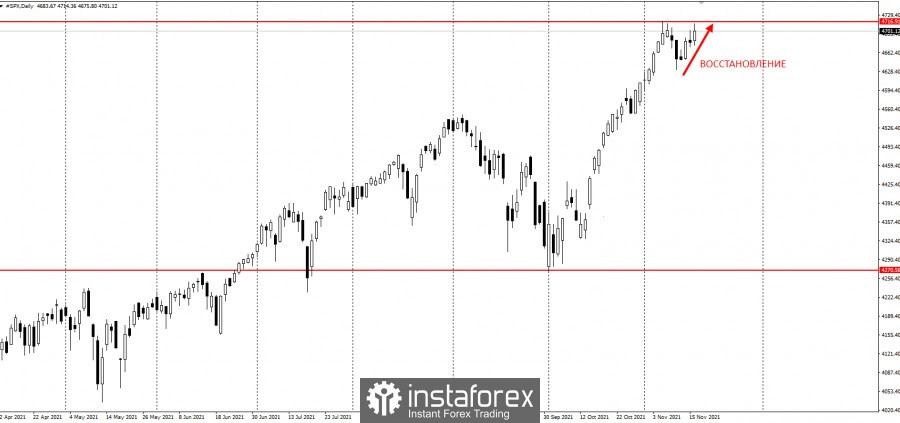
| US stocks bounce to record highs amid robust economic data Posted: 17 Nov 2021 01:37 AM PST
US stocks rose to a record high on Tuesday amid a large jump in retail sales. Strong results from industry giants such as Walmart and Home Depot showed that demand continued despite weakened purchasing power because of inflation. The data offset the comments of St. Louis Fed President James Bullard that the central bank should accelerate the tapering of monetary stimulus. All major stock indices rose, with the S&P 500 continuing its November rally.
"With the robust retail sales read and solid start to retail earnings, it's crystal clear that inflation isn't standing in the way of consumers," said Mike Loewengart, managing director of investment strategy at E*Trade Financial. "Despite some hiccups on the labor market and inflation fronts, this could serve as the vote of confidence investors needed, signaling that the economy is still chugging along nicely." On a different note, the term of Fed Chairman Jerome Powell ends in February next year. US President Joe Biden Biden interviewed him and Lael Brainard this month to choose whoever fits the role of Fed chief in the next four years. Going back, strategists at Goldman Sachs raised their outlook for US stocks yesterday and said the rally observed recently will continue into 2022. Strategists at JPMorgan Chase were also optimistic amid bets that central banks will remain dovish. Other key events for this week are: - EU CPI data (Wednesday); - US housing starts report (Wednesday); - Leading US index and jobless claims data (Thursday); - speeches of Richard Clarida and Mary Daly (Friday). The material has been provided by InstaForex Company - www.instaforex.com |
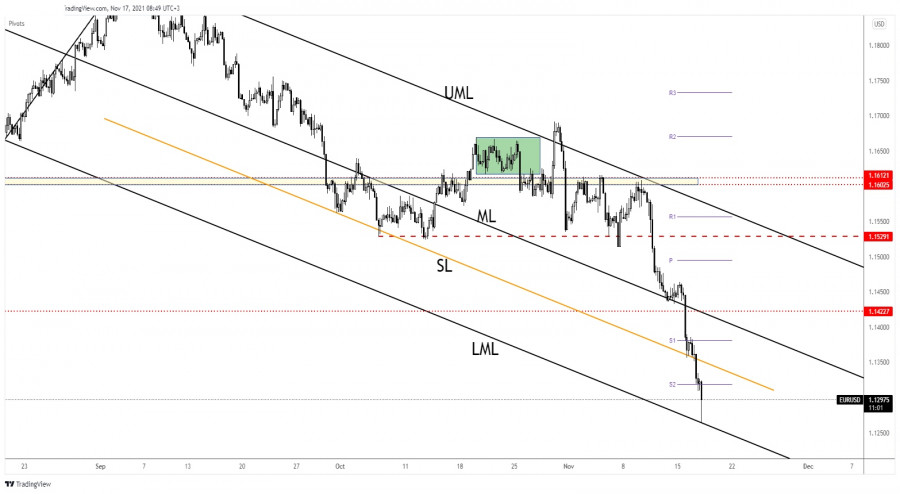
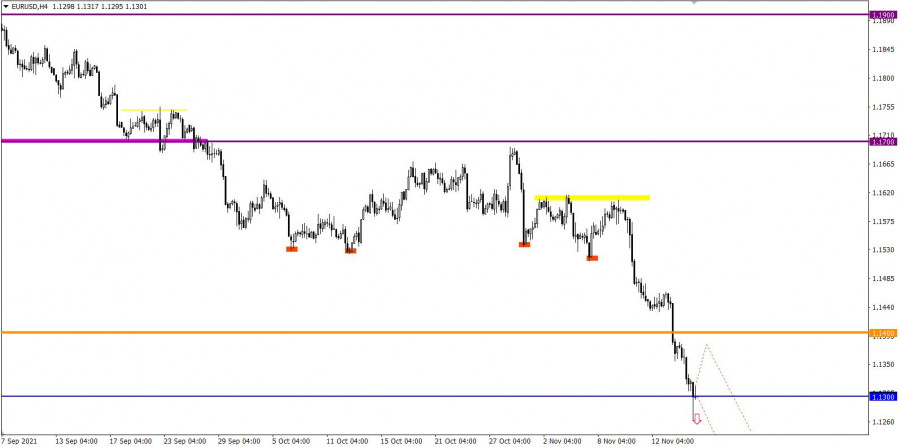
| EUR/USD reaches major dynamic support Posted: 17 Nov 2021 01:29 AM PST EUR/USD dropped as much as 1.1263 today, printing a new lower low. After the current sell-off, we cannot exclude a temporary rebound. The currency pair could come back to test and retest the near-term resistance levels before dropping again. The pair plunged as the US retail sales, Industrial Production, and the Capacity Utilization Rate came in better than expected in yesterday's session. On the other hand, the eurozone flash GDP registered a 2.2% growth matching expectations while the Flash Employment Change rose by 0.9% beating 0.6% expected. Today, the eurozone final CPI and the final core CPI could bring more action. In addition, the ECB Final Stability Review and the Italian Trade Balance will be released as well. It remains to see what will really happen as the Dollar Index could be too overbought to be able to resume its growth even if the US Building Permits and the Housing Starts come in better than expected. EUR/USD End Of Sell-Off?
Technically, EUR/USD reached the descending pitchfork's lower median line (LML) which represented a dynamic support. The price closed the last bearish candle at 1.1299 far above 1.1263 showing that the sellers could be exhausted. In the short term, EUR/USD could try to stay above the 1.13 psychological level. The pair could come back towards the weekly S2 (1.1318) and up to the inside sliding line (SL). A temporary rebound is natural. EUR/USD Prediction!After its massive drop, EUR/USD could rebound and recover in the short term. The pressure remains high as long as it stays under the inside sliding line (SL) of the descending pitchfork. Only a major bullish pattern, a reversal formation could signal a strong leg higher. The support is represented by the lower median line (LML) and by 1.1239. It remains to see how the pair will react around these levels in the coming days. From the technical point of view, a temporary rebound could bring new selling opportunities. The material has been provided by InstaForex Company - www.instaforex.com |
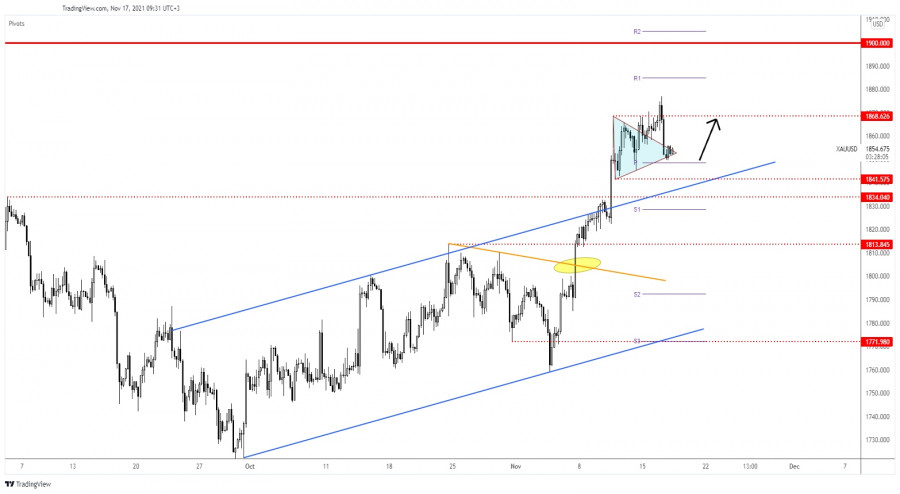
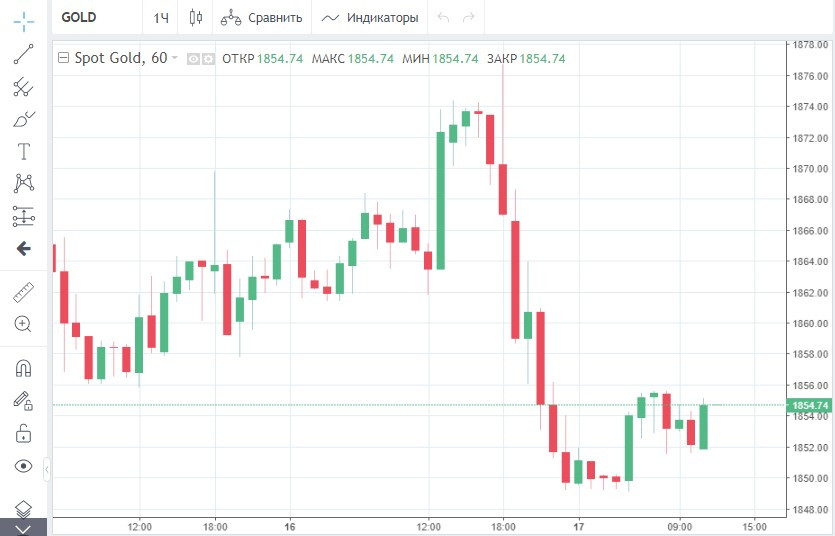
| Posted: 17 Nov 2021 01:28 AM PST Gold plunged in the short term and now is trading at 1,856.64, far below 1,877.14 yesterday's high. Still, the retreat could be only a temporary one. The yellow metal could start advancing again if the Dollar Index slips lower after its amazing rally. XAU/USD plunged after the United States Retail Sales registered a 1.7% growth in October versus 1.3% expected, while the Core Retail Sales reported a 1.7% growth versus 1.0% expected. Also, Industrial Production and the Capacity Utilization Rate come in better than expected. Earlier, the UK inflation data came in higher than expected. As you already know, Gold is used as a hedge against inflation. Later, Canada is to release its inflation figures as well. XAU/USD Temporary Sell-Off!
XAU/USD rallies at the time of writing after failing to reach the weekly pivot point of 1,848.78. Technically, it has found support on the triangle's downside line and now is fighting hard to come back higher. In the short, Gold could move sideways trying to accumulate more bullish energy before jumping higher. Coming back above 1,868.62 upside obstacle and stabilizing above this level could signal an upside continuation. Gold Outlook!Gold could still resume its upwards movement as long as it stays above 1,848.78 pivot point and above 1,841.57 low. In the short term, it could move sideways trying to accumulate more bullish energy and to attract more buyers. A small consolidation around the current levels could bring new buying opportunities with a potential target at the 1,900 psychological level. The material has been provided by InstaForex Company - www.instaforex.com |
| Bank of America says the fight of Fed against inflation could be a boon to dollar Posted: 17 Nov 2021 01:21 AM PST
The Bank of America said the fight of Fed against inflation could be a boon to dollar. Strategist Athanasios Vamvakidis explained that seeing consumer prices hitting record highs means that the economy is overheating. This situation could push dollar against other currencies like euro and yen.
That is also why St. Louis Fed President James Bullard said yesterday that the bank should take a more aggressive approach on monetary policy. As such, the dollar index peaked because expectations of a rate hike increased. Many believe that the Fed will soon raise interest rates. A survey conducted by the Bank of America indicated that investors expect the central bank to increase rates by an average of 1.5% next year. The survey was conducted on November 5-11 among investors with $1.2 trillion in assets under management. On a different note, cash distribution fell to 4.4% in November, from 4.7% in the previous poll last month. This shows that investors have increased their total capital stock and reduced their share in commodities. Meanwhile, bonds remained very undervalued, despite the yield on 5-year Treasuries nearly doubling since the beginning of August. The material has been provided by InstaForex Company - www.instaforex.com |
| Trading plan for starters of EUR/USD and GBP/USD on November 17, 2021 Posted: 17 Nov 2021 01:20 AM PST Here are the details of the economic calendar for November 16, 2021:The UK labor market data was published yesterday, where the unemployment rate declined from 4.5% to 4.3%. In turn, employment in the country increased by 247 thousand in September. The figures for England kept the pound sterling from falling. As for Europe, another estimate of GDP for the 3rd quarter was published, where the pace of economic growth slowed from 14.2% to 3.7%. It is worth considering that the result coincided with the previous assessment. For this reason, the statistics did not attract much attention from market participants. There was a speculative interest in dollar positions during the American trading session, which was caused by the US retail sales data. So, sales in annual terms were expected to slow down from 13.9% to 12.0%, but instead, there was an acceleration to 16.31%. At the same time, the previous data were revised in favor of growth from 13.9% to 14.26%. Analysis of trading charts from November 16: The Euro currency has lost more than 300 points in value in 5 trading days. This is a strong price change in a short period of time, which signals that the euro is oversold. Previously, selling positions were considered in case the price is kept below the level of 1.1350. This made it possible to enter the market at the most appropriate moment. As a result, it was possible to earn at least 50 points ($50 with a transaction volume of 1InstaLot). The GBP/USD pair adheres to the correction scheme from the variable pivot point of 1.3350, despite the fact that there has been a characteristic stagnation within the borders of 1.3400/1.3450 since the beginning of the trading week. As before, the market has a downward cycle despite the corrective course and the stagnation stage, which refers to the medium term. In this case, having price changes are only local manifestations of the market.
November 17 economic calendar: The UK's inflation data was published at 7:00 Universal time today, where the level of consumer prices rose from 3.1% to 4.2% against the forecast of 3.7%. Such significant inflation growth is not the best signal for investors, as it entails a tightening of monetary policy. In this case, the speculative mood of traders played a role. The value of the pound sterling locally increased. Meanwhile, the EU's inflation data will be released at 10:00 Universal time, where its level may coincide with the preliminary estimate of 4.1%. It is unlikely that this will put pressure on the market if expectations coincide. During the US trading session, America's construction sector data is to be published, where they predict an increase in indicators, which is considered a good signal. This may lead to a strengthening of dollar positions. Trading plan for EUR/USD on November 17: With the opening of the Asian session, speculation on the US dollar resumed. The quote of the EUR/USD pair declined to the level of 1.1263, where there was a sharp reduction in the volume of short positions. This led to a technical pullback towards the level of 1.1317. It can be assumed that the downward interest will continue in the market, where keeping the price below 1.1300 will increase the chances of speculators for a further decline. Traders will consider an alternative scenario of market development if the pullback is replaced by a full-size correction.
Trading plan for GBP/USD on November 17: The pound is showing increased speculative interest, but market participants have not yet managed to prolong the corrective course. So, the quote needs to stay above the level of 1.3475 at least in an hourly period in order for a subsequent increase in the volume of long positions to occur. Otherwise, the quote may return to the level of 1.3400. |
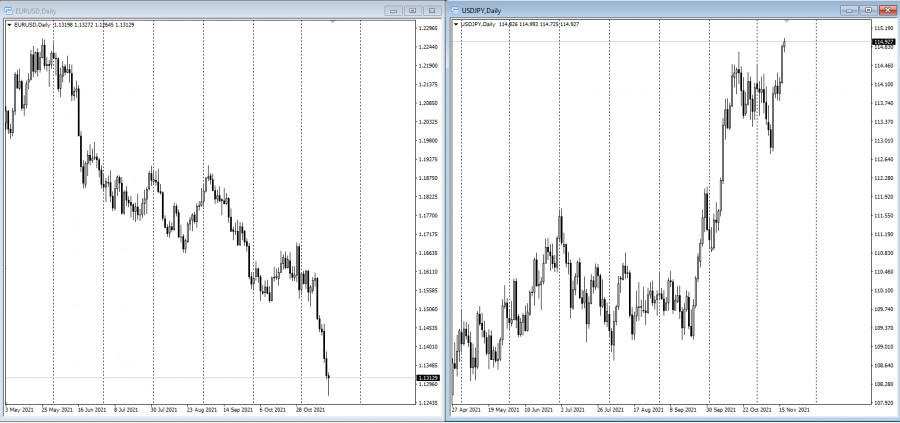
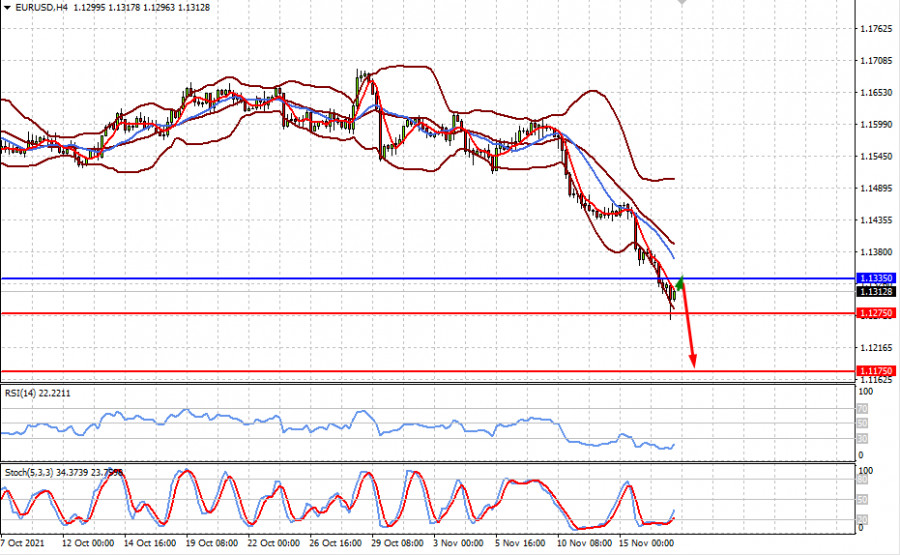
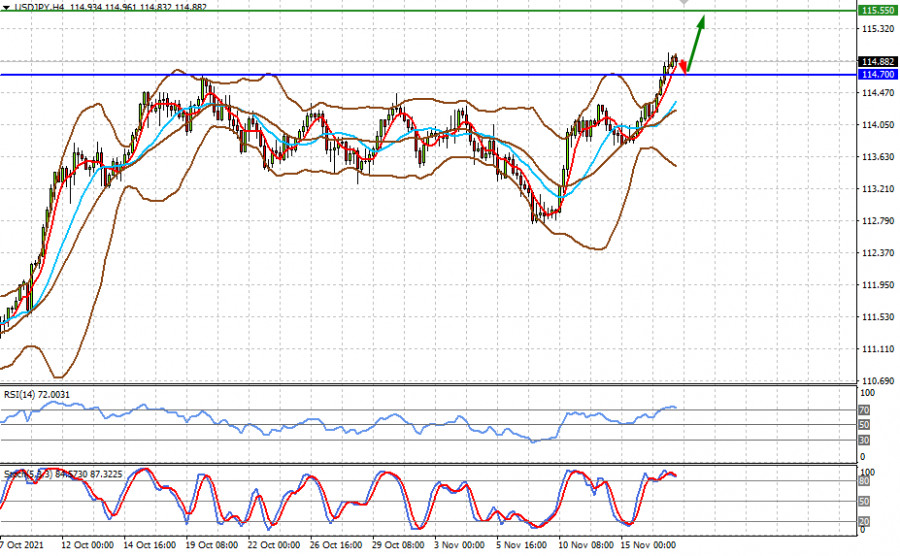
| Bullard confirms the probability of the start of an interest rate hike in the first quarter of 2022 Posted: 17 Nov 2021 12:55 AM PST The US dollar continues to increase pressure on the currency market, despite the positive economic data in America, which was published on Tuesday. This increasing pressure on the whole currency market is supported, on the one hand, by the growth of Treasury yields and, on the other, by the comments of some Fed members, as well as the published positive economic statistics. The growth of US stock indices cannot prevent this. What are the reasons for the growth of the US dollar? On Tuesday, the Fed President of St. Louis J. Bullard went even further in an interview with the press, saying that if the Fed had started to reduce the volume of asset repurchases – government bonds and corporate mortgage securities, not by the expected $ 15 billion monthly, but, for example, by $ 30 billion, then it could have already made the first increase in interest rates in the first quarter of 2022. His statement clearly coincides with our vision of the likely start date of the interest rate hike cycle, which may begin as early as February after the appointment of a new Fed chairman. We believe that it was the strengthening of inflationary pressure that prompted the previously known proponent of a soft monetary policy to completely reconsider his view on the future of the monetary policy of the American regulator. Another important signal for investors is the continued growth of the yield of treasuries, which have begun to grow again. In particular, the yield of the benchmark 10-year T-Note tends to the recent maximum of 1.705% from October 21 this year. The increase in profitability is an unambiguous factor indicating not only the fact of beginning of the process of reducing asset repurchase but also the upcoming increase in interest rates. In this regard, one more important reason should be taken into account – the beginning of a clear divergence in monetary policies between the Fed and other, primarily world banks, for example, the ECB, the Central Bank of Japan, the Bank of England, etc., which consists in the fact that these regulators will obviously not rush to tighten monetary policies, unlike the Fed, which has actually already announced this. Such prospects will definitely lead to a noticeable drop in the main currencies in the currency market against the US dollar. In addition to the aforementioned, an undoubted signal in favor of a strengthening dollar is the market's reaction to good economic data from the United States. Earlier, the US dollar was under pressure amid this news, but the figures on retail sales and their volumes in America presented on Tuesday, which showed strong growth, did not lead to its weakening. This indicates a clear change in the market's mood, where an understanding of the high probability of starting the rate hike process at the beginning of next year, and not in its second half against the backdrop of continued high inflation, is beginning to play a more important role. Will the US dollar continue to rise? Assessing the current situation, we believe that the US dollar has every chance to continue growing in the market, where the euro, yen, franc, as well as commodity currencies – Australian and New Zealand dollars, may suffer the most. In turn, the Canadian dollar, as well as the Norwegian krone, will try to hold on to the US currency on the wave of demand for crude oil. Forecast of the day: The EUR/USD pair remains under strong pressure. It can recover to the level of 1.1335, but if it keeps below it, then it will test the level of 1.1275 again with the prospect of further declining to the level of 1.1175. The USD/JPY pair is trading above the level of 114.70, from which it can make a correction. If this level holds, then the pair can be expected to reverse and resume its growth to the level of 115.55.
|
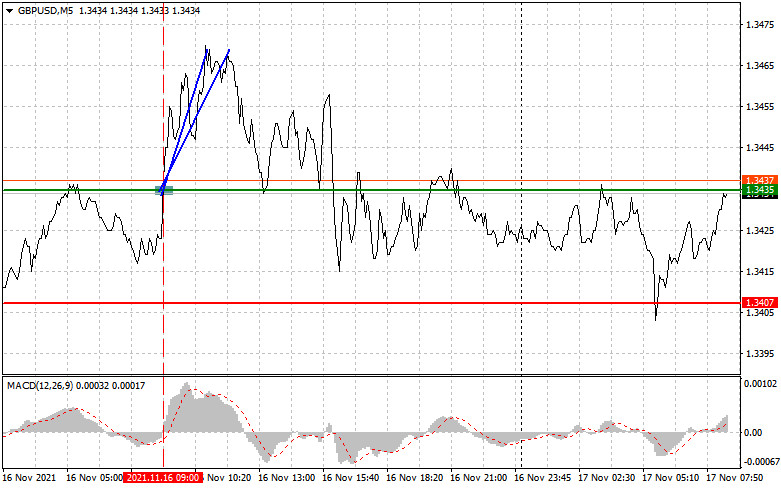
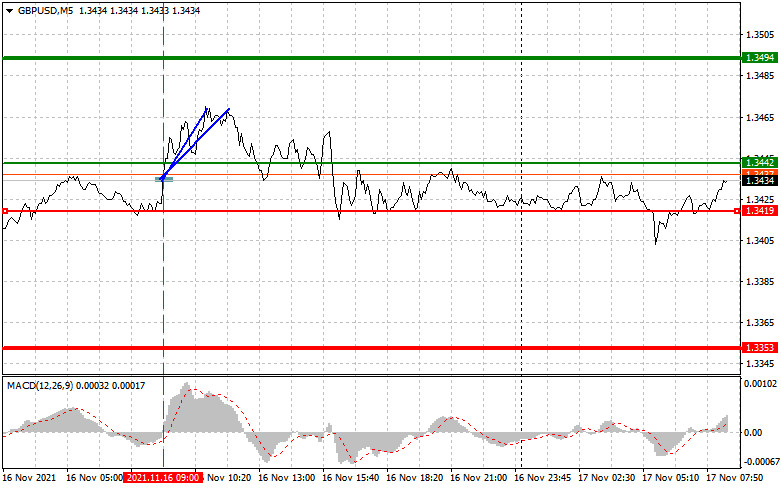
| Analysis and trading tips for GBP/USD on November 17 Posted: 17 Nov 2021 12:49 AM PST Analysis of transactions in the GBP / USD pair GBP / USD rose by 40 pips on Wednesday, thanks to the buy signal that coincided with the MACD line moving above zero. The scenario allowed bullish traders to take long positions, which provoked the upward momentum in the market. No other signal appeared for the rest of the day.
Pound rallied yesterday morning because of the strong UK employment reports. However, the increase did not last long as data on US industrial output brought demand back to dollar. Today it is necessary to pay attention to the data on UK inflation because it will affect the policy decisions of the Bank of England. Another important event is the speeches of Fed representatives, which, if hints at an increase in interest rates, will strengthen dollar even more and lead to a further drop in GBP / USD. Strong data on the volume of issued building permits in the United States will also push USD up. For long positions: Open a long position when pound reaches 1.3442 (green line on the chart) and take profit at 1.3494 (thicker green line on the chart). Growth will be observed if the UK releases a strong CPI report. Before buying, make sure that the MACD line is above zero, or is starting to rise from it. It is also possible to buy at 1.3419, but the MACD line should be in the oversold area, as only by that will the market reverse to 1.3442 and 1.3494. For short positions: Sell pound when the quote reaches 1.3419 (red line on the chart) and take profit at the price of 1.3353. The decline will continue if the UK reports bad data on inflation and if the Fed says hawkish statements on US monetary policy. Before selling, make sure that the MACD line is below zero, or is starting to move down from it. Pound can also be sold at 1.3442, but the MACD line should be in the overbought area, as only by that will the market reverse to 1.3419 and 1.3353.
What's on the chart: The thin green line is the key level at which you can place long positions in the GBP/USD pair. The thick green line is the target price, since the quote is unlikely to move above this level. The thin red line is the level at which you can place short positions in the GBP/USD pair. The thick red line is the target price, since the quote is unlikely to move below this level. MACD line - when entering the market, it is important to be guided by the overbought and oversold zones. Important: Novice traders need to be very careful when making decisions about entering the market. Before the release of important reports, it is best to stay out of the market to avoid being caught in sharp fluctuations in the rate. If you decide to trade during the release of news, then always place stop orders to minimize losses. Without placing stop orders, you can very quickly lose your entire deposit, especially if you do not use money management and trade large volumes. And remember that for successful trading, you need to have a clear trading plan. Spontaneous trading decisions based on the current market situation is an inherently losing strategy for an intraday trader. The material has been provided by InstaForex Company - www.instaforex.com |
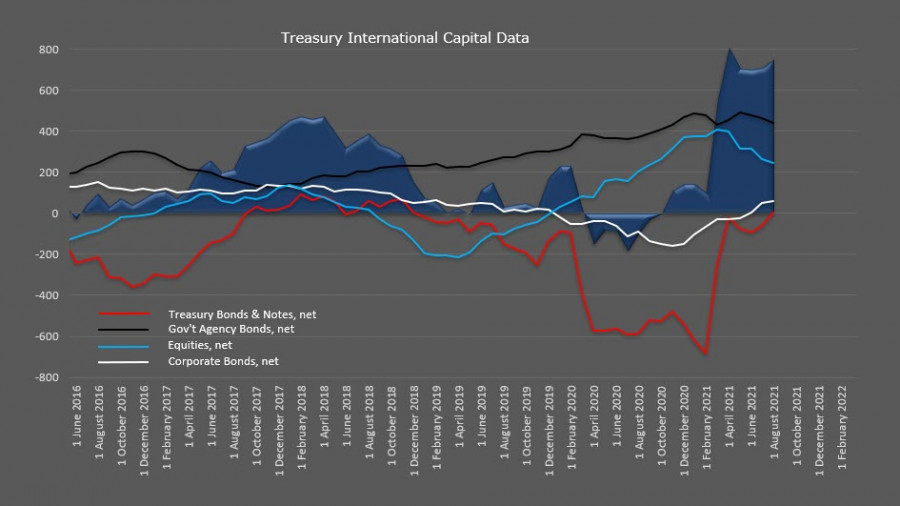
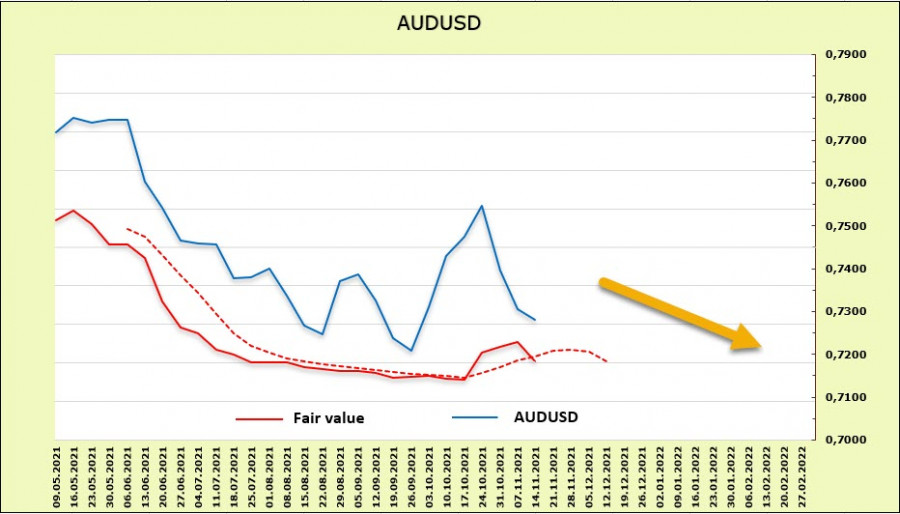
| Strong data is fueling a renewed interest in risk. Overview of USD, NZD, and AUD Posted: 17 Nov 2021 12:25 AM PST The US macroeconomic data published on Tuesday turned out to be positive in most parameters, which increased the demand for risk and contributed to the strengthening of the US dollar. In October, retail sales increased by 1.7% against the forecast of 1.4%. Industrial production also rose by 1.6%, with a forecast of 0.7%. In November, the index of housing prices increased. On another note, US President Joe Biden signed into law a $1.2 trillion infrastructure plan, which was approved by the House of Representatives after a long debate, followed by a 1.75 trillion social spending plan. The markets received the signing favorably, which was reflected in the growing interest in risk and the growth of stock indices. Biden's plan has a very clear goal – to prevent the stock market from collapsing after the start of the Fed's QE curtailment. The report on the movement of foreign capital published yesterday gives a clear assessment of what is happening. Investments of non-residents in the stock market grew in the pre-crisis era, and with the beginning of COVID-19 and QE from the Fed, there was a sharp infusion into the US debt market, primarily in US Treasury. Accordingly, the exit from QE may lead to the collapse of stock indices, since their growth is due to US residents, which is what the infrastructure support plan is intended for.
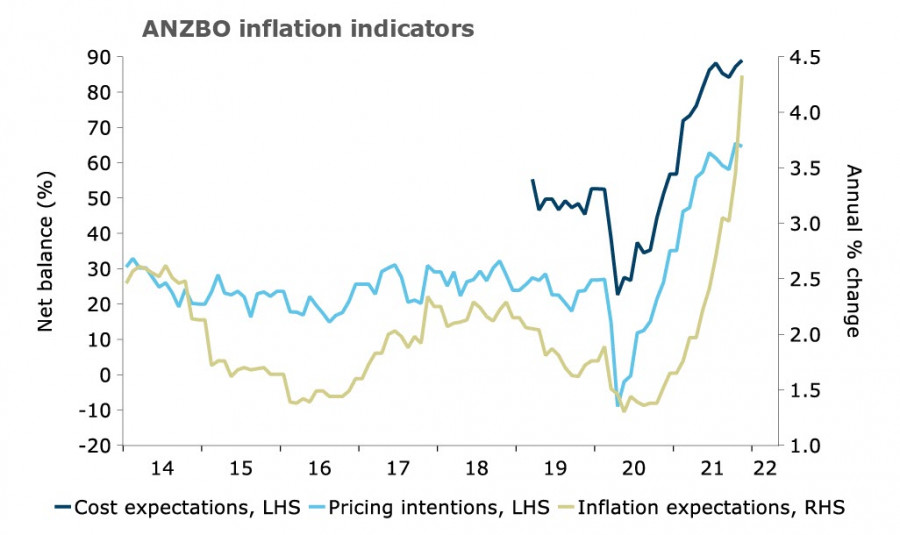
There are no reasons to expect a reversal in the US dollar yet. Everything is going to ensure that this currency will continue to grow in the medium term. NZD/USD The New Zealand dollar failed to consolidate above the level of 0.72, as too high inflation in the US increases the chances that the Fed will become more aggressive and the difference in rates between the Fed and the RBNZ will lose pace. Nevertheless, the NZD remains near recent highs and has lost much less than, for example, European currencies, since it has a good chance of resuming growth. The assessment of inflation expectations comes to the fore. Inflation in the US has reached 6.2% and is already the highest in 30 years, while in New Zealand, inflation expectations are rising just as sharply, and maybe even faster.
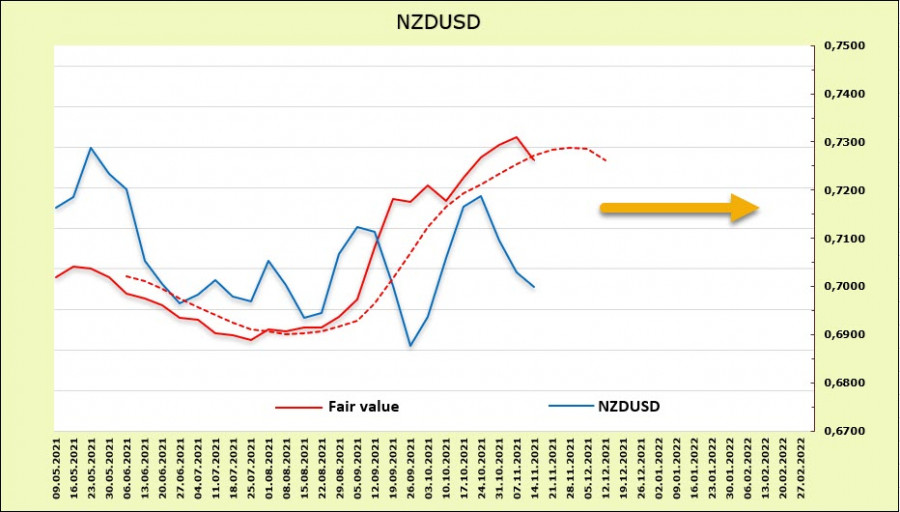
Tonight, the RBNZ will publish updated inflation expectations for the 4th quarter. There is no doubt that they will grow, which gives almost 100% confidence that the RBNZ will raise the rate by 0.25% at the next meeting on November 24. However, there is a possibility that the RBNZ will revise the forecast more aggressively after inflation of 4.9% in Q3, and this will mean that the rate on November 24 will likely be raised immediately by 0.5%. A quarter-point increase has already been taken into account by the markets and is reflected in the fact that the New Zealand dollar is held near the high. A half-point increase will allow NZD/USD to make a sharp upward leap and settle above 0.72 on the second attempt. Accordingly, a strong movement is possible tonight if the market evaluates the revised RBNZ inflation expectations as hawkish. According to the CFTC, the net long position has changed slightly (-67 million) and is 918 million. The advantage for NZD is quite significant. The settlement price turned down, which is a reaction to the growth of UST yields, but still significantly higher than the spot.
It can be assumed that the long-term base of 0.6796 has already been formed. The nearest support is 0.6900/20. There will be a decline to it if today's inflation expectations do not inspire the bulls, but the continuation of growth looks more likely. The target is 0.72 10/30, then 0.7315. AUD/USD The minutes of the RBA meeting and the speech of the RBA Governor Lowe showed that the RBA continues to assess the growth of inflation as temporary. The rate of wage growth is also considered low and will clearly lag behind the rate of rate growth from both the Fed and the RBNZ. On average, markets predict the first increase in July 2022, and NAB bank, for example, pushes this step to the summer of 2023, assuming a rate increase to 1.75-2.0% by the end of 2024. As follows from the CFTC report, the net short position decreased by 929 million, but the bearish advantage (-4.68 billion) is still significant. The estimated price is lower than the spot price and makes an attempt to turn down.
The Australian dollar fell to the lower border of the 0.7260 channel, so any attempt to further decline to the support of 0.7170 is likely. Meanwhile, an upward reversal is possible with renewed interest in risk and the absence of hawkish rhetoric from the Fed. The material has been provided by InstaForex Company - www.instaforex.com |
| Fed openly hints at a more aggressive approach on monetary policy Posted: 17 Nov 2021 12:24 AM PST Dollar continued to rally, thanks to the statements said by current and former representatives of the Federal Reserve. Everyone unanimously spoke about potential rate hikes in the US next year. Meanwhile, the released statistics for the Euro area helped euro maintain its position in the morning, but the data on US retail trade turned the situation around and brought demand back to dollar.
Former New York Fed leader William Dudley and former Richmond Fed president Jeff Lucker said yesterday that there is a high chance that the central bank will raise interest rates next June, and will do so regularly until it reaches 1.75%. But the momentary peak is expected to be around 3%-4%, which could push the economy into recession. For now though the rates range from 0%-0.25%, and during the last meeting the Federal Reserve said it will maintain this until employment completely recovers. Unfortunately, ongoing inflationary pressures cast doubt on everything, especially over when the central bank will make decisive actions. Both Dudley and Lucker have suggested that the Fed accelerate the cut in bond purchases in response to the surge in inflation. After all, earlier this month, the Federal Open Market Committee already announced its plan to taper monthly bond purchases at a pace that would allow it to complete its entire program by mid-2022. When asked about candidates for the post of Fed Chairman, former Fed members said they saw little difference between Jerome Powell and Lael Brainard. Powell's term ends in February next year, and Biden must decide whether to reappoint him for a second term or raise a new candidate. In terms of Fed stimulus, St. Louis Fed President James Bullard said the committee should hasten its tapering in order to curb the ongoing rise in US inflation. He said there is a need for more aggressive approach because only by that will the central bank properly control inflation. Bullard also noted that if necessary, the committee could raise interest rates even before the completion of the bond purchase program. These statements became a serious bullish impulse for dollar, especially after data came out that CPI rose 6.2% y/y, the highest since 1990.
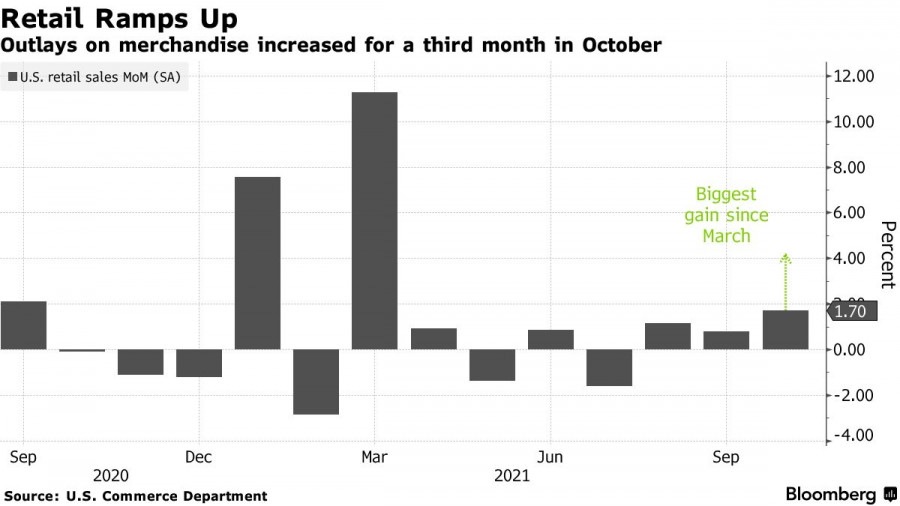
US retail sales also jumped in October, continuing the increase seen in the past three months. This shows that households continue to spend their savings even with the highest inflation in decades. According to the data, sales rose 1.7%, after increasing by 0.8% in September. Excluding gas and cars, sales rose 1.4%. But even though total retail sales are well above pre-pandemic levels, serious inflationary pressures could be substantially adjusted by the end of this year. The US Department of Commerce said prices have been rising at the fastest pace in 30 years, mainly due to increased labor costs and high manufacturing costs to customers. More significant-than-predicted gains could also be attributed to pre-holiday shopping, which is gradually gaining momentum. Many Americans fear the lack of gifts for the New Years and Christmas due to supply disruptions. The report also indicated that consumer spending grew in the fourth quarter, slightly offsetting the slowdown seen last quarter due to shortages, supply disruptions, rising prices and fears of COVID-19 outbreak. Economists expect growth to continue in the last three months of the year amid improving labor and health care markets.
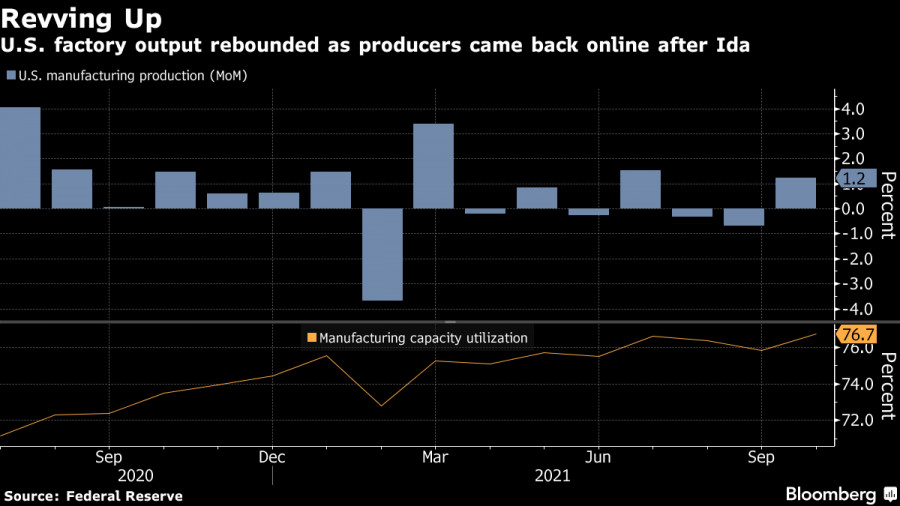
Industrial production also improved because manufacturers already coped with material shortages. The latest data indicated that leading industrial output rose 1.2% in October, after falling 0.7% in September. Total industrial production, which includes mining and utilities, also rose 1.6%. It was the new business investments and strong consumer demand that boosted orders from manufacturers. However, it also led to depletion of inventories and an increase in unfinished business. Another driver was the 11% jump in the production of cars and spare parts because excluding it, production rose by only 0.6%. Talking about EUR/USD, bears have reached 1.1280 and it seems that they intend to update the 12th figure. So far there is nothing capable of pushing the quote up, so it is likely that after the breakout of 1.1280, the pair will drop to 1.1260, 1.1220 or even 1.1190. But if the bulls manage to bring the quote to 1.1330, the pair will climb to 1.1360 and 1.1390. British pound (GBP) Pound remained in a sideways market despite good reports on the unemployment rate and jobless claims. The main reason was the failed negotiations over Brexit, which dragged all attempts of bullish traders to build an upward correction. Also, the EU's chief Brexit negotiator warned that any move by the UK to suspend the existing protocol in Northern Ireland will jeopardize the whole trade agreement between Brussels and London. Earlier, the UK repeatedly threatened to apply Article 16, which allows either party to impose safeguards in the event of "economic, social or environmental hardship." EU negotiator Maros Sefcovic said such a move will call into question the EU-UK trade and cooperation agreement, which was carefully drafted and signed on December 30, 2020. The next meeting of EU and UK is scheduled for Friday, but some EU member states are already pushing for a review of the termination of all or part of the trade agreement if the UK applies Article 16. The material has been provided by InstaForex Company - www.instaforex.com |
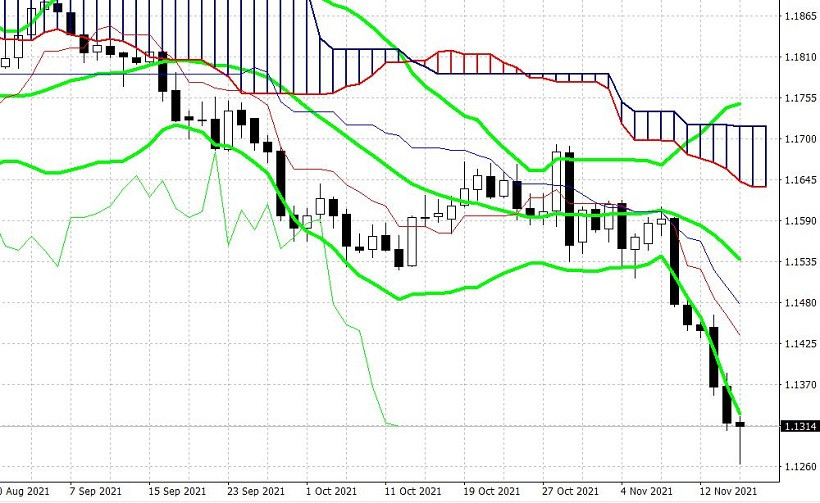
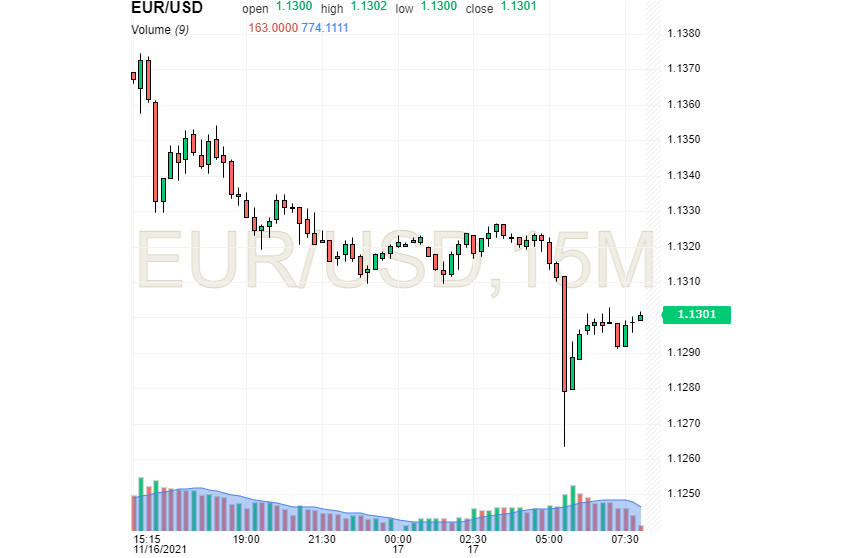
| EUR/USD. Bears have already tested the 1.12 mark Posted: 17 Nov 2021 12:15 AM PST The EUR/USD pair is updating new and new price lows. The price has been declining almost continuously for five consecutive trading days. Today is the sixth round, during which the bears of this pair have already tested the area of the 12th figure. During Wednesday's Asian session, the pair updated the annual low, falling to the level of 1.1264. The last time the price was in this price area was in early July 2020. After that, the pair was seen within the upward trend, moving away from the lows of last year. Currently, the situation is mirrored. Sellers of EUR/USD broke through all price barriers on their way, taking advantage of the general strengthening of the US dollar and the characterlessness of the euro. A month ago, the global support level of 1.1000 seemed an unattainable value, but today, it is reachable. We only have less than three hundred points. This is despite the fact that the pair has fallen by the same 300 points literally in the last five trading days. The downward trend is in full swing. This fact suggests that traders will not stop there – it will only be a matter of time before the 1.12 mark is broken. And judging by the strength of the downward movement, the bears will need a little time to consolidate in this price area.
It is worth noting that the EUR/USD pair impulsively broke through the lower line of the Bollinger Bands indicator on almost all the higher timeframes (H4, D1, W1), ending up under this line. From a technical point of view, the key support level is the 1.1020 mark – this is the lower line of the Bollinger Bands already on the monthly chart. However, there are many intermediate price barriers on the way to this target, which can slow down the downward wave. But in general, this support level is the main target of EUR/USD bears in the long term. It should be noted here that the currency strategists from the Finnish Nordea Bank said at the beginning of autumn that the pair could end the current year in the area of the 10th mark, and then in the area of the 7-8th mark next year. It looked very unusual at the time of publication of this forecast since the pair had been hanging out in the range of 1.1600-1.1900 for several months, not daring to leave the occupied level. But now, the above assumptions look quite realistic. In general, the market is already ready for the next year, assessing the chances of a Fed interest rate hike. The current events resemble the events of 7 years ago. We can consider here the monthly chart of 2014, when the pair fell almost continuously for almost all 12 months. Traders were waiting for the Fed's tightening of monetary policy amid the ECB's soft monetary policy. Naturally, the downward dynamics of the price was due not only to this, but these factors played a key role. Now, let's go back to the beginning of this year. The soft rhetoric of the ECB representatives was to some extent offset by the "dovish" rhetoric of the Fed representatives. As a result, traders maintained the balance of power, keeping the pair within the above-mentioned price range. But then US inflation came into play, which significantly strengthened the position of dollar bulls. As already known, the October consumer price index has updated a 30-year record, significantly exceeding the forecast values. The core ICE index, which is the Fed's "favorite" inflation indicator, is also at a high level, spurring hawkish expectations. In general, the divergence of the Fed and ECB rates is the main driver of the EUR/USD pair's decline. However, it is necessary to make a reservation that we are talking about the alleged divergence. But there are many more "hawks" among the members of the Federal Reserve, compared to the Board of Governors of the European Central Bank. Representatives of the hawkish wing of the Fed are publicly calling on their colleagues to take action next year. Suffice it to recall James Bullard, who said on Monday that the regulator needs to accelerate the curtailment of QE to 30 billion per month, raising the interest rate at the end of the first quarter of next year. Meanwhile, there are no such "daredevils" among the ECB members – in the vast majority of cases they voice rather mild comments on the prospects of monetary policy. Christine Lagarde solidifies the ECB's position, refuting talk that the European regulator may decide on any early action. The market is living with hawkish expectations, provoked by comments from some Fed representatives and macroeconomic reports. US inflation, Nonfarm, retail sales data, industrial production – all these indicators were released in the "green zone", reflecting the recovery of the US economy. The risk of stagflation, which was talked about so much at the beginning of autumn, has decreased, while the widespread rise in prices is already negatively affecting the daily lives of Americans. This is proven by recent opinion polls. Here, the phrase Jerome Powell said in Congress in September can be recalled. He said the US regulator "should consider raising the rate if it sees evidence that rising prices are forcing households and companies to wait for higher prices to take root, creating more sustained inflation." It is likely that this phrase will become the theme of the Fed's December meeting. Therefore, we believe that the downward trend of EUR/USD is not yet over. Both the technique and the foundation suggest that the bears of the pair will attempt to consolidate within the level of 1.12 again, despite the current corrective pullback. The first downward is the level of 1.1264, which is the updated price low for the year. The material has been provided by InstaForex Company - www.instaforex.com |
| Indicator analysis of GBP/USD for November 17, 2021 Posted: 16 Nov 2021 11:53 PM PST Trend analysis (Fig. 1). On Wednesday, the price is expected to extend its upward movement from the closing level of the previous daily candlestick (1.3425) to the 23.6% retracement level of 1.3466 (yellow dotted line). The upward trend is likely to continue in case the pair tests this mark. If so, the target is seen at the 38.2% retracement level of 1.3537 (yellow dotted line).
Fig. 1 (daily chart). Comprehensive analysis: - indicator analysis - uptrend - Fibonacci analysis - uptrend - volume analysis - uptrend - candlestick analysis - uptrend - trend analysis - uptrend - weekly analysis - uptrend - Bollinger bands analysis - uptrend Conclusion: Today, the price is expected to extend its upward movement from the closing level of the previous daily candlestick (1.3425) to the 23.6% retracement level of 1.3466 (yellow dotted line). The upward trend is likely to continue in case the pair tests this mark. If so, the target is seen at the 38.2% retracement level of 1.3537 (yellow dotted line). Alternatively, the price may go up to the 23.6% retracement level of 1.3466 (yellow dotted line) from the closing level of the previous daily candlestick (1.3425). After a test of the retracement level, the quote may go down to the lower fractal (1.3402) (yellow dotted line). If so, the uptrend will continue. The material has been provided by InstaForex Company - www.instaforex.com |
| Daily Video Analysis: AUDCHF, H4 Reversal Opportunity Posted: 16 Nov 2021 11:42 PM PST Today we take a look at AUDCHF. Combining advanced technical analysis methods such as Fibonacci confluence, correlation, market structure, oscillators and demand/supply zones, we identify high probability trading setups. The material has been provided by InstaForex Company - www.instaforex.com |
| Gold may gain 7% by beginning of 2022, Goldman Sachs forecasts Posted: 16 Nov 2021 11:32 PM PST
Gold prices went down for the second straight trading session. The asset still has upside potential and could rise to $2,000, according to the outlook by Goldman Sachs. Following a 0.1% downtick on Monday, gold touched the June high of $1,879.50 on Tuesday, but fell by 0.7% or $12.50 and closed at $1,854.10.
The precious metal failed to consolidate at a 5-month high. Gold was pushed down by the rising dollar and the latest US economic data. USDX gained 0.4%, reaching the 16-month high. US industrial production data increased by 1.6% in October, surpassing the projected 0.8% gain. Retail sales also beat expectations, growing by 1.7%. Economists forecasted a 1.5% rise. The report shows consumption can handle high prices and remains quite strong, which is positive for risk appetite but creates an obstacle for gold, OANDA analyst Edward Moya said. Moya noted gold could rise further towards the key target of $1,900, but the stronger dollar would put pressure on the asset. Gold price dynamics will depend on the sentiment of short-term investors and buyers from Asia, which are currently following a wait-and-see tactic, Chintan Karnani, director of research at Insignia Consultants said. "Short-term gold investors and physical gold buyers (in Asia) will buy only if they are convinced that gold price has the juice to float over $1,900", he said. Otherwise, the asset could test the $1,825.30 and $1,793.30 levels. Despite the current slump, gold still has upside potential stemming from continuing inflation concerns. "The notion that U.S. inflation has yet to peak should keep bullion well bid, as long as the Fed doesn't veer from its patient approach to any rates lift off," said Han Tan, chief market analyst at Exinity. Outlook by Goldman SachsHigh inflation would be the main catalyst for gold prices, said Damien Courvalin, head of energy research at Goldman Sachs. Demand for gold as a safe-haven asset has fallen over the past 6 months, as investors considered growing inflation to be transitory. However, inflationary pressure is now more likely to persist longer than previously anticipated, which may boost demand for the asset, he noted. The investment company projects that gold would rise by 7% and reach $2,000 per ounce by the beginning of 2022. Growing inflationary risks could accelerate the price further, Courvalin commented. Rising demand for cryptocurrencies may be detrimental for the asset, alongside other risks such as inflationary pressure and rate hikes by the Fed, the analyst said. Crypto could be more desirable for investors as a safe-haven asset as it can be used as currency, among other factors. The material has been provided by InstaForex Company - www.instaforex.com |
| EUR/USD: US dollar is rising, but the euro is not Posted: 16 Nov 2021 11:15 PM PST
It is increasingly difficult for the Euro currency to keep its position, pretending that its decline is an annoying misunderstanding. In the EUR/USD pair, the euro has to act at the limit of its capabilities in order not to collapse. Analysts believe that the catalyst for the euro's collapse was the "dovish" statements of ECB President Christine Lagarde. Representatives of the European regulator still consider it inappropriate to raise the rate and tighten the monetary policy. At the same time, the ECB, along with the Fed, significantly reduced the volume of the asset repurchase program. However, the similarity with the strategies of the leading central banks ended there. With regard to the rate hike, the European regulator disagrees with the Fed, the Bank of England, and the Bank of Canada. The ECB hed is confident that the tightening of the monetary policy will harm the European economy. The response to Lagarde's stubbornness was a sharp plunge of the euro, which has lost its position, trying to consolidate at current levels. Meanwhile, the US currency continues to test the highs. According to experts, the US dollar received a new impetus after another statement by C. Lagarde regarding the "temporary" nature of inflation. The ECB believes that it will return to the target 2% in the near future. It is possible that the European regulator repeats the mistake of the American one. Earlier, the Fed claimed that high inflation in the US is a temporary phenomenon, and now the ECB is "persuading" itself and the markets in a similar way. Experts consider this a dangerous misconception, for which they will have to pay with holes in the economy. Inflation is considered the main way to normalize the MP, and statements by central banks about its temporary nature increase price pressure. In view of the euro's weakening, the US dollar felt a surge of strength and became the leader once again. The US currency was helped by inspiring data on US retail sales. According to reports, this indicator increased in October much faster than experts expected. In the medium term, this will force the Fed to accelerate the reduction of the asset purchase program due to persistently high inflation. Analysts are concerned about the long-term downward trend of the EUR/USD pair, recorded since the summer of 2021. Currently, the pair has broken through the 200-week moving average and is headed lower. This is extremely negative for the European currency, which is now more vulnerable to inflation than the American one. On Wednesday morning, the EUR/USD pair was trading near the level of 1.1301, hoping to win back a series of falls, but without much success.
Experts consider geopolitics to be another reason for the weakness of the euro, in particular the problems of the UK related to Brexit and Northern Ireland. Moreover, the expectation of the final estimate of annual inflation in the eurozone also exerts additional pressure on the euro. According to preliminary forecasts, consumer price growth increased to 4.1% in October. This is the maximum price turn in the last 13 years. Analysts believe that the euro has currently no growth impulse. If the ECB does not change the current monetary strategy, the indicated currency will remain in the outsiders and test the bottom. At the same time, inflation fears contribute to the growth of the yield of treasuries, providing significant support for the US currency. In such a situation, the euro has a very low chance of recovery. However, possible changes in the ECB's policy will give a head start to the EUR. If the regulator considers the possibility of raising rates in 2022, the situation will change in favor of the euro. The material has been provided by InstaForex Company - www.instaforex.com |
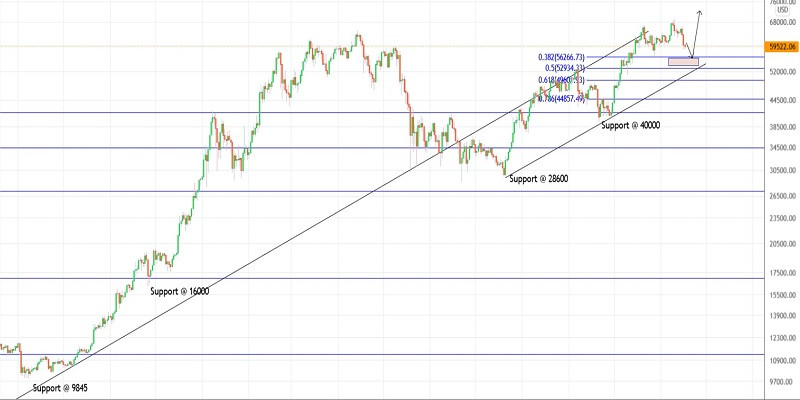
| Trading plan for Bitcoin for November 17, 2021 Posted: 16 Nov 2021 11:02 PM PST
Technical outlook:Bitcoin has dropped through $58,500-59,000 zone as discussed and in-line with expectations. The crypto is seen to be trading around $59,000-400 at this point in time and might prepare to rise higher again. Traders might be advised to book profits on short positions initiated earlier from $65,000 mark and prepare to turn long. Potential remains for a rally towards $75,000 going forward. On the flip side, Bitcoin can drop further to $56,000 mark, which is fibonacci 0.382 retracement of the rally between $40,000 and $69,000 respectively. A drop below $56,000 will open the door to test $50,000 potential support before resuming its rally towards $75,000 mark. Immediate price support on the daily chart is at $40,000, while resistance is around $69,000 respectively. Bitcoin wave structure continues to remain bullish until prices stay above $40,000 mark. A break below $40,000 will test further lower towards $29,600 mark. At this point in time, focus shifts tor a rally above $75,000 mark with risk below $56,000 respectively. Bulls seem to be poised to dominate the market soon. Trading plan:Potential rally towards $75,000 against $55,000 Good luck! The material has been provided by InstaForex Company - www.instaforex.com |
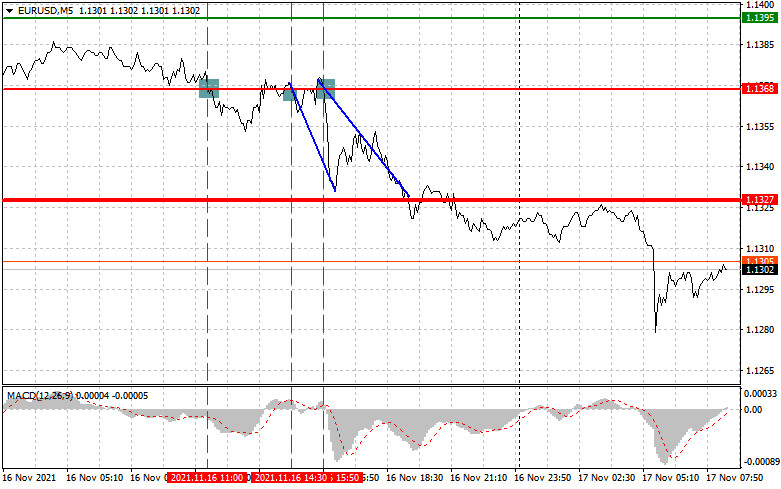
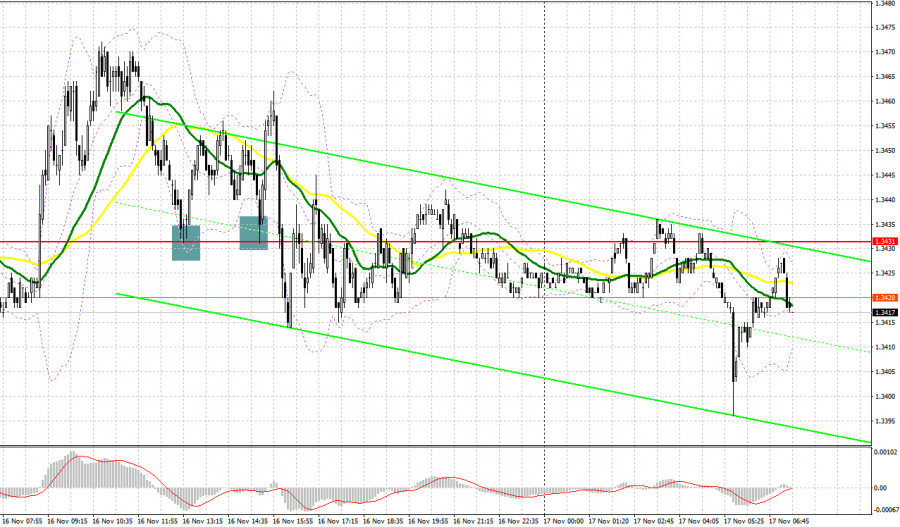
| Trading tips for novice investors (analysis of yesterday's transactions) EUR/USD, November 17 Posted: 16 Nov 2021 10:55 PM PST Analysis of trades and tips on trading the euro Yesterday, there were several entry points. Trading was unfolding around the 1.1386 level as the pair remained flat before the start of the New York session. It tried to test 1.1368 at 11.00 when the MACD indicator was in the oversold area. The indicated level was not the daily high, so it was risky to open long positions. In the afternoon, the pair tested 1.1368 at 14.30 when the MACD indicator moved from top to bottom to zero, which was the first signal to sell the euro. Besides, the pair attempted to break through this level at 15.50. The MACD indicator was still just starting to move down from zero. As a result, the euro fell by about 40 pips. No other entry points were formed.
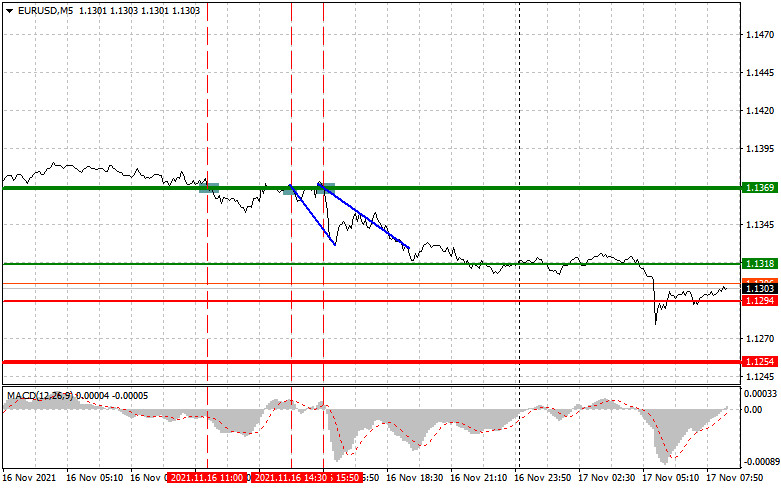
The euro advanced yesterday amid a batch of fundamental statistics in the first half of the day. Yet, the euro failed to sustain bullish momentum. The data on the consumer price index of Italy and France turned out to be positive. The Gross Domestic Product (GDP) in European Union was in line with economists' forecasts. The US dollar also rose in the afternoon following the retail trade report. The figure beat economists' forecasts. The speeches of FOMC members Rafael Bostic and Mary Daly only increased demand for the US dollar. They hinted at a rise in the interest rate. Today, the economic calendar contains crucial economic reports as well. In the first half of the day, investors will be anticipating data on the EU consumer price index and the financial stability report. If inflation soars in October in the eurozone, then the euro is likely to assert strength against the US dollar within a day. In the second half of the day, several FOMC members will make a speech, namely John Williams and Christopher Waller as well as Mary Daly and Michelle Bowman. If they continue to hint at an increase in the interest rate, the US dollar will rise versus the euro. Apart from that, the US is going to unveil building permits data. If the reading is positive, the US currency is sure to climb. Entry points to open long positions Today, it is recommended to open long positions on the euro when the price reaches 1.1318 (the green line on the chart) with the target level of 1.1369. After the price approaches 1.1369, it is favorable to lock in profits, selling the euro and counting on a rebound of 10-15 pips. The euro may rise only in the case of very strong inflation data in the eurozone and the hawkish statements of ECB President, Christine Lagarde, on monetary policy. Important! Before opening long positions, make sure that the MACD indicator is above the zero level and is just beginning to climb from this level. It is also possible to buy the euro today if the price reaches 1.1294. The MACD indicator should be in the oversold area, which will limit the downward movement and lead to an upward reversal. So, the pair may rise to the opposite levels of 1.1318 and 1.1369. Entry points to open short positions It is recommended to open short positions on the euro after it approaches the level of 1.1294 (the red line on the chart). The target level will be 1.1254. After the price reaches this level, it is better to close short positions and buy the euro immediately counting on a movement of 10-15 pips in the opposite direction from the level. The euro may face pressure amid soft rhetoric from the ECB president and poor inflation data in the eurozone. The speeches of FOMC members may also give a boost to the US dollar. Important! Before opening short positions, make sure that the MACD indicator is below the zero level and is just beginning its decline from it. It is better to sell the euro today if the price reaches 1.1395. The MACD indicator should be in the overbought area, which will limit the upward movement and lead to a downward reversal. The euro may edge lower to 1.1368 and 1.1327.
Description of the chart: The thin green line is the entry point to open log positions. The thick green line is the estimated price where you can place the Take Profit order or lock in profits by yourself as the price is unlikely to climb above this level. The thin red line is the entry point to open short positions. The thick red line is the estimated price where you can place the Take profit order or lock in profits by yourself as the price is unlikely to decline below this level. The MACD indicator. When entering the market, it is important to study overbought and oversold zones. Important. Novice traders need to make very careful decisions when entering the market. Before the release of important fundamental reports, it is best to stay out of the market to avoid losses because of sharp fluctuations in the exchange rate. If you decide to trade during the news release, then always place Stop Orders to minimize losses. Without placing Stop Orders, you may lose the entire deposit very quickly, especially if you do not use money management, but trade in large volumes. Remember that for successful trading it is necessary to have a clear trading plan, following the example of the one presented above. Intraday traders are likely to incur losses by making spontaneous trading decisions based on the current market situation. The material has been provided by InstaForex Company - www.instaforex.com |
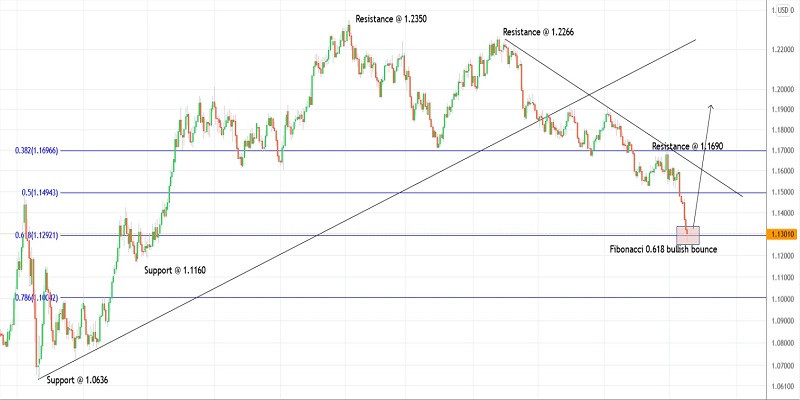
| Trading plan for EUR/USD on November 17, 2021 Posted: 16 Nov 2021 10:46 PM PST
Technical outlook:EUR/USD finally dropped to 1.1260 in the early hours of the trade today, before pulling back. The currency pair is trading above the 1.1300 mark at this point of writing and is looking poised to resume higher from here. Immediate price resistance on the daily chart is seen towards the 1.1690 mark and bulls will be poised to break higher to confirm a reversal in trend. EUR/USD is bouncing off from the Fibonacci 0.618 retracement level after its previous rally between 1.0636 and 1.2350 respectively. If the price action produces a bullish candlestick pattern, the currency would be set to resume its rally. The corrective drop from the 1.2350 high is looking complete now as bulls remain poised to be back in control. Looking at the overall wave structure, EUR/USD remains bullish against the 1.0636 mark. It has carved a meaningful upswing between 1.0636 and 1.2350, which is followed by a Gartley towards 1.1260 respectively. If the structure holds well, the next rally could reach the 1.3300 mark. Only a consistent drop below 1.1200 would nullify the bullish scenario. Trading plan:Potential rally towards 1.2350 against 1.1200 Good luck! The material has been provided by InstaForex Company - www.instaforex.com |
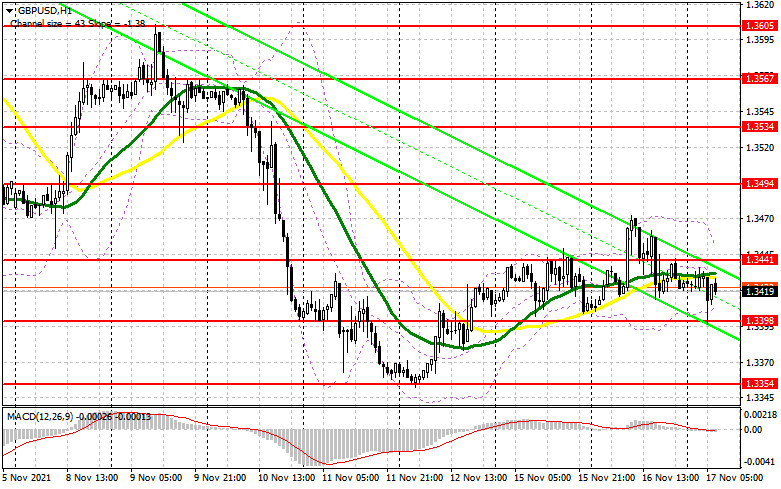
| Posted: 16 Nov 2021 10:33 PM PST To open long positions on GBP/USD, you need: Yesterday afternoon was much better than the first. Let's take a look at the 5 minute chart and see what happened. Although the first half of the day led to the formation of a number of signals to enter the market, all of them did not bring the expected profit. Investor caution following the release of UK labor market data prevented the bulls from building a larger upward correction. Immediately after the publication of the reports, the pound rose, but the bears made a false breakout at 1.3458, creating a signal to open short positions there. After some time, the bulls climbed above 1.3458 again, testing this level from top to bottom, which led to the closure of short positions and the opening of long positions, counting on the continuation of the upward trend after the good news - but here again, the pair fell below 1.3458. In the second half of the day, two signals to buy the pound from the level of 1.3431 were formed at once. Unsuccessful attempts to break below this range resulted in forming a false breakout. Both signals showed an increase of 30+ points.
Today is an important day for the GBP/USD pair, as inflation data in the UK will be released in the first half of the day. Yesterday's unemployment rate managed to please traders, which protected GBP/USD from the fate that befell the European currency. If today's inflation report in the UK shows growth above economists' forecasts, then it will be a strong bullish signal for the pound. The bulls' main task in the first half of the day is to protect the level of 1.3398. Forming a false breakout there generates a signal to buy the pound against the trend. This will return the chance for an upward correction of the pair to the 1.3441 area, where the moving averages, which play on the side of bears, pass. An equally important task is to regain control over this level. A breakthrough and reverse test from top to bottom at 1.3441 will give another buy signal, which will lead to GBP/USD moving up to the 1.3494 area with the prospect of reaching a high like 1.3534, where I recommend taking profits. In case the pair falls in the first half of the day and we receive weak data on the consumer price index, the best option for buying the pound will be a test of the next support at 1.3354. However, I advise you to open long positions there only after a false breakout. You can watch long positions of GBP/USD immediately for a rebound from a new low like 1.3308, or even lower - from support at 1.3254, counting on a correction of 25-30 points within the day. To open short positions on GBP/USD, you need: The bears are still a bit confused and are looking for any reason to sell the pound - but there is none. If inflation jumps much higher than forecasted, it will greatly hurt the bulls, as all the recent statements by Bank of England Governor Andrew Bailey will lose their meaning. To reverse the downward trend, it is necessary to protect resistance at 1.3441, where the moving averages pass. Forming a false breakout there will result in creating an entry point into short positions, followed by a decline in GBP/USD to the 1.3398 area. Breaking through this range will be equally important for the bears. The 1.3398 test from the bottom up creates another signal to open new short positions with the goal of falling to the lows: 1.3354 and 1.3308, where I recommend taking profits. In case the pair grows during the European session and there are no bears at 1.3441, it is best to postpone selling until the larger resistance at 1.3494. I advise you to open short positions immediately on a rebound from 1.3534, or even higher - from a new high in the 1.3567 area, counting on the pair's rebound down by 20-25 points within the day.
I recommend for review: The Commitment of Traders (COT) report as of November 9 logged an increase in short positions and a decrease in long ones, which led to a negative delta. Disappointing Q3 GDP results in the UK and a possible plunge in retail sales in Q4 amid a spike in inflation pushed the sterling down and exerted pressure on it. Another important factor for a bearish pound is the escalation of tension over the Northern Ireland protocol the British authorities plan to terminate in the near future. The European Union is preparing to introduce certain retaliatory measures. At the same time, inflation in the United States keeps rising, increasing the likelihood of earlier interest rate hikes, which provides support to the greenback. Nevertheless, I recommend sticking to the strategy of buying the pair after every large fall that is likely to occur amid uncertainty surrounding the central bank's monetary policy. According to the COT report, long non-commercial positions declined to 54,004 from 57,255 and short non-commercial positions increased to 66,097 from 42,208. The delta came at -12,093 versus 15,047 a week earlier. The weekly closing price dropped to 1.3563 from 1.3654 due to the Bank of England's stance on monetary policy. Indicator signals: Moving averages Trading is carried out below 30 and 50 moving averages, which preserves the bears' chance for continuing the trend. Note: The period and prices of moving averages are considered by the author on the H1 hourly chart and differs from the general definition of the classic daily moving averages on the daily D1 chart. Bollinger Bands A breakthrough of the upper border in the 1.3445 area will lead to a new wave of growth in the pound. A break of the lower border of the indicator around 1.3400 will increase the pressure on the pound. Description of indicators
|
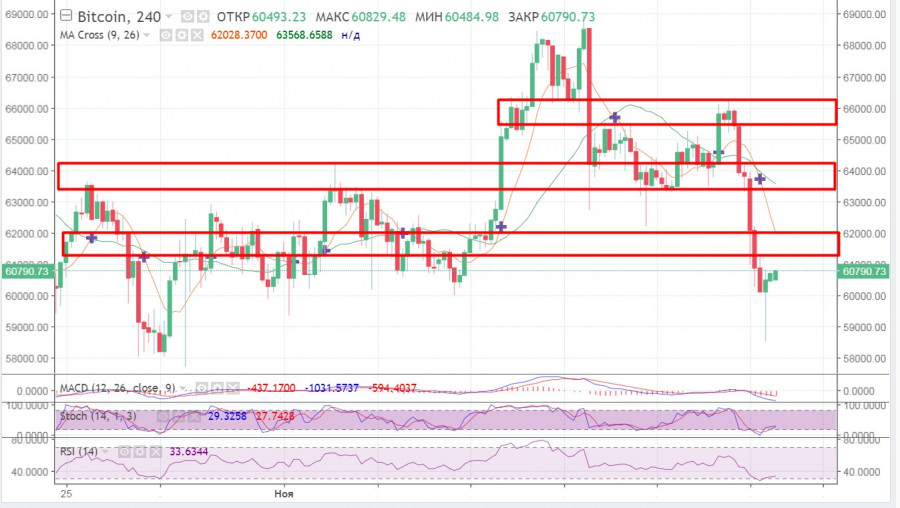
| BTC drops to $60K amid regulations tightening in US and China. When BTC to stop falling? Posted: 16 Nov 2021 10:30 PM PST An excessive confidence in a further rise in BTC and a jump in the number of speculative long positions led to a correctional movement that later affected the whole market. The number of long positions was actively growing, thus causing an unexpected decline of 9%. As a result, the asset broke the level of $60,000. The decrease took place amid a negative news flow. That is why the first cryptocurrency is likely to slide deeper. The correction influenced the whole market, while bitcoin needed a local drop after a several-day rally. The speculative activity almost reached its peak, thus pointing to the upcoming local decline. Disappointing news from both the US and China became the main reason for a drop in the crypto market. As a result, traders closed a large number of positions worth more than $610 million in one day and more than $1.5 billion in the last 7 days. Investors' behavior was seriously affected by Joe Biden's decision to significantly tighten regulations on cryptocurrency trading. The US President signed an infrastructure bill, according to which the digital coin market is subject to mandatory reporting to the Tax Service on the activities of its users. In fact, this action impacts the confidentiality of investors' transactions and tightens tax control over the activities of cryptocurrency platforms. In addition, the expected income from this type of taxes could exceed $28 billion. At the same time, China is planning to impose stricter sanctions on crypto trading. According to the new rules, mining will be prosecuted both in private enterprises and residential homes of individuals. In addition, some politicians have been dismissed and expelled from the party for supporting mining. They will receive criminal charges for mining digital coins. Due to excessive overheating of the market and negative news, the total capitalization of the cryptocurrency market collapsed by 9% to $2.8 trillion. During the last 24 hours, bitcoin lost 7.5% and dropped below $60,000. However, later, it managed to consolidate above the mentioned level. One big holder of digital coins benefited from the situation and purchased 207 BTC for an average price of $62,000. As a result, the trader entered the top-3 list of the largest cryptocurrency holders. Judging by the recent drop, BTC may show the fastest rally of the year. This is proved by investors' behavior. They are actively buying coins amid lower prices. At 4 pm, bitcoin was trading around $60.5K, trying to consolidate above the support level of $60.2K. Amid the decline, the BTC price hit the level of $58.6K and then rebounded. As a result, the price closed above the open reading. Now, the coin is approaching the first resistance level near $62.1K. Thus, the price may enter its consolidation range. Moving higher, the price may face resistance at the level of $64.4K. An upward breakout of the level will point to the end of the consolidation phase, as the price is likely to go on climbing. Technical indicators are also gradually recovering. Stochastic and the relative strength index (RSI) are rising to the bullish zone that is above 40. However, MACD continues sliding below zero, thus providing a bearish signal.
It is quite possible that BTC will continue its correctional movement. The key support level is located at $58.6K. It is a reverse point after a drop. A big number of long positions and a strong support level proves this. Notably, the price has tried to downwardly break the mentioned support level several times already. At the same time, the level of $53.6K is a perfect price to buy the asset. BTC is only getting ready for the main bullish rally. Against this background, market participants may push the price even lower to make investments that will bring more profit. The material has been provided by InstaForex Company - www.instaforex.com |


| You are subscribed to email updates from Forex analysis review. To stop receiving these emails, you may unsubscribe now. | Email delivery powered by Google |
| Google, 1600 Amphitheatre Parkway, Mountain View, CA 94043, United States | |


Comments