Forex analysis review
Forex analysis review |
- Overview of the EUR/USD pair on November 5, 2021
- How to trade GBP/USD on November 5? Simple tips for beginners. The pound collapsed, but made it possible to earn
- How to trade EUR/USD on November 5? Simple tips for beginners. American aftertaste of the Fed meeting
- GBP/USD. "Black Thursday" for the British currency: the pound swoops down throughout the market
- Cost of food commodities rises again, holding new records
- Bitcoin can overcome its all-time highs again and grow more than 7 times, as in the last halving
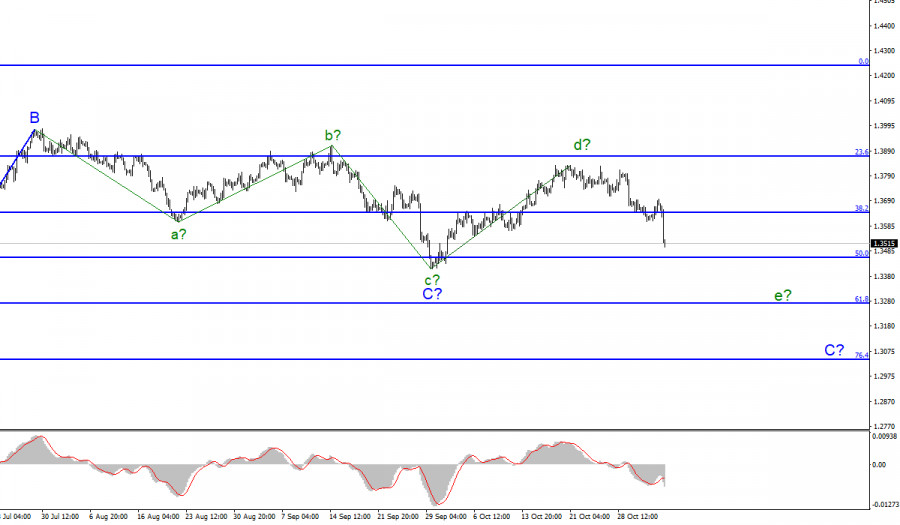
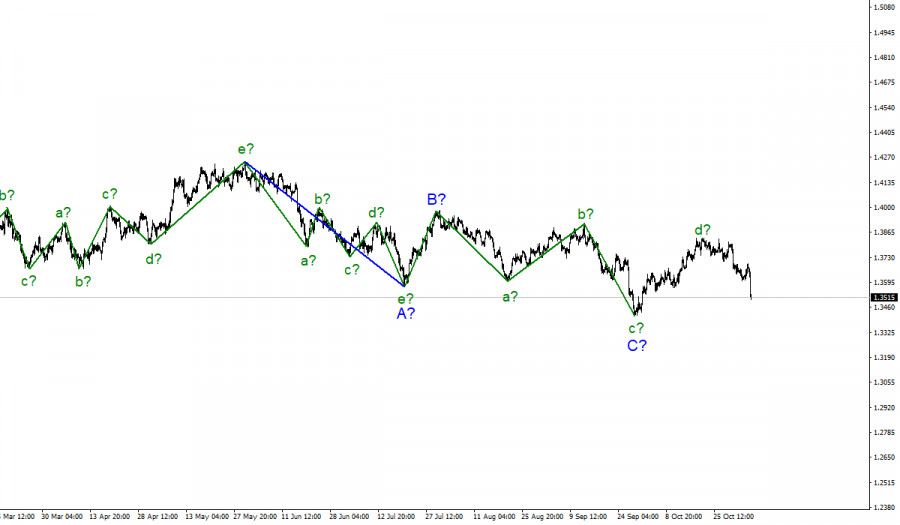
- Wave analysis of GBP/USD for November 4; British pound strengthens downside outlook amid BoE's decision
- Wave analysis of EUR/USD for November 4; The Fed has announced to taper QE
- Learn and analyze: why Bitcoin fell to $60k and what do technical indicators say about the further price movement?
- November 4, 2021 : EUR/USD daily technical review and trading opportunities.
- November 4, 2021 : EUR/USD Intraday technical analysis and trading plan.
- November 4, 2021 : GBP/USD Intraday technical analysis and significant key-levels.
- Trading signal for BITCOIN (BTC) on November 04-05, 2021: sell below $62,500 (2/8)
- The Fed is going to wind down the emergency stimulus program
- XRP will "rebrand" and gain access to the Ethereum ecosystem: what does this mean for altcoin and how is the SEC involved
- No one promised anything: Bailey jumped, the pound collapsed
- Trading signal for Nasdaq 100 (#NDX) on November 04-05, 2021: sell in case of pullback to 16,300 (strong support)
- Bitcoin: What do record activity and hints of spot ETFs mean?
- Trading signal for GBP/USD on November 04-05, 2021: buy in case of bounce at 1.3530 (strong support)
- Pfizer's latest phase of vaccine trials falsified
- EURUSD could provide a new sell signal if price breaks 1.1538.
- USDCHF remains inside bearish channel
- Gold challenges major resistance trend line once again.
- Video market update for November 04,2021
- AUD/USD - Strong downside pressure and potential for bigger drop
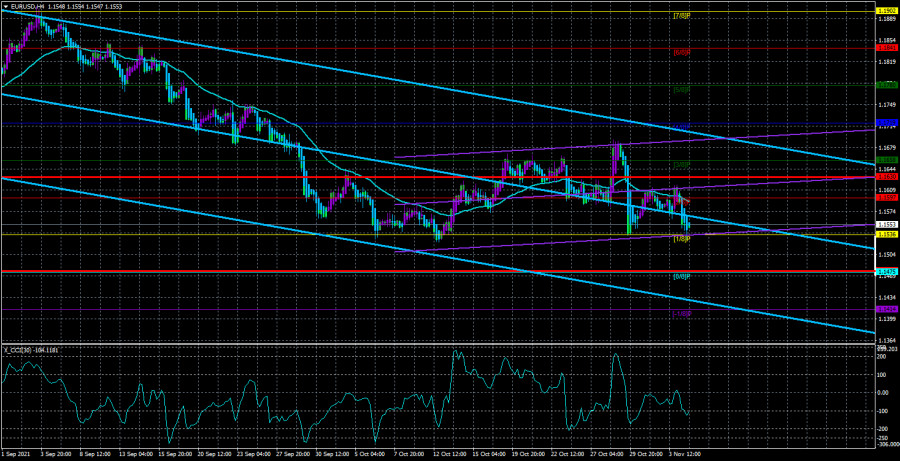
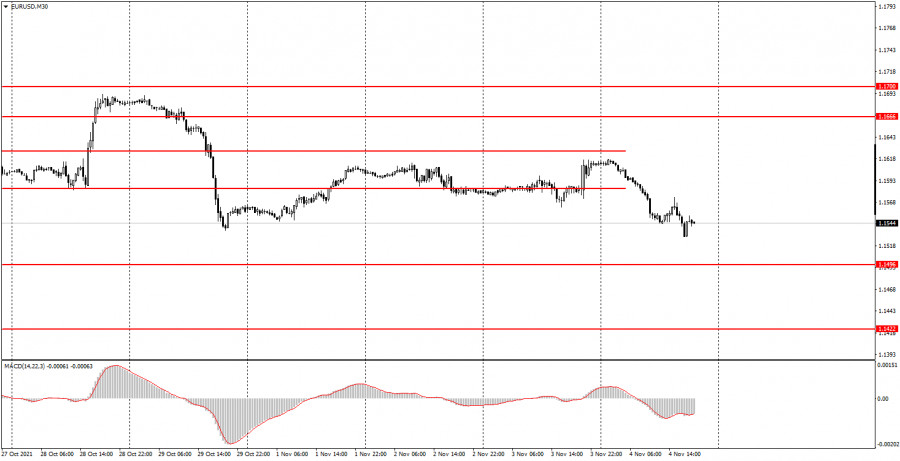
| Overview of the EUR/USD pair on November 5, 2021 Posted: 04 Nov 2021 07:45 PM PDT 4-hour timeframe
Technical details: Higher linear regression channel: direction - downward. Lower linear regression channel: direction - upward. Moving average (20; smoothed) - sideways. The EUR/USD currency pair fell by 70 points on Thursday. Then a recovery followed. However, the pair continued to work out the results of the Fed meeting over the next day. This is exactly what we talked about in yesterday's review. After such an important event as the Fed meeting, the market needs to be given at least a day to fully work out its results. We said that the Europeans and the British, for example, did not have the opportunity to work out the results of the FOMC, since the European trading session was already closed by that time. The same goes for Asians. Their trading session opened only at night. And since everyone looks at the Fed and its monetary policy one way or another, it was quite predictable that strong movements would continue a few hours after the results of the monetary committee meeting became known. However, it is still impossible to call today's movement "strong". Rather, it was of moderate strength. Recall that in recent months, the euro/ dollar pair usually passes 40-50 points per day. Therefore, 70 or more points already look like a strong movement. However, by and large, nothing extraordinary happened, and the euro/dollar pair remained within the same side-channel that it was in earlier. On the 4-hour TF, it is clear that even if the channel is not pronounced, nevertheless, the current movement cannot also be called "trending". All movements of the pair, starting from October 1, take place between the Murray levels "1/8" - 1.1536 and "3/8" - 1.1658. The pair has been in this range for more than a month. Thus, the current movement is still more suitable for the concept of "flat". Although the price continues to be located below the moving average line, the downward trend formally persists. Jerome Powell has finally announced the curtailment of the QE program. However, this does not change anything for the markets and the euro/dollar pair. Recall that the markets were waiting for this statement from the Fed back in September and were ready for the fact that they would have to wait for December to hear it. However, the Fed did not delay this time and announced that every month the economic stimulus program will decrease by $ 15 billion. However, Jerome Powell also stated that the pace of curtailment may accelerate, and may slow down. In other words, the Fed has again left itself a path of retreat, as it is not at all sure that the economy and the labor market will continue to recover at a good pace. To be more precise, the latest reports on GDP and NonFarm Payrolls say just the opposite. Therefore, if their growth rates continue to decline, the Fed may suspend the curtailment of QE. And this doubt from the US central bank probably prevented the dollar from showing more powerful growth. The Fed also lowered its forecast for economic growth for 2021, increased unemployment, and inflation. The Fed expects the situation to worsen and against this background, it still began to curtail QE. And the markets that have already taken into account the curtailment of QE a long time ago, it turns out, started doing it too early. Roughly speaking, after the FOMC meeting, it is impossible to draw an unambiguous conclusion that the course has now been taken to tighten monetary policy. Rather, it's like this: the course for tightening has been taken, but at any moment, it can be turned in the opposite direction. All the more interesting, because this Friday the next report on Nonfarm will be published in the States. If the value of this indicator is below forecasts for the third month in a row, this may be regarded by the markets as a signal of a possible suspension of QE curtailment in January or February. Moreover, Jerome Powell may resign in February, and it is unknown what course the new head of the Fed will take. The ADP report, which has already been released this week, showed a good value, but recall that ADP and NonFarm rarely coincide in their dynamics. The fact that the number of employees in the private sector has increased by 571 thousand does not mean that Nonfarm will grow by 500 thousand or more. Moreover, October was not the most successful month for the American economy.
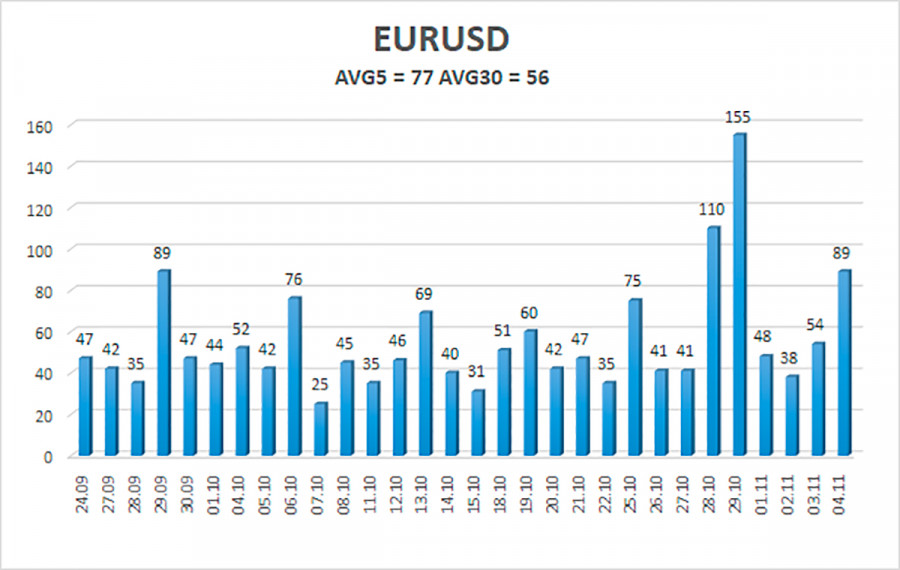
The volatility of the euro/dollar currency pair as of November 5 is 77 points and is characterized as "average". Thus, we expect the pair to move today between the levels of 1.1476 and 1.1630. A reversal of the Heiken Ashi indicator upwards will signal a round of corrective movement. Nearest support levels: S1 – 1.1536 S2 – 1.1475 S3 – 1.1414 Nearest resistance levels: R1 – 1.1597 R2 – 1.1658 R3 – 1.1719 Trading recommendations: The EUR/USD pair continues to be below the moving average line. Thus, today it is necessary to stay in short positions with targets of 1.1536 and 1.1475 until the Heiken Ashi indicator turns upwards. Purchases of the pair should be considered if the price is fixed above the moving average, with targets of 1.1630 and 1.1658. Explanations to the illustrations: Linear regression channels - help determine the current trend. If both are directed in the same direction, then the trend is strong now. Moving average line (settings 20.0, smoothed) - determines the short-term trend and the direction in which trading should be conducted now. Murray levels - target levels for movements and corrections. Volatility levels (red lines) - the likely price channel in which the pair will spend the next day, based on current volatility indicators. CCI indicator - its entry into the oversold area (below -250) or into the overbought area (above +250) means that a trend reversal in the opposite direction is approaching. The material has been provided by InstaForex Company - www.instaforex.com |
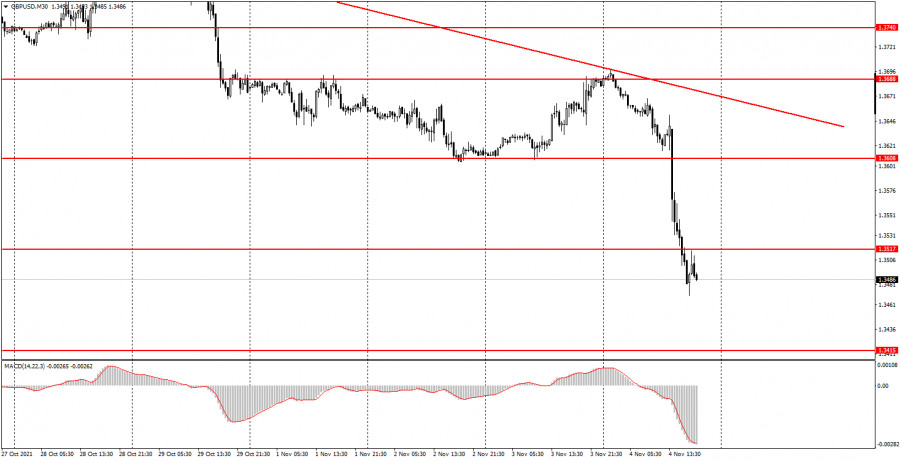
| Posted: 04 Nov 2021 02:16 PM PDT Analysis of previous deals:30M chart of the GBP/USD pair
The GBP/USD pair collapsed on the 30-minute timeframe on Thursday, passing about 230 points in a day. It's even hard to remember when the last time a pair passed so much! However, today the Bank of England summed up the results of its meeting in Great Britain, and the meetings of the central banks are the most important event in the foreign exchange market. And most importantly, it is almost always unpredictable. "Unpredictable" not even in terms of decisions made by this or that central bank, but in terms of the market's reaction to this event. For example, today, the decisions made by the BoE did not contribute to the fall of the pound at all. Three instead of two earlier members of the monetary committee voted to cut the stimulus program, and two voted to raise the rate. And this despite the fact that a week ago there was no talk of raising the rate at all! However, the market interpreted these hawkish messages in its own way. He expected that the rate would be raised today, with the help of many well-known banks and experts, but these expectations did not come true. And it turns out that the pound fell down simply because expectations were not met. Although where did these expectations come from? On what basis? Thus, there is a downward trend at this time on the 30-minute timeframe. 5M chart of the GBP/USD pair
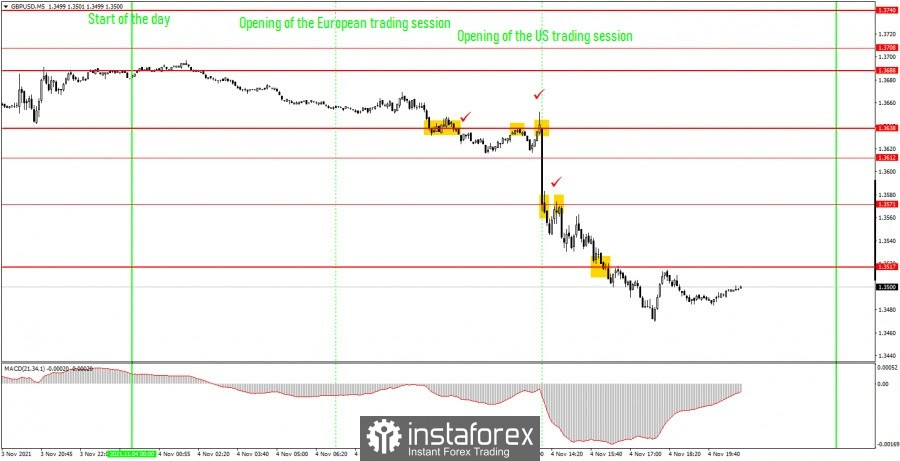
The technical picture on the 5-minute timeframe was very attractive today. Still, the pair passed 230 points in a day. However, at the same time, it was quite complicated, and there were a lot of trading signals. Let's figure out which trades should have been opened. The first sell signal should have been worked out when the price crossed the 1.3638 level. It turned out to be quite risky, but at the same time profitable. Although not everything is so simple. Stop Loss for a short position was not set, since the price did not go down 20 points before the US trading session. Thus, the deal should have remained open when the BoE announced the results of the meeting and the collapse began. At the same time, we recommend that novice traders exit the market before important events. Thus, we will assume that the newbies left the market and the trade was closed. The next sell signal should have been worked out when the price settled, and then bounced off the level of 1.3571. Here it was already possible to open positions without fear, and they turned out to be profitable, as the price continued to move downward and overcame the level of 1.3517 on its way. In total, the price went down another 85 points, which was enough to trigger any Take Profit or to close the deal manually at any profit. How to trade on Friday: At this time, there is still no trend on the 30-minute timeframe, and the volatility increased rapidly at the end of last week and quickly fell at the beginning of the new one. Since there is no trend, we do not advise beginners to follow the signals on the MACD indicator for some time. A trend movement is required for these signals to be relevant. The important levels on the 5-minute timeframe are 1.3612, 1.3638, 1.3688, 1.3708, 1.3740. We recommend trading on them on Tuesday. The price can bounce off them or overcome them. As before, we set Take Profit at a distance of 40-50 points. At the 5M TF, you can use all the nearest levels as targets, but then you need to take profit, taking into account the strength of the movement. When passing 20 points in the right direction, we recommend setting Stop Loss to breakeven. Novice traders can pay attention only to the index of business activity in the manufacturing sector of the European Union on November 2. This is not the most important report, so it is unlikely that it will have at least some impact on the movement of the currency pair. Basic rules of the trading system: 1) The signal strength is calculated by the time it took to form the signal (bounce or overcome the level). The less time it took, the stronger the signal. 2) If two or more deals were opened near a certain level based on false signals (which did not trigger Take Profit or the nearest target level), then all subsequent signals from this level should be ignored. 3) In a flat, any pair can form a lot of false signals or not form them at all. But in any case, at the first signs of a flat, it is better to stop trading. 4) Trade deals are opened in the time period between the beginning of the European session and until the middle of the US one, when all deals must be closed manually. 5) On the 30-minute TF, using signals from the MACD indicator, you can trade only if there is good volatility and a trend, which is confirmed by a trend line or a trend channel. 6) If two levels are located too close to each other (from 5 to 15 points), then they should be considered as an area of support or resistance. On the chart: Support and Resistance Levels are the Levels that serve as targets when buying or selling the pair. You can place Take Profit near these levels. Red lines are the channels or trend lines that display the current trend and show in which direction it is better to trade now. The MACD indicator consists of a histogram and a signal line. When they cross, this is a signal to enter the market. It is recommended to use this indicator in combination with trend lines (channels and trend lines). Important speeches and reports (always contained in the news calendar) can greatly influence the movement of a currency pair. Therefore, during their exit, it is recommended to trade as carefully as possible or exit the market in order to avoid a sharp price reversal against the previous movement. Beginners on Forex should remember that not every single trade has to be profitable. The development of a clear strategy and money management are the key to success in trading over a long period of time. The material has been provided by InstaForex Company - www.instaforex.com |
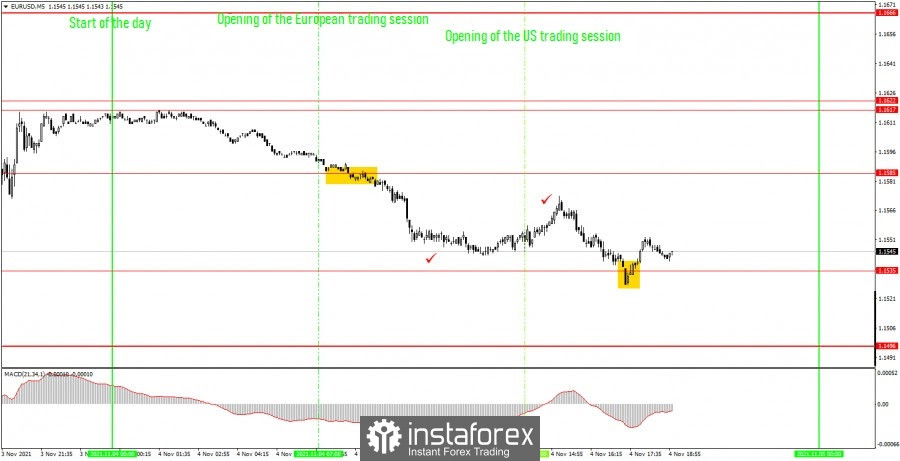
| Posted: 04 Nov 2021 02:15 PM PDT Analysis of previous deals:30M chart of the EUR/USD pair |
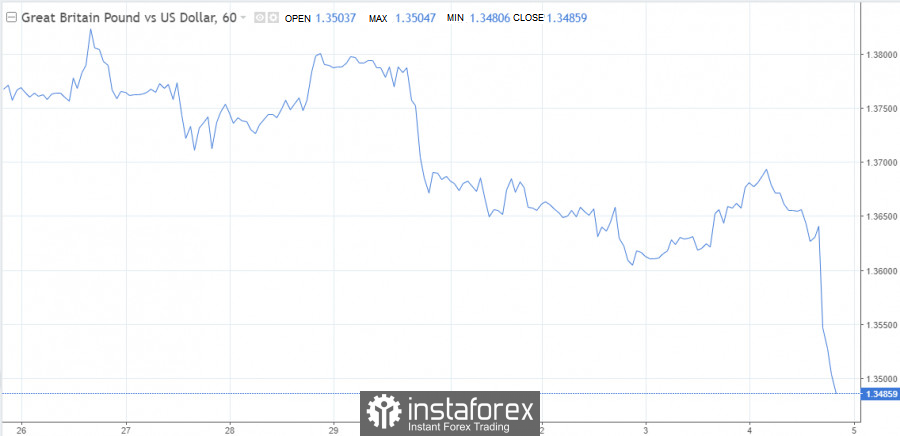
| GBP/USD. "Black Thursday" for the British currency: the pound swoops down throughout the market Posted: 04 Nov 2021 02:15 PM PDT The pound paired with the dollar plunges. In just a few hours, the pound lost more than 200 points. If the GBP/USD pair was at the borders of the 37th figure before the results of the Bank of England meeting were announced, then at the start of the US session, the price dropped to the base of the 35th figure. Now the bears are already testing the area of the 34th price level, but here the downward momentum has begun to fade – at least if we talk about the first wave of the downward movement. But in general, yesterday's favorite of the foreign exchange market turned into an outsider, losing the positions won. Only a few hours were enough for the GBP/USD pair to update the monthly price low. And judging by the intensity of passions, bears are "on their way" to the middle line of the Bollinger Bands indicator on the MN timeframe, which corresponds to the 1.3410 mark.
By and large, the pound has become a victim of inflated expectations. Over the past few weeks, hawkish rumors have been circulating on the market that the BoE could raise the interest rate already at the November meeting, ahead of the US Federal Reserve in this regard. But the British central bank disappointed the hawks by stating that the date of the first round of rate increases has not been determined: much will depend on incoming data – primarily in the inflationary sphere and in the labor market. That is why the market reacted so violently today to the results of the November meeting: the BoE did not meet the expectations of the GBP/USD bulls. Although by and large, the rhetoric of BoE Governor Andrew Bailey, was not categorical. For example, he stated that the rate "may need to be "raised" in the coming months" in order to return inflation to the target two percent level. It should also be noted that three out of nine members of the Committee voted for the early curtailment of the government bond purchase program. Recently appointed Catherine Mann (instead of Gertjan Vlieghe) joined her colleagues - Dave Ramsden and Michael Saunders - in voting for a reduction in QE. Saunders has consistently voted for this decision since May of this year, and Ramsden since the September meeting. And now they were accompanied by Mann, who strengthened the hawk wing of the central bank. In her speeches, she repeatedly urged her colleagues to start the process of normalization of PREP as soon as possible. But at the same time, she did not dare to support the hawks on the issue of raising the rate. Only two people voted for this decision – Ramsden and Saunders. For the first time in many months, several members of the Committee called for tightening monetary policy. But traders expected more. Much more. On the eve of the meeting, rumors were circulating in the market that the British central bank would raise the rate by 15 basis points already at the November meeting, which will be held this Thursday. In addition, some analysts assumed that in 2022 the BoE will also tighten the parameters of monetary policy – in May and November. But Bailey made it clear today that such a scenario would not be implemented. Having maintained a wait-and-see attitude in November, he said that the BoE had never said that it planned to change policy at any particular meeting. It is also necessary to pay attention to another Bailey phrase. Commenting on the future prospects of monetary policy, he noted that the English central bank does not have official data on the labor market after the collapse of the support scheme. We are talking about the so-called "Furlough scheme" for employees in the UK, according to which workers forced to stay at home due to the pandemic were paid up to 80% of their salaries. It began to be gradually phased out a few months ago, so it is not surprising that the members of the BoE wanted to look at the further development of the situation on the labor market after its full completion. Let me remind you that this Support Program, which has been in effect since March last year, has saved more than 11 million jobs. But in the summer, the "Furlough scheme" was decided to be gradually phased out: it completed its operation on September 30. At the same time, the latest data on the UK labor market were published for August (unemployment rate, wage dynamics) and September (an increase in the number of applications for unemployment benefits). Therefore, the members of the English central bank will be able to assess the state of the labor market without the influence of the incentive program towards the end of the year (the October unemployment rate will be published in December). This suggests that the BoE will consider raising the rate no earlier than February next year, that is, at the first meeting of 2022. Provided that the labor market and inflation do not disappoint the members of the English central bank.
The greenback also exerted additional pressure on the GBP/USD pair today, which is strengthening its positions throughout the market. The US dollar index jumped to a three-week high, reacting to the published data in the labor market. For example, a report published yesterday from the ADP agency came out in the green zone, reflecting an increase in the number of people employed in the private sector by 500,000. The dollar bulls were pleasantly surprised by another indicator. Thus, the growth rate of initial applications for unemployment benefits came out at around 269,000. This is the lowest value since March 14 last year. Such rosy figures on the eve of tomorrow's Nonfarm inspired dollar bulls, who organized a large-scale offensive throughout the market – including paired with the pound. It should be noted here that the GBP/USD pair can take a timeout after such a large-scale and impulsive fall, demonstrating a corrective pullback. But if we talk about broader time ranges, the pair has not yet exhausted its potential for decline. The main support level is located on the middle line of the Bollinger Bands indicator on the monthly timeframe (1.3410). I believe that this target is the main target of the GBP/USD bears in the medium term. The material has been provided by InstaForex Company - www.instaforex.com |
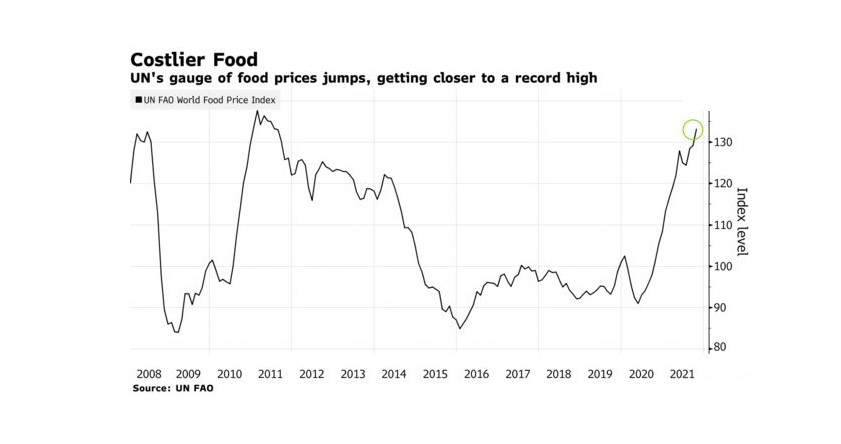
| Cost of food commodities rises again, holding new records Posted: 04 Nov 2021 12:23 PM PDT The UN Index, which tracks essential foods from wheat to vegetable oils, rose as much as 3% in October, indicating a new ten-year high. At the same time, the threat of further increase for end consumers, who are already facing the challenges of a new COVID-19 outbreak, remains at its highest. Global food prices rose again last month, threatening the economy with new records, and increasing the momentum of consumer price increases.Poor weather conditions this farm year have hit crops around the world. Besides, transportation costs skyrocketed and labor shortages affected the food supply chain from farms to supermarkets. The energy crisis also had a negative impact on producers, forcing greenhouses to incur additional costs and causing an additional risk of increased fertilizer bills for farmers. Global hunger levels reached multi-year highs back during previous Covid-19 outbreaks and are at risk of rising again, updating its readings. Abdolreza Abbassian, senior economist at the UN Food and Agriculture Organization said that the problem with materials and fertilizers and their impact on next year's crop was worrisome. He noted that by that time the market had accounted for most of the supply and demand issues. Abdolreza Abbassian added that the market had not considered next year's production prospects. It means that market players are already aware of current prices. However, producers and investors are concerned about a combination of future factors, therefore futures may be volatile. It could heighten bank and investor fears about inflation
Some regions are likely to continue to face food security concerns. On Thursday, the UN raised its global wheat trade forecast to a record high as purchases in Middle Eastern countries from Iran to Afghanistan are rising. Drought has reduced crops, increasing reliance on imported grain. Besides, it occurs amid rising prices. Abbassian said that it was the worst time for those countries as world prices were so high. However, he noted that people would not survive if 2022 turned to be a poor year for significant crops The rise in prices harkens back to the tough years of 2008 and 2011, which contributed to the global food crisis. While it takes time for commodity costs to be reflected in supermarket prices, officials in regions like North Africa and Turkey are already struggling to protect shoppers from the blow. According to the FAO, high farmers' costs could also stop cultivation of crops in the Northern Hemisphere, which are now planted. For example, the cost of nitrogen fertilizer hits producers hard, affecting the cost of production. Russia is going to introduce a six-month quota for these products. However, there are signs that prices for some foodstuffs are stabilizing. According to Abbassyan, last month, meat and sugar prices went down. Programs to offer consumers artificial meat are gaining support, although demand is falling. The specialist believes there are enough global grain and oilseed stocks to meet demand, and prices for rice, one of the world's most important foods, remain low. Abdolreza Abbassian said that people had better understanding what products they needed. He noted that uncertainty was probably decreasing. Actually, that sounds rather uncertain. First, it is due to the fact that regulators do not have answers that will satisfy consumers and reassure producers. Food futures will rise in the coming days. Besides, this trend will likely continue until spring. The material has been provided by InstaForex Company - www.instaforex.com |
| Bitcoin can overcome its all-time highs again and grow more than 7 times, as in the last halving Posted: 04 Nov 2021 11:59 AM PDT
Bitcoin can break its historic highs again and grow more than 7 times, as in the last halving. If the scenario of the previous halving repeats itself, then Bitcoin has every chance to enter a long bull run and update its historical quotes. Since the halving in May 2020, Bitcoin has grown in value more than 7 times. Many analysts are confident that the BTC/USD pair could break all records again if the historical precedent repeats itself. The current cycle remains closely related to the previous two cycles. As soon as the reward for miners is halved, the digital asset immediately demonstrates a huge increase - and this is a positive fact. If we look at 2017 as an example, then the next digital gold price spike could be around the $253,000 mark. After overcoming this scenario, Bitcoin will still work out its price level within certain parameters. Ethereum could grow too, according to Econometrics analytics. Ethereum has now hit its all-time highs and is trading at $4,470. It showed a significant increase, and if we compare it with Bitcoin and build on the Bitcoin halving cycle, then in a repeated scenario, Ethereum may grow more than 5 times and trade at $22,000. Prominent analyst Willy Woo is also confident that such growth is quite possible and justified. Woo shared his personal thoughts on Twitter this week. The analyst is confident that the upcoming halving will be unique in its own way. It will lead to a global price change in digital gold as well as its scalability. If everything goes in the right direction, then Bitcoin prices will skyrocket. Over the next five years, it will be interesting to observe this cycle and what financial results it can lead to. The material has been provided by InstaForex Company - www.instaforex.com |
| Posted: 04 Nov 2021 11:52 AM PDT |
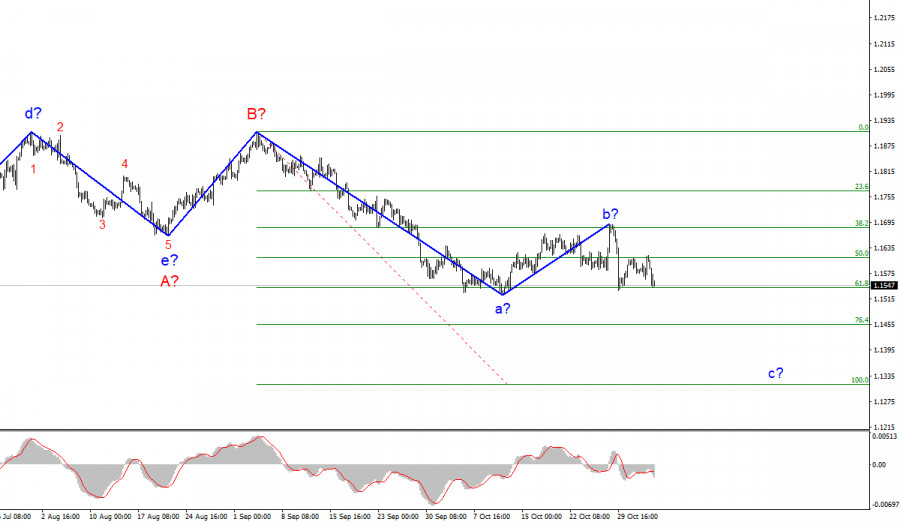
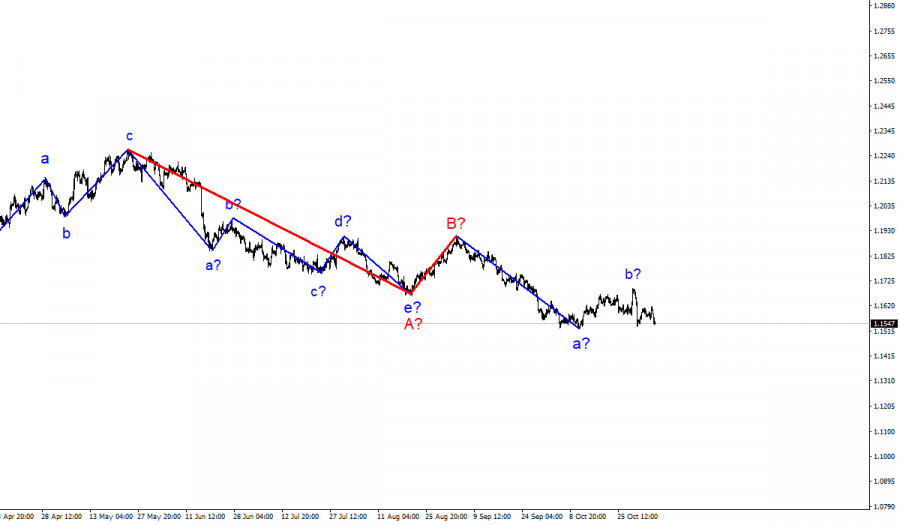
| Wave analysis of EUR/USD for November 4; The Fed has announced to taper QE Posted: 04 Nov 2021 11:30 AM PDT |
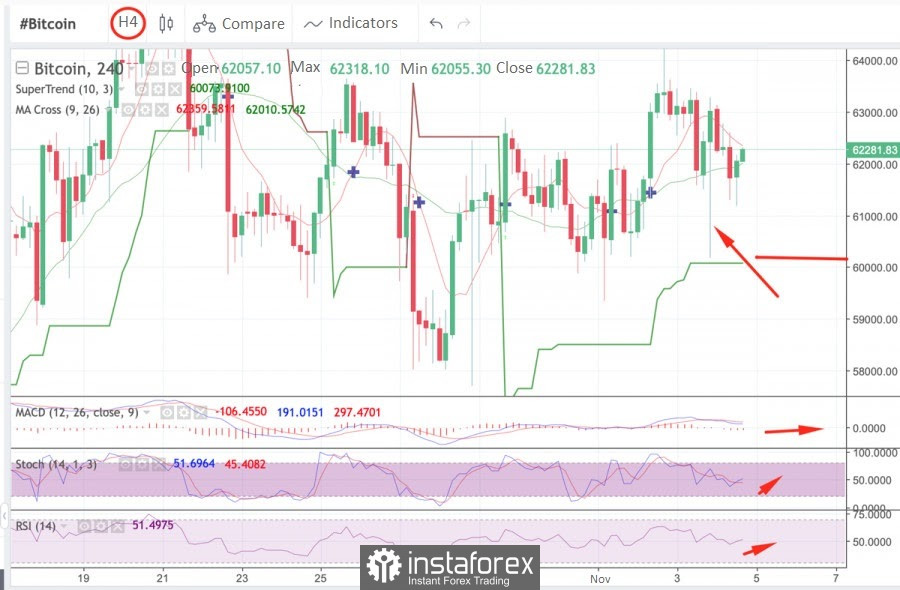
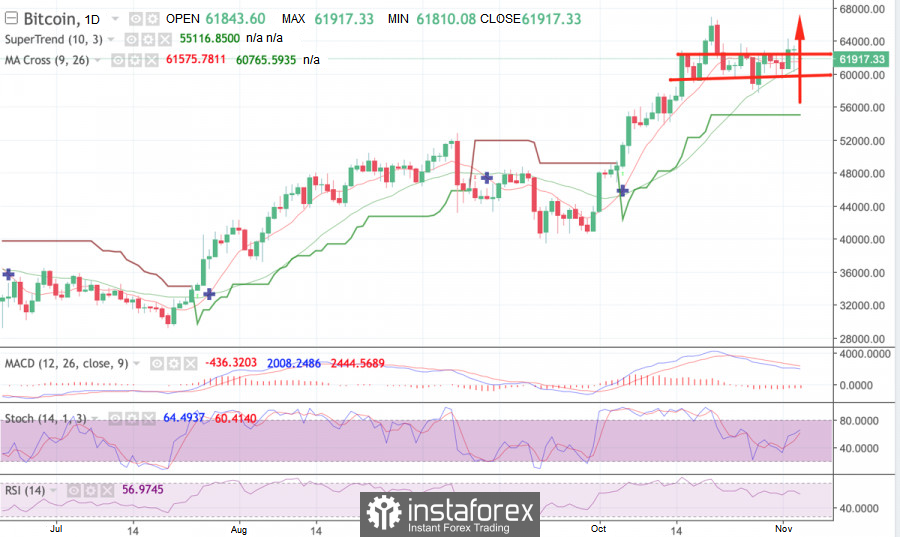
| Posted: 04 Nov 2021 10:23 AM PDT Bitcoin was moving confidently along a narrow range of $60k- $63.5k and was approaching the final stage of its bullish breakout. However, life itself intervened in the form of fundamental factors that provoked a fall in the price of the coin to the support level of $60k, where quotes began to recover. This event indicates that BTC will again begin to consolidate in the area soon and only then will it resume a bullish rally. However, before starting a technical analysis, it is worth examining the reason for the fall in the price of the cryptocurrency. The determining factor that negatively influenced the movement of the coin's price was the results of the Fed meeting, where the fate of the US monetary policy is decided. The members of the Federal Reserve have come to the conclusion that at the end of November a program will be launched to taper the emergency stimulus. The volume of infusions will decrease by $15 billion every month. This means that there will be less paper money in circulation, and, consequently, the rate of inflation will slow down significantly. Namely, the depreciation of fiat currencies is the main reason for the growth of BTC quotes due to the desire of large investors to protect their funds from inflation. Taking into account this news, the price of BTC sank by $3,000 per hour and subsequently recovered in the range of fluctuations of $61.5k- $63.5k. It is extremely important for any investor to maintain a calendar of major events in order to avoid illogical impulse price movements in the market. Later, the bears again seized the initiative and reduced the price to the lower border of the fluctuation range. Judging by the dynamics of the last hours, buyers again seize the initiative and continue to push the price to the upper border of the region. This is also indicated by technical indicators.: MACD is moving sideways, but with preconditions for the formation of a bullish crossover and the start of an upward movement. At the same time, the stochastic oscillator has formed a bullish crossover and tends to the 70 mark, while the relative strength index has long been in the upward zone.
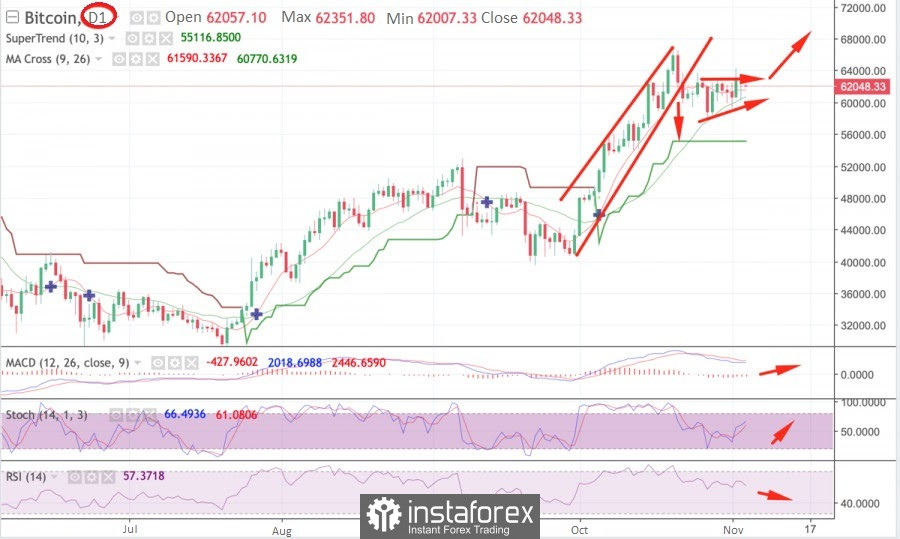
On the hourly chart, bulls are also taking over and triggering an upward trend, even though the asset is trading below the supertrend line. The price is trying to gain a foothold above $62k, where the line of increased selling pressure passes. Despite this, the technical indicators of the crypto on the hourly timeframe show a confident upward trend, which suggests that the strength of the medium-term trend is developing more slowly than the short-term one. MACD is completing the formation of a bullish crossover, and the stochastic oscillator has crossed the 50 mark, which indicates an increase in purchases and a desire to move to the upper border of the range. Doji candlestick has formed on the daily chart, which indicates an uncertain price movement. However, it should be borne in mind that in this case, the appearance of such a pattern indicates a rebound in quotes from the support zone at $60k after the results of the Fed meeting. There is nothing strange about the current state of the BTC price, as the asset continues to move sideways, consolidating the price. It is not recommended to trade in such a range, only if, according to a broader analysis, quotes move from the upper to the lower border of the range. The current area of Bitcoin price movement is between $58.7k- $62.7k, and judging by the uncertainty of bulls and bears, the period of stabilization will continue. The technical indicators of the coin also signal this: MACD is moving sideways, and the relative strength index began to decline past the 40 mark, which indicates a lack of impulse to buy and pressure on the price from buyers. Stochastic continues its upward movement, but will soon form a bearish crossover, which will mean the final loss of the medium-term upward momentum.
|
| November 4, 2021 : EUR/USD daily technical review and trading opportunities. Posted: 04 Nov 2021 09:28 AM PDT
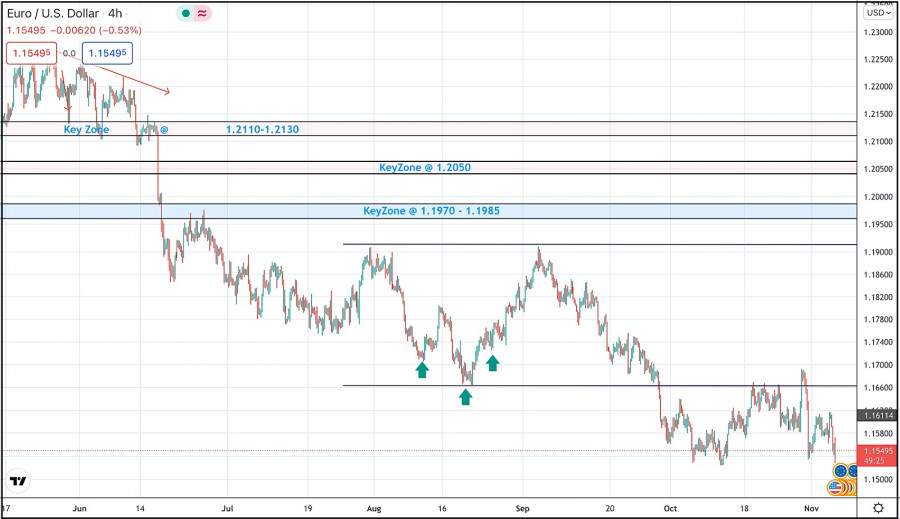
Recently, Persistence below the depicted price zone of 1.1990 indicated further downside movement towards 1.1840 and 1.1780 where a sideway consolidation range was established. During last week, the EURUSD pair has been trapped within a narrow consolidation range between the price levels of 1.1780 and 1.1840. A bullish breakout was executed above 1.1840 shortly after. Temporary Upside pullback was expected towards 1.1990. However, re-closure below the price level of 1.1840 has initiated another downside movement towards 1.1780 which failed to hold prices for a short period of time before significant upside movement was presented into market. Intraday traders were advised to wait for candlestick closure above 1.1780 - 1.1840 for another ascending swing to be initiated. However, immediate downside selling pressure brought the pair down below 1.1700. More downside movement took place towards the price level of 1.1600 where significant buying pressure existed. Bearish persistence below 1.1700 and 1.1600 has enhanced further decline towards 1.1500. Currently, the price zone around 1.1700 stands as a prominent supply-zone to be watched for SELLING pressure and a possible SELL Entry upon any upcoming ascending movement. The material has been provided by InstaForex Company - www.instaforex.com |
| November 4, 2021 : EUR/USD Intraday technical analysis and trading plan. Posted: 04 Nov 2021 09:27 AM PDT
Bearish persistence below the price zone of 1.2050-1.2000 allowed the recent downtrend to be established. So, the EURUSD pair has expressed significant bearish decline while the price level of 1.1650 stood as a prominent demand level that prevented further bearish decline. The bullish pressure that originated around 1.1650 failed to push higher than the price level of 1.1900. That's why, another bearish pullback towards 1.1650 was executed. Bullish signs were expected around the price levels of 1.1650-1.1700 as it corresponded to a recent previous bottom. However, extensive bearish decline has pushed the EURUSD pair towards 1.1600 and lower levels was about to be reached if sufficient bearish momentum was maintained. Moreover, significant bullish recovery has originated recently upon testing the price level of 1.1570. The recent bullish pullback towards 1.1650-1.1680 was expected to offer bearish rejection and a valid SELL Entry. Significant bearish decline brought the EURUSD pair again towards 1.1550 levels which still stands as an Intraday Support zone. Hence, sideway movement maybe expected in the nearest future. Please note that any Bullish movement above 1.1680 should be considered as an early exit signal to offset any SELL trades. The material has been provided by InstaForex Company - www.instaforex.com |
| November 4, 2021 : GBP/USD Intraday technical analysis and significant key-levels. Posted: 04 Nov 2021 09:24 AM PDT
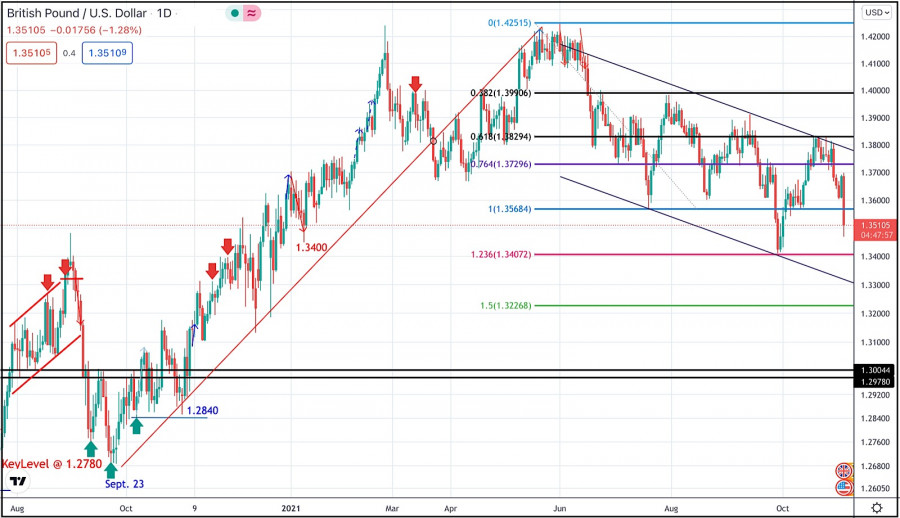
The GBPUSD pair has been moving sideways with some bearish tendency while bearish breakout below 1.3600 was needed to enhance further bearish decline. On the other hand, the nearest SUPPLY level was located around 1.4000 where bearish rejection and a valid SELL Entry was anticipated. The recent bullish rejection witnessed around 1.3600 as well as the temporary bullish breakout above 1.3830 indicated a high probability that this bullish movement may pursue towards 1.4025 then 1.4100. However, the pair remained trapped within a fixed price range until significant bearish momentum emerged into the market. Bearish breakout below 1.3680 enabled further bearish decline towards 1.3400 which corresponded to 123% Fibonacci Level of the most recent bearish movement. This was a good entry level for a corrective bullish pullback towards 1.3650 and 1.3720 which was temporarily bypassed. Recently, the pair was testing the resistance zone around 1.3830 where bearish pressure originiated into the market. Currently, the short-term outlook is bearish as long as the pair maintains its movement below 1.3730. Another bearish visit was expected towards 1.3570 and probably 1.3400 as they correspond to significant Fibonacci Expansion Levels. The material has been provided by InstaForex Company - www.instaforex.com |
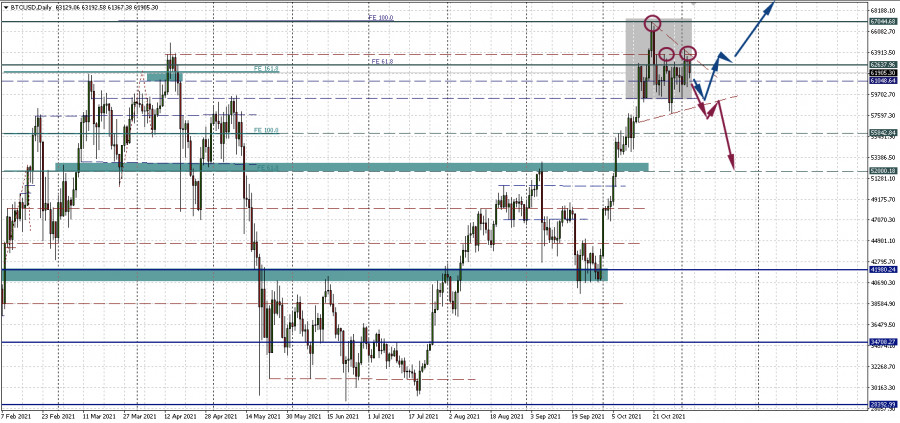
| Trading signal for BITCOIN (BTC) on November 04-05, 2021: sell below $62,500 (2/8) Posted: 04 Nov 2021 09:07 AM PDT
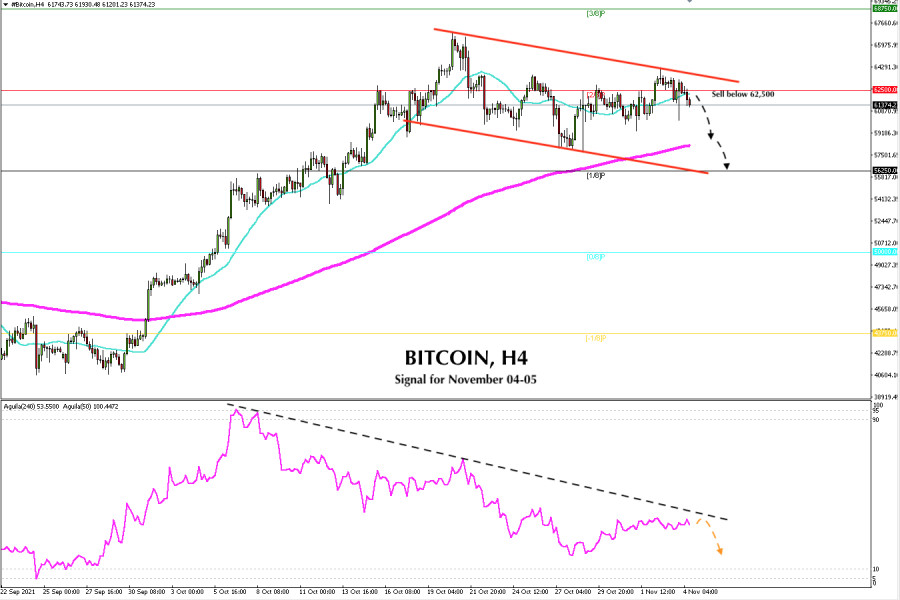
Since October 11, Bitcoin has been consolidating around the 2/8 murray at 62,500. Until today, it continues to oscillate below this level and also below the SMA of 21. In this context, we can see that BTC is showing signs of weakness and is likely to fall as low as the 200 EMA, around 57,500. Because Bitcoin has not been able to achieve a sustained upward movement, on the contrary, it started a consolidation that takes approximately 20 days. This is a sign that the bulls are taking profits and little by little the bears are increasing their positions. BTC could have a very strong correction in the next few days and slump to the psychological level of 50,000 around 0/8 of the murray. According to the 4-hour chart, the main trend is bullish. If Bitcoin consolidates above the $ 63,500 level in the next few hours, it will mean that the market has resumed its main trend. BTC is likely make an upward movement to 3/8 murray around 68,750 and up to the next psychological level of 70,000. The key is the level of 62,500 as long as it remains below this level. BTC is likely to make a downward movement and it could oscillate within this price range. A clear break below the 200 EMA will mean that the main trend is changing and BTC will start a downtrend with targets up to $ 50,000. The flagshup cryptocurrency could fall to the price levels of September 27, around 43,750. The market optimism regarding Bitcoin is running out very clearly. We can see it in the 4-hour chart. The last candles that the price has left are short and small-bodied such as dojis and pinbar, showing indecision in the market. According to the eagle indicator, it is observed that the market volume is decreasing. Therefore, our trading plan is to sell while the price of Bitcoin is below the 21 moving average, and below the strong resistance of 6/8 of murray, with targets at 57,500 and up to 56,250. Besides, if it bearish pressure prevails we will continue selling with targets at the psychological level of 50,000. Support and Resistance Levels for November 04 - 05, 2021 Resistance (3) 65,540 Resistance (2) 64,167 Resistance (1) 62,242 ---------------------------- Support (1) 58,945 Support (2) 57,707 Support (3) 56,250 *********************************************************** A trading tip for BITCOIN for November 04 - 05, 2021 Sell below 62,500 (2/8) with take profit at 57,500 (EMA 200) and 56,250 (1/8), stop loss above 64,000. The material has been provided by InstaForex Company - www.instaforex.com |
| The Fed is going to wind down the emergency stimulus program Posted: 04 Nov 2021 08:55 AM PDT Over the past six months, bitcoin has significantly expanded its institutional audience due to the coronavirus crisis and worsening inflation. Small investors receive additional income from operations with bitcoin, and large capital uses the asset to hedge risks. The inflationary crisis has seriously intensified due to the Fed's stimulus program, which has become a catalyst for the growth of all markets. However, soon investment flows in BTC may decrease. The main reason for this was the results of the next meeting of the Fed, where it was decided to launch the curtailment of the incentive program. According to representatives of the department, the reduction will occur by $ 15 billion monthly. Earlier, the Fed injected more than $ 120 billion a month into the economy by purchasing government bonds. Despite the negative nature of the news, which promises a drop in the indices in the long term, the markets welcomed the news, and the SPY index rose by almost a percentage. Bitcoin reacted less optimistically and sank by $ 3k, but then quickly recovered to the usual range of fluctuations of $ 60.5k - $ 63k. Most likely, the market was ready for such news and looked stable before the shock wave. Despite this, the inflation rate will slow down significantly after the gradual curtailment of the financing program, which will affect investors who will again turn to less volatile assets. Bitcoin will have to look for new ways to attract investment to keep the current interest. The NFT and Defi markets should be recognized as possible options for expanding the capabilities of bitcoin. However, BTC has other advantages that can positively influence the price and the overall development of the coin ecosystem. We are talking about ETFs that have already been launched on the futures market. Previously, many crypto influencers stated that such a product would appear on the US spot market no earlier than 2022. Individuals of the United States government turned out to disagree with this position of the regulator and sent a letter to the chairman of the department demanding to allow the operation of a direct ETF for bitcoin. Among the main arguments of the policy stated the availability of cryptocurrencies for millions of investors in America and the relatively high volatility of futures ETFs. Whether these actions will affect the SEC's position will become clear very soon, because the regulator has at least 10 applications for launching exchange-traded funds on the spot market. Meanwhile, bitcoin is trading at $ 61.8k. Negative news after the Fed meeting pushed the coin back to the lower part of the current range of fluctuations. The current price movement indicates the continuation of the consolidation period, which should take less time after today's local collapse. This is because the price has repeatedly tested most of the levels, and therefore it will take less time to overcome them. At the same time, strong market support is needed for buyers who continue to accumulate Bitcoin. Now the total reserves of coins in the hands of large investors are at an absolute maximum for 2021, which indicates the end of the accumulation period and the imminent exit from the fluctuation zone into the growth zone. This is also indicated by the technical indicators of the cryptocurrency: the stochastic oscillator continues to move along an upward trajectory, and the relative strength index is in the bull market area, above the 40 mark, despite the prerequisites for a decline. At the same time, the MACD remains neutral, which indicates the continuation of the trend towards consolidation within the daily timeframe. Most likely, when crossing the lower range of the entire oscillation area, the crypt will try to make a powerful breakthrough by forming a large bullish candle. The likely starting point of the bullish rally may be the $ 62.7k mark.
|
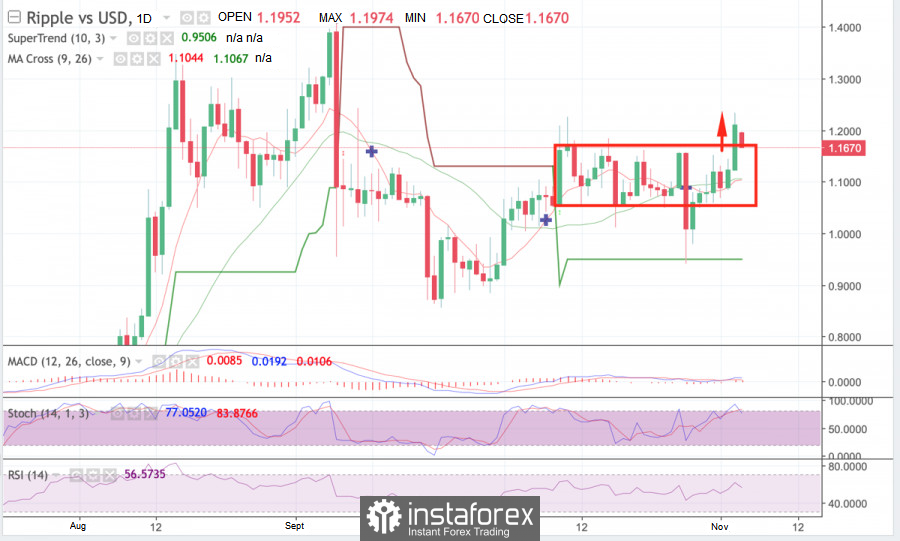
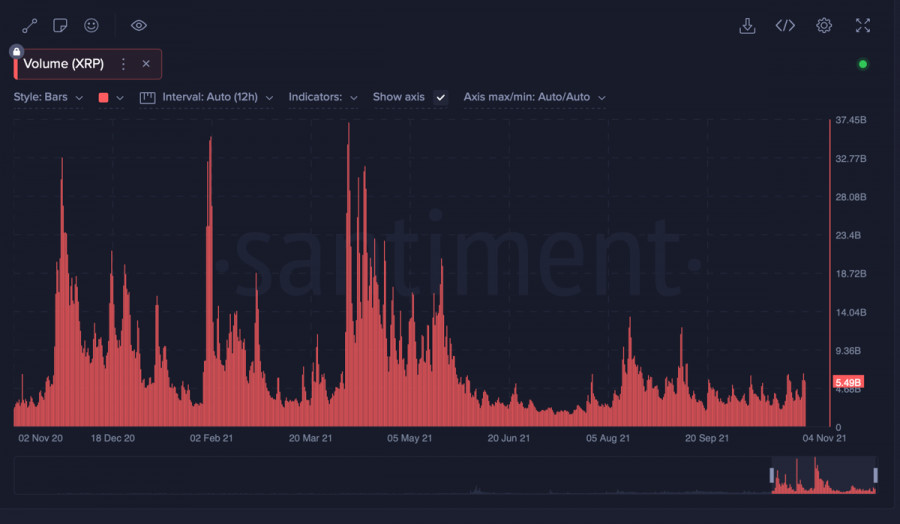
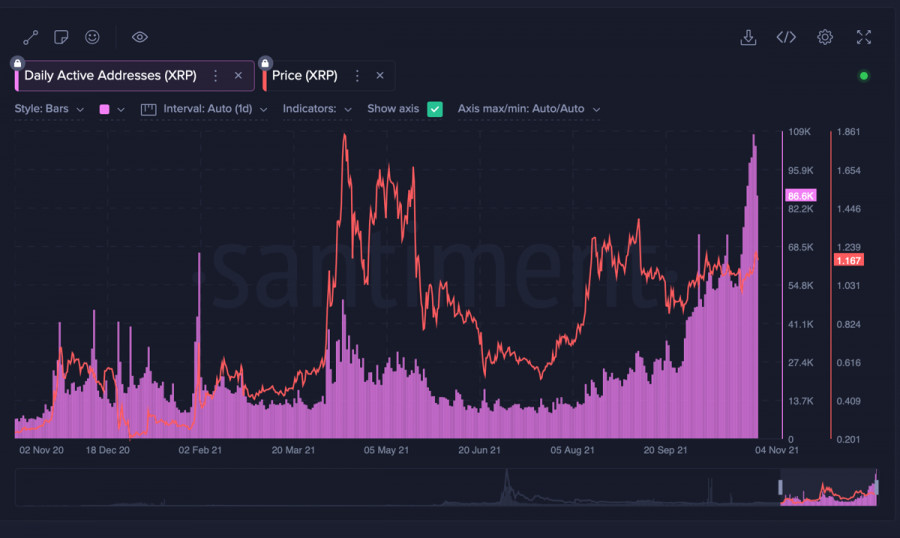
| Posted: 04 Nov 2021 08:55 AM PDT Over the past week, the forgotten XRP token has shown a significant increase, rising in price by 20%. The price of the coin reached a local maximum of $ 1.2. At the same time, the on-chain activity of the coin continues to go through the roof, which indicates continued growth. The divergence between the price and the on-chain indicators of the crypt began to fall after investors were given real reasons to invest in the asset and hope for further growth. A factor in the growth of XRP was the decision of the issuing company Ripple to distance itself from the Ledger distributed ledger network. Now Wrapped will become the main supplier of the coin, and the coins will be stored under the management of Hex Trust. The new WXRP will be provided with an XRP in a ratio of 1:1, and the activity of the new token will allow abstracting from litigation and conducting transactions using decentralized applications. Thanks to this, the influence of coins on the Defi markets will increase significantly and will attract new investors to the main asset network. In addition, the transition under the wing of the Wrapped company will allow holders of the new coin to gain access to the entire ecosystem of the main altcoin - ETH. In other words, the issuing company of the cryptocurrency is going to transfer all the power of its coin to the ether, which was once perceived as the main competitor of XRP. Given Ripple's previous attempts to develop the coin ecosystem, a local merger may benefit the cryptocurrency. We should definitely expect an increase in investment flows from the retail and institutional audience, as well as the emergence of decentralized applications based on XRP. However, the partial transition to ETH can be perceived as an attempt at rebranding in the eyes of investors and distancing themselves from litigation with the SEC. Most likely, both theses are true and Ripple will really continue to actively expand the capabilities of the coin ecosystem and simultaneously protect the reputation of the new token. Opinions may be different, but the market reaction is the same - the price of the coin has increased by 20% over the past 7 days, which indicates the acceptance of the "rebranding" by investors. The asset is trading around $ 1.17 with daily trading volumes of $ 6.5 billion. Over the past day, the cryptocurrency has risen in price by 3.5% and formed a confident green candle on the daily chart. Thanks to the positive news, the coin managed to break through the final point of the resistance area, but, apparently, the breakdown was false. This is evidenced by the decline in the price over the $ 1.2 mark and the weakness of the medium-term impulse upward movement on technical indicators: the MACD formed a bullish intersection at zero, but immediately turned around to move flat, which indicates the weakness of the upward momentum. At the same time, stochastics formed a bearish intersection, which is a pattern for further decline, and the relative strength index has already crossed the 60 mark and continues to decline.
Most likely, the current movement is a correction after the formation of a powerful bullish candle, and in the near future the price will stabilize and continue the upward movement. This is also indicated by the high level of social activity in the coin network and the average levels of transaction volumes. In the short term, the project managed to move away from the trial, and further price movement depends on success in using the ether ecosystem and developing its own.
|
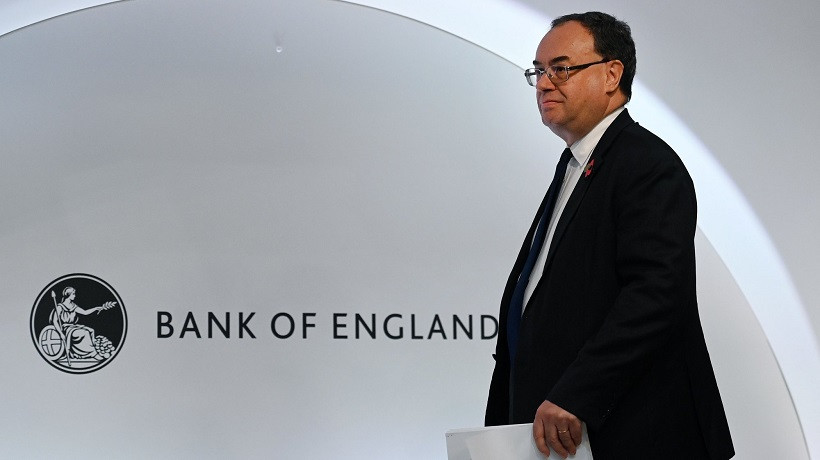
| No one promised anything: Bailey jumped, the pound collapsed Posted: 04 Nov 2021 08:54 AM PDT
The pound will grow. The growth of the pound will surpass the growth of the dollar. While market players were dreaming about how the pound would jump at the outcome of the Bank of England meeting, which gave a clear signal to tighten policy, fate decreed a little differently. The British regulator on Thursday, as expected, kept the discount rate at 0.1%. The asset repurchase plan remained at 895 billion pounds. Given that some analysts did not rule out the possibility of tightening monetary policy, such a decision led to a sharp drop in the British currency.
The decision not only collapsed the pound but also undermined the confidence of the markets in the Bank of England and specifically its head, Andrew Bailey. Press conference During a press conference, Bailey said that he had not promised anything to the markets and none of the members of the regulator had said at what specific meeting the bank might decide to raise the rate. The outcome of the meeting could be anything, "We are in a situation where it is not easy to make decisions," the official concluded. The situation with inflation is difficult in the UK, as well as around the world, but deciding in a hurry and on emotions will be wrong and may have unpleasant consequences. Now there are no official statistics on the labor market after the collapse of the support scheme. There will be two such reports before the December meeting, and it will be a little easier to judge. At the same time, Bailey emphasized that he was not hinting at anything. The fact that he recognizes the difficulties does not mean that the regulator will raise the rate "tomorrow". The Central Bank will certainly act with an eye on the labor market. The unemployment rate should not rise significantly in the short term, but there is a "high degree of uncertainty". The country's GDP, as expected by the Bank of England, will continue to recover after the pandemic. At the same time, the regulator lowered the forecast of economic growth next year to 5% from 6% announced earlier. The Central Bank also expects further acceleration of inflation. In the second quarter of 2022, it may exceed 4.8%. Thus, a moderate tightening of the PEPP will be necessary to achieve a steady inflation rate of 2% in the medium term. So, the markets have not received specifics regarding the further step of the Bank of England. The regulator does not say that it will raise the rate, and at the same time does not refuse such a step. Will there be a rate increase and when will it be? Maybe the Central Bank is thus preparing the markets for the upcoming rate hike. How the votes were distributed The hawks at the Bank of England are now in the minority. The votes were distributed in the following proportion: 7 to 2. Officials consider it necessary to wait for fresh data before making a hasty decision. What will happen to the pound The pound was the main loser on Thursday. The November meeting was an extremely bearish factor. The "Briton" fell not only in a pair with the US dollar, but it also sank by more than 100 points in a pair with the yen and updated the lows against the Canadian dollar. Such a strong drop is because some optimists seriously thought that the bank would raise the rate by 15 points. It is worth noting that this reaction is more emotional. It is unlikely that the next day there will be an equally serious rate of decline in the pound. The material has been provided by InstaForex Company - www.instaforex.com |
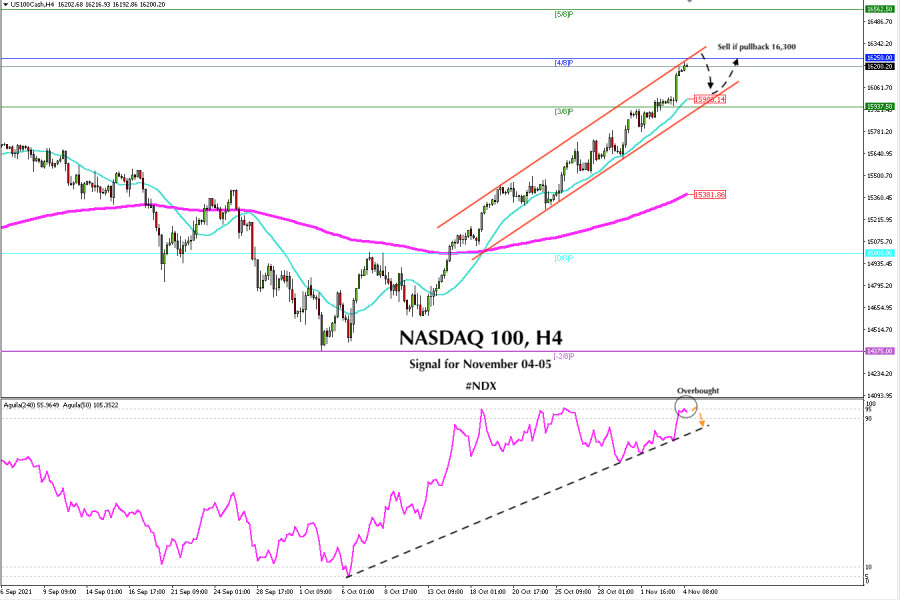
| Posted: 04 Nov 2021 08:11 AM PDT
In the early American session, the Nasdaq 100 Technology Index (#NDX) is trading below 4/8 of murray with a strong uptrend. The index is likely to proceed with the upward movement, so we should expect a consolidation around 16,250-16,350. This will be a zone of strong resistance according to the daily R2. If the bullish force prevails, we should wait for the next resistance around 16,350. If the Nasdaq 100 index consolidates in this zone, it will be a good opportunity to sell with targets at the 21 SMA located at 15,988. The main trend of Nasdaq 100 according to the 4-hour chart is still bullish. So, we should be very careful with this strategy. It is essential to wait for the last 4-hour quotes to form a top with small-bodied candles such as dojis and a pin bar. Then it will be a sign of exhaustion with a clear selling opportunity. The eagle indicator has reached a key level around 95 points suggesting that the index is extremely overbought. The Nasdaq 100 is likely to make a strong downward correction in the new few hours or days. Therefore, we should expect a key level of resistance with the parameters indicated above, to be able to sell with targets up to the SMA of 21 and to the bottom of the uptrend channel around 15,980. Our forecast is to sell the Nasdaq 100 around 16,250 – 16,350. If it manages to consolidate in this zone and shows clear signs of weakness, it will be a good selling opportunity with targets at 3/8 of a murray around 15,931. The eagle indicator supports our bearish outlook because it is very overbought. Support and Resistance Levels for November 04 - 05, 2021 Resistance (3) 16,426 Resistance (2) 16,350 Resistance (1) 16,224 ---------------------------- Support (1) 16,082 Support (2) 16,008 Support (3) 15,937 *********************************************************** A trading tip for NASDAQ 100 for November 04 - 05, 2021 Sell if the index pulls back around 16,250 - 16,350 (strong resistance) with take profit at 16,150 and 15,980 (3/8), stop loss above 16,426. The material has been provided by InstaForex Company - www.instaforex.com |
| Bitcoin: What do record activity and hints of spot ETFs mean? Posted: 04 Nov 2021 07:49 AM PDT After reaching a new all-time high, the small price pullback did not scare the large Bitcoin holders. Glassnode reports show that holders continue to hold positions, and the illiquid supply of bitcoins has reached a record of 14.52 million. Other data from Chainalysis show that the bulk of purchases come from large market participants. Whales have bought 142,000 BTC in the last week. The report also says that addresses of whales with more than 1,000 BTC have the highest supply rate in all of 2021. Bitcoin Whales had 185,000 coins in February, but they were sold in May when BTC was near the previous all-time highs. But during the last week of October, the whales acquired another 142,000 BTC, bringing the total reserves to over 200,000. It is worth noting that the last week, when the sideways dynamics of BTCUSD was observed on the market, was also distinguished by a sharp increase in the activity of bitcoin addresses. Over a period of five days, over a million addresses have been interacting on the bitcoin blockchain. The market is waiting for new drivers of growthThe jump in BTC prices in October was triggered first by the anticipation and then by the actual approval of Bitcoin futures ETFs. Now the euphoria in the market about this has calmed down a little. The next question is with spot ETFs for the main cryptocurrency. This time the initiative came from two US congressmen, Tom Emmer and Darren Soto. They sent letters to Gary Gensler, Chairman of the Securities and Exchange Commission, asking: "We question why, if you are comfortable allowing trading in an ETF based on derivatives contracts, you are not equally or more comfortable allowing trading to commence in ETFs based on spot Bitcoin. Bitcoin spot ETFs are based directly on the asset, which inherently provides more protection for investors." A request for a spot Bitcoin ETF from legislators could speed up the approval process for new funds. And this will be a new impetus for the market. In parallel, the demand for Ethereum Futures ETF is growing. Institutions and developing countries - two drivers for the growth of BTC to $760,000Such an interesting statement was made by the head of Ark Invest Cathie Wood. She is known as an active supporter of Bitcoin. Wood made her prediction that Bitcoin may well be worth $760,000 per coin based on the assumed calculations of interest from two large demand groups: developing countries and institutional investors. The first, following El Salvador, may begin to approve bitcoin as a national currency. Demand will be driven by distrust of the financial system and corrupt government. If such a chain reaction occurs, according to Wood, Bitcoin could rise by about $200,000. On the other hand, institutional adoption will continue to grow. The beginning has already been made, the continuation in the form of ETFs opens up new opportunities for institutions to invest in cryptocurrency. Don't forget the "carrot" ahead in the form of spot ETFs and yields, and the "whip" behind in the form of rising inflation. Wood believes that if institutions send at least 5% of their portfolios to bitcoin, demand could push BTC another $500,000 higher. That is a total of 700,000 dollars to the existing 62,000 - 67,000 on the market. Globally is beautiful, local is indefiniteWhile we are discussing global and long-term drivers for Bitcoin's growth, the local technical landscape remains unchanged. And no matter how we evaluated the technical picture, through the triangle, or sideways 59,383.67 - 62,637.96 (both true), a local uncertainty remains. For those who like to trade sideways, you can still have time to sell from the resistance of 62,637.96 (although the stop will already be too big). For the rest, the prognosis remains the same, as does the need to be patient. With the current technical landscape, a deeper correction is still possible. The downside potential of the triangle will be $52,000 per coin. And the potential of upside work is the achievement and update of the historical maximum.
|
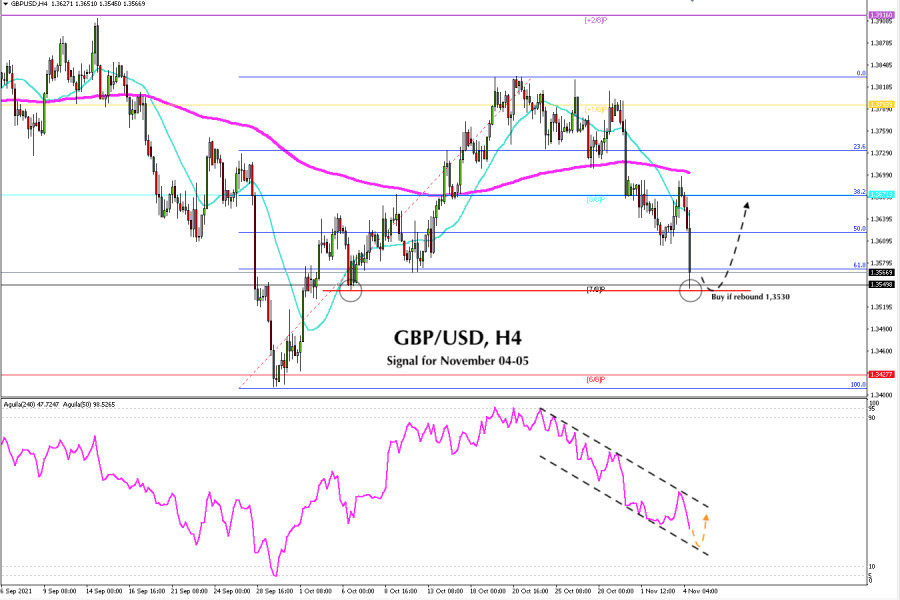
| Trading signal for GBP/USD on November 04-05, 2021: buy in case of bounce at 1.3530 (strong support) Posted: 04 Nov 2021 06:45 AM PDT
GBP / USD started a very rapid decline immediately after the Bank of England announced that interest rates would remain unchanged at 0.10%. The British pound weakened and is currently trading at 1.3566 against the US dollar, resuming its bearish movement that began on October 25. In the European session, GBP/USD tested the 200 EMA and it proved to be strong resistance that put an end to its upward movement. Then, the pair started a retracement. By the time of writing, GBP/USD has fallen more than 150 pips. We hope it finds good support around the 1.3530 level where there is the key support of October 6. If the British pound manages to bounce around 7/8 murray, the pair is likely to make a technical reversal and could rise again to find resistance at the 8/8 murray level around 1.3671. A break below 1.3500 will be a negative sign and the pair could fall to the level of 1.3427, where 6/8 of a murray is located, which represents strong support. 1.3530 is the key level. If GBP consolidates above this zone, we could expect a technical bounce because it is also a psychological level and could give us an opportunity to buy. We believe that the pound could recover from the sharp fall after the negative announcement from the BoE. Therefore, you can buy around 1.3530 with targets at 1.3580 and 1.3623. Since October 18, the eagle indicator has been testing the overbought level around 95 points. After three opportunities to touch this level, it began its fall on October 28 around 1.3813. In just one week, GBP/USD has dropped almost 300 pips, approaching oversold levels. Therefore, we expect a technical bounce in the next few hours above 1.3530 or above 7/8 of murray and above 61.8% of Fibonacci. Our forecast is to expect a consolidation around 1.3530. If we see that the pair bounces in this area, it will be an opportunity to buy with targets towards the 50% Fibonacci around 1.3620 and up to the 38.2% Fibonacci around 1.3671 where there the 8/8 of murray is located that represents strong resistance. Support and Resistance Levels for November 04 - 05, 2021 Resistance (3) 1.3659 Resistance (2) 1.3623 Resistance (1) 1.3574 ---------------------------- Support (1) 1.3462 Support (2) 1.3427 Support (3) 1.3410 *********************************************************** A trading tip for GBP/USD for November 04 - 05, 2021 Buy if the pair rebounds at 1.3530 (strong support) with take profit at 1.3623 and 1.3671 (8/8), stop loss below 1.3490. The material has been provided by InstaForex Company - www.instaforex.com |
| Pfizer's latest phase of vaccine trials falsified Posted: 04 Nov 2021 06:37 AM PDT
Former Pfizer-BioNTech coronavirus vaccine clinical trial participant Brooke Jackson has alleged scandalous irregularities and tampering that took place during Ventavia Research Group's trials of the medicine. Brooke Jackson is the former Regional Director of Ventavia. She has more than 15 years' experience in managing clinical trials for medicines. According to Jackson, she repeatedly asked the company's head office to end with the numerous irregularities and adulterations that took place during the vaccine trial. She was suspended from research because of her unwillingness to turn a blind eye to what was going on at the company. In September 2020, she was fired for filing a complaint with the Food and Drug Administration (FDA). Brooke Jackson has told BMJ journalists that the staff who carried out the research and vaccination were not sufficiently qualified for such activities, and the team improperly monitored the side effects. She published dozens of internal company documents, including photographs, videos and audio recordings. Jackson also provided emails. All of these documents have been verified and proved gross violations by the research team. The management of Ventavia Research Group also concealed these irregularities. For example, the photos show that used needles are disposed of in a plastic bag for biological waste, rather than in a separate container for the sharp objects. Vaccine packs had participant numbers written on them. So, participants were able to know whether they were being given the vaccine or a placebo. In addition, Jackson provided documentation showing that the prescription of the drug or placebo was written on the participants' cards. Brooke Jackson also provided journalists with an email from the research company ICON (a Pfizer partner) to Ventavia. In this letter, ICON reminds Ventavia staff to respond promptly to any feedback from trial participants within the first 24 hours of administering the drug. However, about 100 unchecked requests older than three days were then highlighted in the email. According to Jackson, participants did not receive proper medical supervision after they were injected, and that patients with adverse reactions were not watched in time. Moreover, the vaccine was kept at the wrong temperature. The BMJ also questioned two other Ventavia employees, but they also reported all the irregularities. One the participants said she had never seen such gross mistakes in Ventavia during a Pfizer vaccine trial, even though she had previously been involved in more than 40 clinical trials. During an independent investigation by BMJ staff, it was found that the test results had been falsified constantly. Much valuable information was concealed, and the identities of the volunteers were made public. The fact that Ventavia representatives turned a blind eye to numerous patient complaints about serious side-effects during the trials and did not act promptly on the nature of the health complications also seems strange. Accordingly, the Pfizer-BioNTech vaccine, which is approved by the Food and Drug Administration (FDA) and the European Medicines Agency (EMA) for use in the US and EU countries, has not been properly tested for quality, safety and efficacy. Trials of the vaccine failed to meet the standards and regulations that Pfizer executives have consistently reported to the media. At the same time, under-explored drug is actively used in most countries of the world. In May, the US approved the vaccine for adolescents over the age of 12, and on November 3 it was approved for children aged 5 to 11. The material has been provided by InstaForex Company - www.instaforex.com |
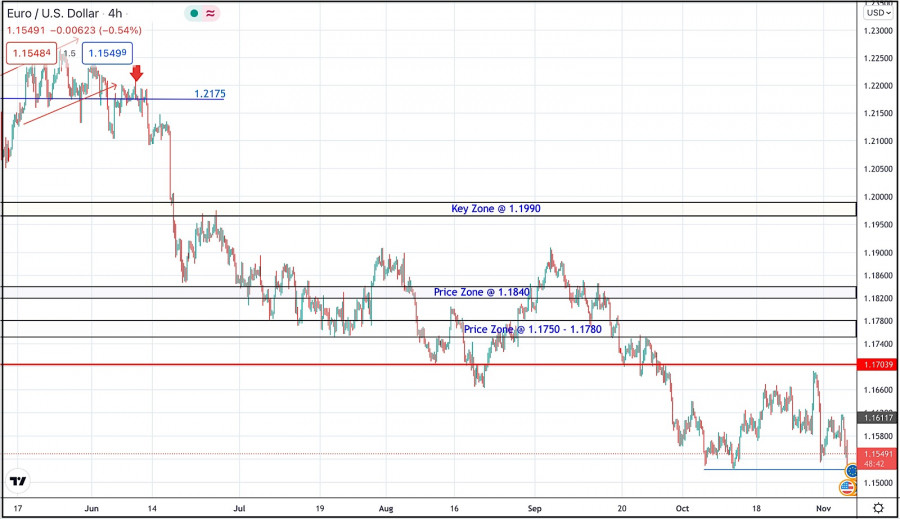
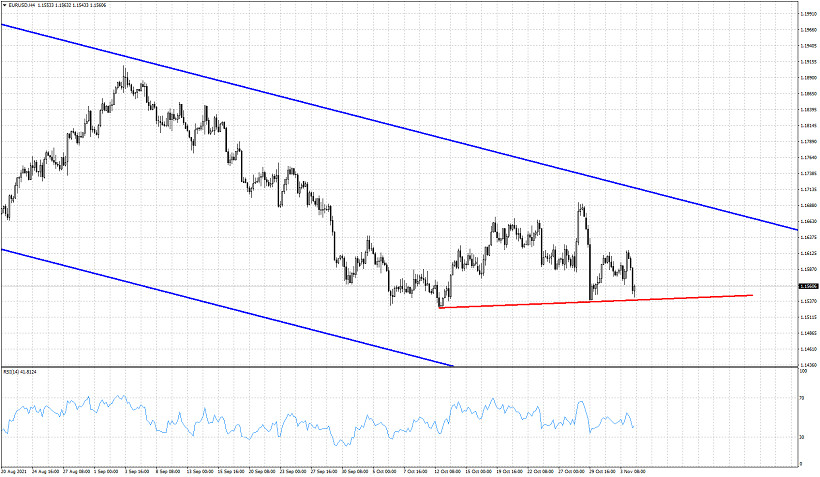
| EURUSD could provide a new sell signal if price breaks 1.1538. Posted: 04 Nov 2021 06:27 AM PDT EURUSD bounced yesterday above 1.16 only to reverse today and make new lower lows. Short-term trend remains bearish as price is still inside the bearish channel. So far price holds above the horizontal support of 1.1538.
Red line- horizontal support As shown in the 4 hour chart above, price is challenging the horizontal support around 1.1538. Breaking below it will open the way for a move towards 1.14. That is why it is crucial to see how price reacts over the coming days. Resistance is found at 1.17 and we remain bearish as long as price is below this level. The material has been provided by InstaForex Company - www.instaforex.com |
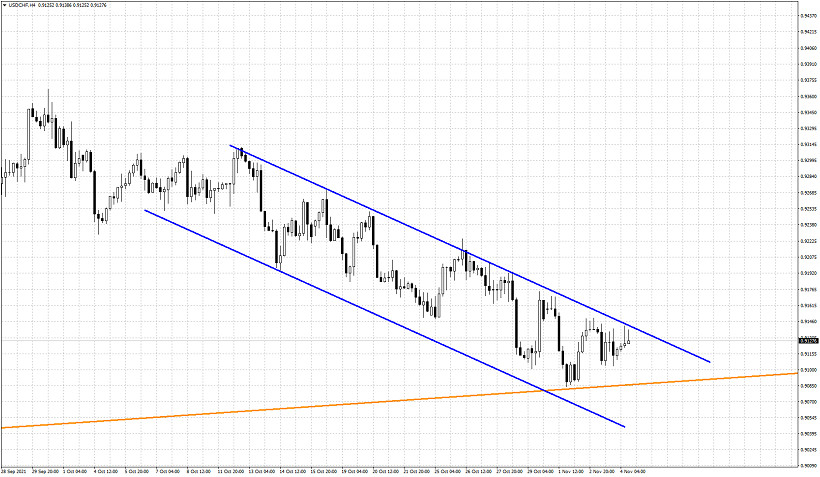
| USDCHF remains inside bearish channel Posted: 04 Nov 2021 06:23 AM PDT In our previous analysis on USDCHF we noted the increased chances of an upward reversal. Price is very close to important long-term support trend line but also remains inside the bearish channel.
Orange line - support USDCHF continues making lower lows and lower highs. The last couple of days USDCHF is challenging the upper channel boundary resistance around 0.9150-0.9140. As long as price is below this level trend is controlled by bears. However I believe it is time for an upward break out. Price today got rejected once again at the channel resistance, confirming the importance of the resistance at 0.9150. Support is at 0.9080-0.91. Holding above this area is key for the short-term trend at least. The material has been provided by InstaForex Company - www.instaforex.com |
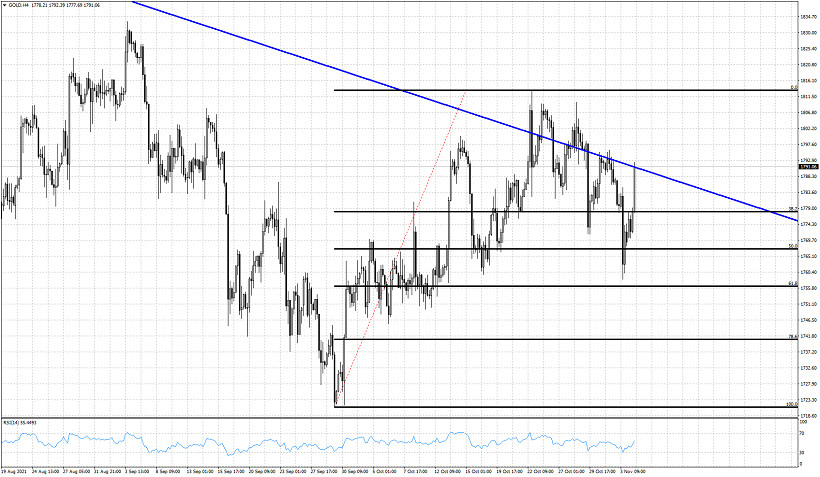
| Gold challenges major resistance trend line once again. Posted: 04 Nov 2021 06:17 AM PDT Gold price has made a reversal to the upside from the $1,758 low that we saw yesterday. Price is now challenging the resistance trend line that has produced recently many rejections and bearish reversals. Gold price reached very close to the 61.8% Fibonacci retracement and our first target area.
Blue line- resistance trend line Black lines - Fibonacci retracements As we mentioned in yesterday's analysis, our first target was at the 61.8% retracement and the $1,756 level. Price reached very close to that area and reversed strongly to the upside. Price is challenging the blue trend line. Another rejection here would be a new bearish signal. If bulls manage to recapture $1,795 and stay above it, this would be a sign of strength. Our view remains bearish as we mentioned yesterday as long as price is below $1,809. The material has been provided by InstaForex Company - www.instaforex.com |
| Video market update for November 04,2021 Posted: 04 Nov 2021 06:10 AM PDT Watch for continuational patterns... The material has been provided by InstaForex Company - www.instaforex.com |
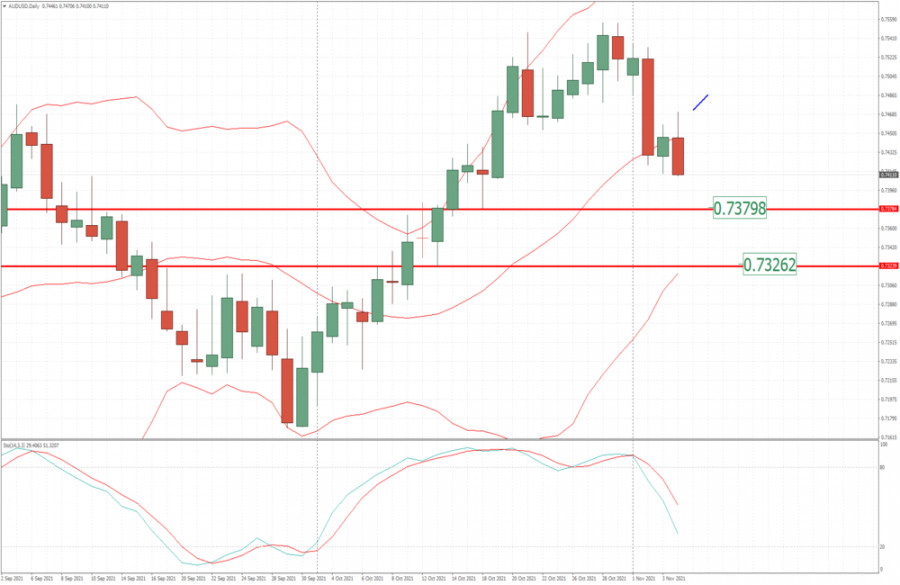
| AUD/USD - Strong downside pressure and potential for bigger drop Posted: 04 Nov 2021 06:09 AM PDT Technical analysis:
AUD/USD has been trading downside and we got bearish outside bar on the market. Trading recommendation: Watch for selling opportunities on the rallies due to strong downside momentum. Downside targets are set at the price of 0,7380 and 0,7325 Stochastic is showing-bear cross and strong downside condition, which is confirmation for further bearish movement. Resistance is set at the price of 0,7470 The material has been provided by InstaForex Company - www.instaforex.com |


| You are subscribed to email updates from Forex analysis review. To stop receiving these emails, you may unsubscribe now. | Email delivery powered by Google |
| Google, 1600 Amphitheatre Parkway, Mountain View, CA 94043, United States | |


Comments