Forex analysis review
Forex analysis review |
- Short-term analysis on EURUSD for November 5, 2021.
- Bitcoin vulnerable to a move towards $54,000
- Fake breakout in USDCHF.
- Ichimoku cloud indicator analysis on Gold for November 5, 2021.
- Bitcoin Breaks Into US Politics: New York Mayor Eric Adams and Miami Mayor Francis Suarez Receive Bitcoin Salaries
- EUR/USD: "Green" Nonfarm Payrolls allowed the approach to the borders of the 14th figure
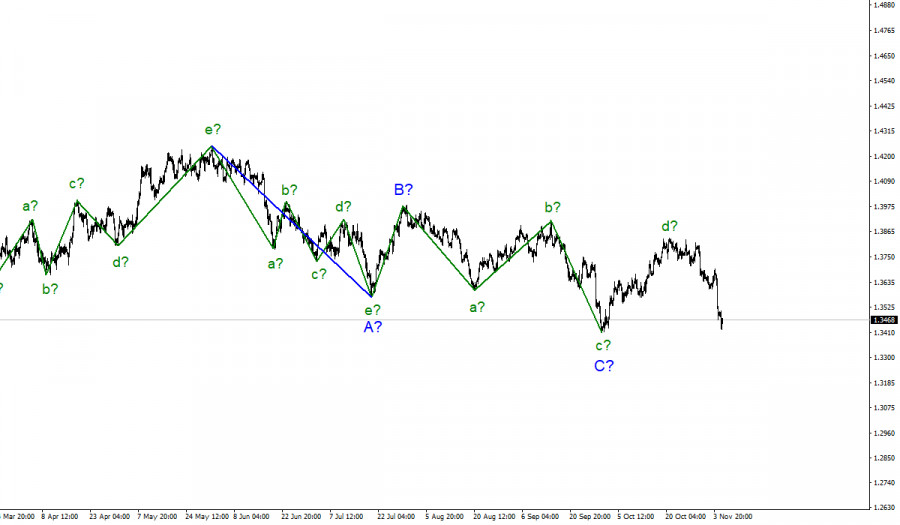
- Wave analysis of GBP/USD for November 5; Pound fell 300 pips and remains in a bearish tone
- Bitcoin rallies due to inflation and the Fed
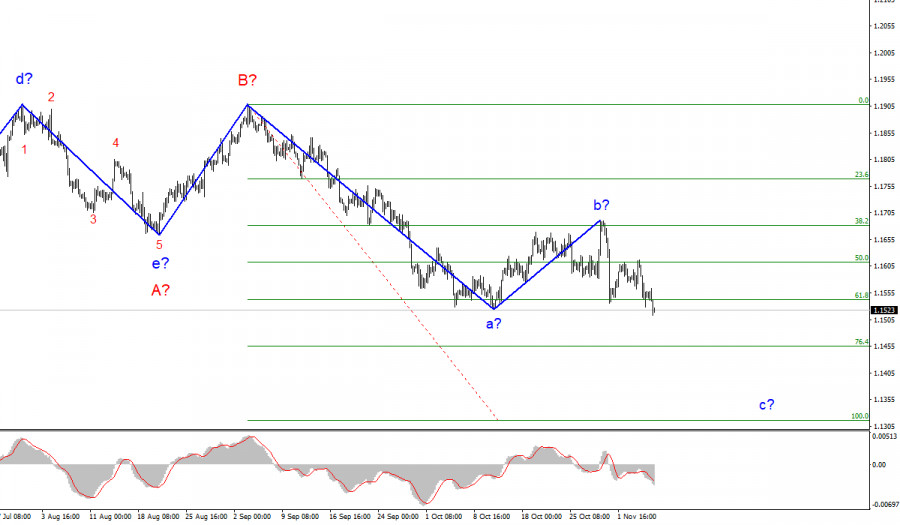
- Wave analysis of EUR/USD for November 5; US dollar received support from positive Nonfarm Payrolls report
- Bitcoin Spot ETF Will Bring Multi-Billion Dollar Investment And Kill Competition With Gold
- November 5, 2021 : EUR/USD Intraday technical analysis and trading plan.
- November 5, 2021 : EUR/USD daily technical review and trading opportunities.
- November 5, 2021 : GBP/USD Intraday technical analysis and significant key-levels.
- Trading signal for Ethereum (ETH) on November 05 - 08, 2021: sell below 4,527 (SMA21)
- Solana hits $250, breaks historic record amid ecosystem development: will the coin continue to move towards new highs?
- Trading signal for USD/JPY on November 05 - 08, 2021: sell below 113.84 (SMA 21)
- Video market update for November 05,2021
- Elon Musk's favorite Shiba Inu crashes more than 20%, plight of cryptocurrency continues. 0 ahead ?
- Trading signal for GBP/USD on November 05 - 08, 2021: buy above 1.3427 (6/8)
- Main US indices show mostly growth
- Analysis of Gold for November 05,.2021 - Key resistance zone on the test
- BTC analysis for November 05,.2021 - Higher lows with uipside breakout in the background
- EUR/USD analysis for November 05, 2021 - Strong downside pressure and potential for bigger drop
- GBP/USD: the plan for the American session on November 5 (analysis of morning deals). The pound has fallen to the next lows
- EUR/USD: the plan for the American session on November 5 (analysis of morning deals). A great signal to sell the euro
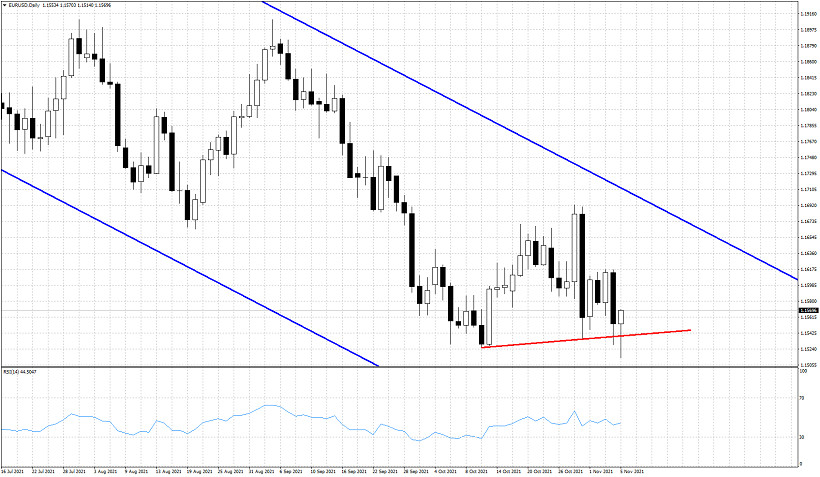
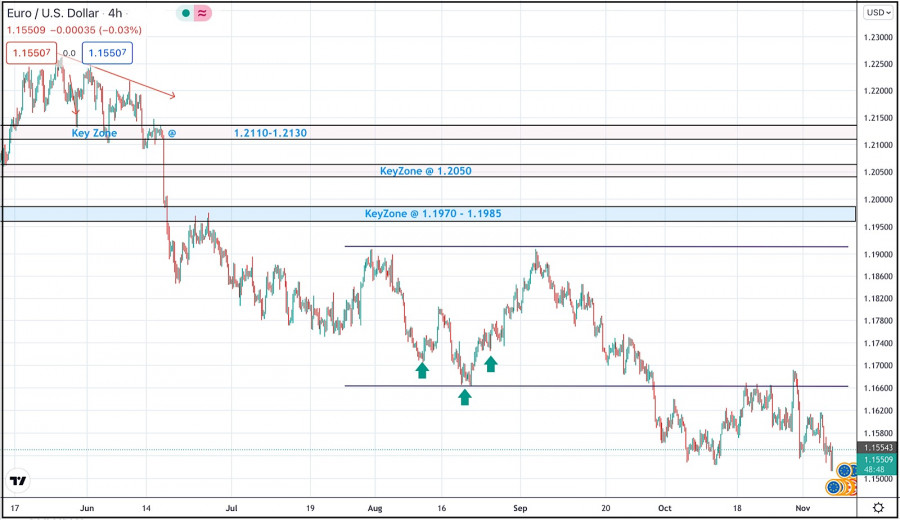
| Short-term analysis on EURUSD for November 5, 2021. Posted: 05 Nov 2021 02:05 PM PDT EURUSD made a new lower low today at 1.1514. Price broke below the horizontal support level but only briefly, as the Daily candlestick reversed and price is now well above the horizontal support.
Red line - horizontal support EURUSD is showing reversal signs. Price made a new low but the RSI did not. The RSI is providing a bullish divergence. Price tested 1.1515-1.1530 area twice and both times price reversed and did not close below 1.1530. These are signs of an imminent trend reversal. Most probable bounce target is the upper channel boundary at 1.17. For now we focus on the 1st important resistance which is at 1.1620. The material has been provided by InstaForex Company - www.instaforex.com |
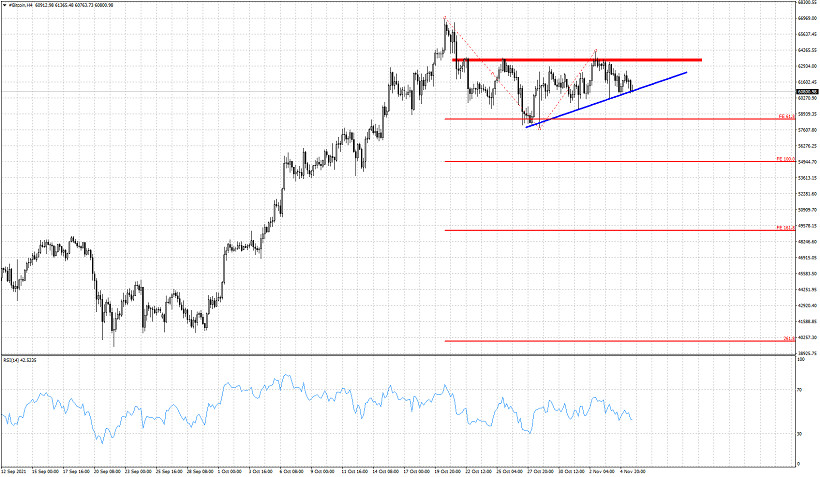
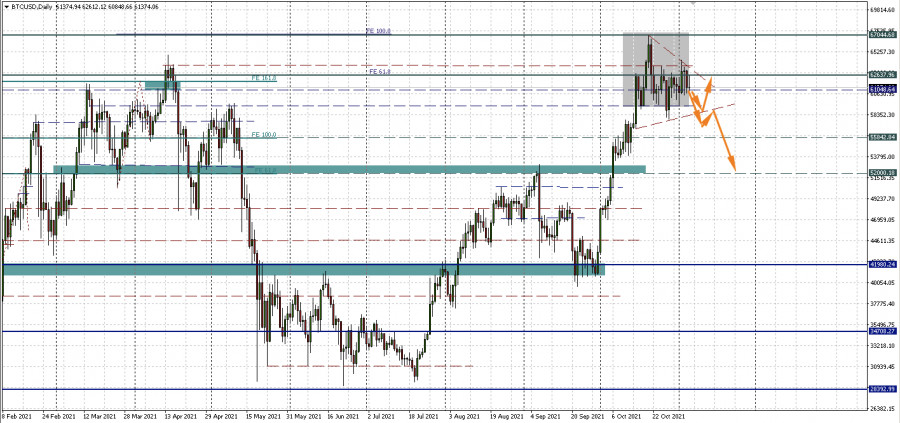
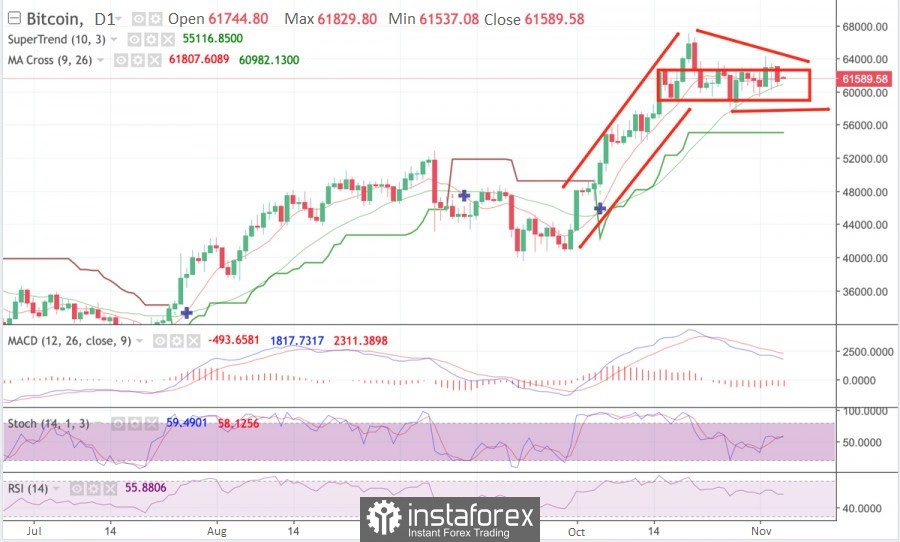
| Bitcoin vulnerable to a move towards $54,000 Posted: 05 Nov 2021 01:59 PM PDT Bitcoin recently got rejected at the horizontal resistance at $63,500 and is now challenging the short-term support at $60,500. Bitcoin has the potential for another pull back towards $54,000, similar to the decline from $66,900 to $57,000.
Red rectangle -horizontal resistance Red lines - Fibonacci extension targets Blue line- short-term support Bitcoin is trading around $60,800. Price has made no real progress over the last couple of days. In order for Bitcoin to continue to new all time highs, bulls will need to recapture the $63,500 level and stay above it. On the other hand, price seems vulnerable to a pull back towards $57,000 and lower. Price is now testing the short-term support trend line shown in blue in the chart above. Breaking below the support trend line will be a sign of weakness and I expect more downside to follow. The material has been provided by InstaForex Company - www.instaforex.com |
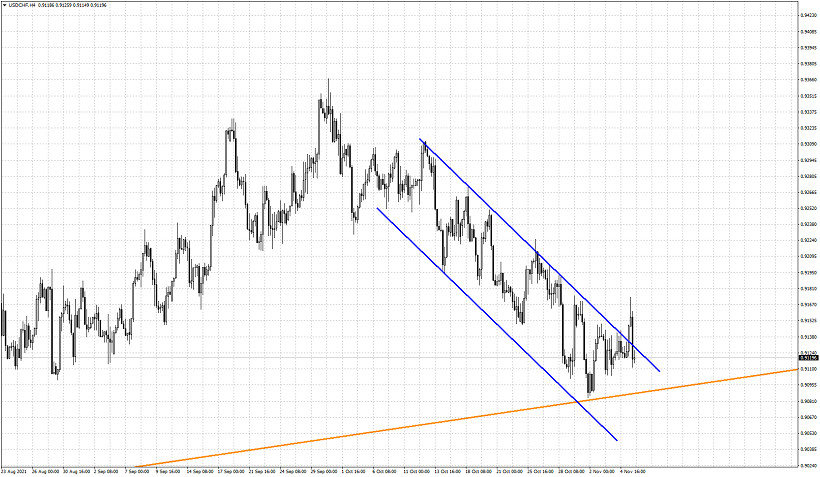
| Posted: 05 Nov 2021 01:50 PM PDT USDCHF had broken out of the bearish channel as expected earlier today but what was not expected was the reversal. Staying out of the bearish channel was only for a short while as price has made a strong reversal and is now back inside the bearish channel it was in, since beginning of October.
Blue lines - bearish channel Orange line - major support trend line USDCHF reversal today is not very promising for bulls. Of course bulls continue to hope for a reversal as long as price is above the major support trend line at 0.9080. It is important for bulls to recapture 0.9150 in order to regain control of the trend. Inability to do so, will be a sign of weakness and can lead USDCHF to making new lows below 0.9080. The material has been provided by InstaForex Company - www.instaforex.com |
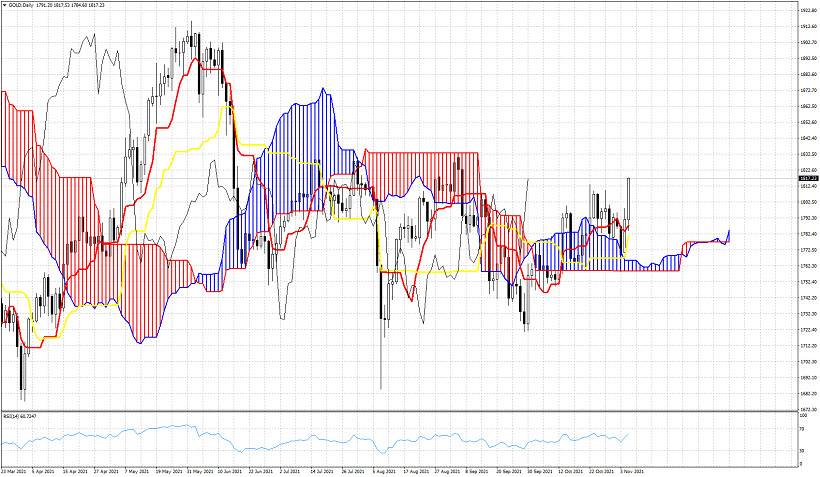
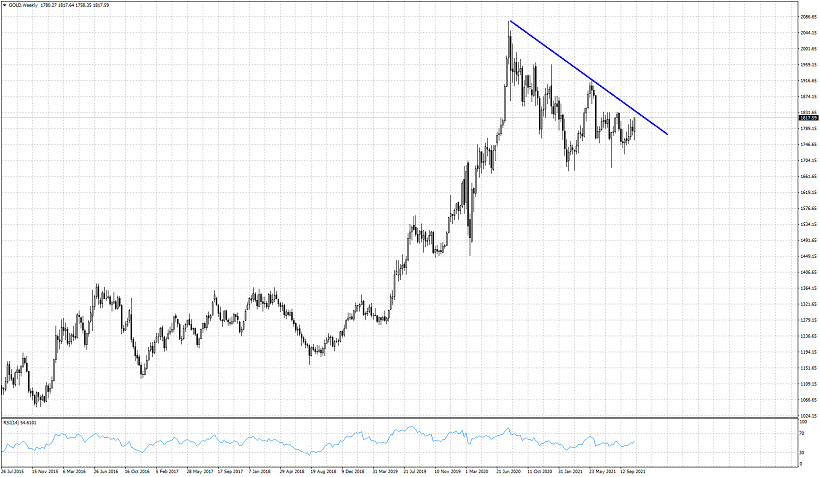
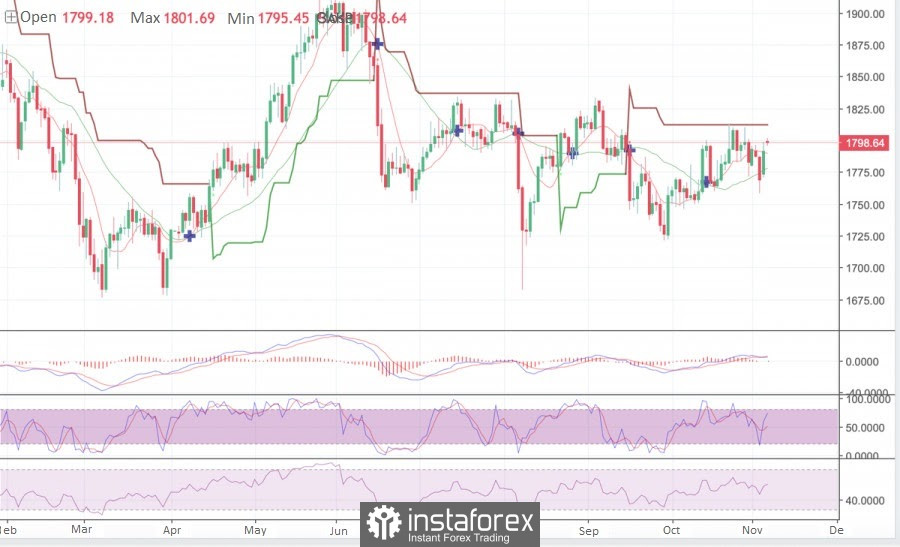
| Ichimoku cloud indicator analysis on Gold for November 5, 2021. Posted: 05 Nov 2021 01:46 PM PDT Gold price is breaking out today making new highs and providing a short-term bullish reversal signal. Price is in a bullish trend as price has bounced off the cloud support and is now trading above both the tenkan-sen and kijun-sen indicators on a Daily basis.
Concluding, Gold bulls are in control of the short-term trend and the precious metal has the potential to provide a new stronger bullish signal of the coming weeks by breaking above the blue resistance trend line coming from its all time highs. Support remains key at $1,750-60. The material has been provided by InstaForex Company - www.instaforex.com |
| Posted: 05 Nov 2021 12:11 PM PDT
New York City Mayor-elect Eric Adams told his constituents that he plans to receive his first three salaries as New York City Mayor in Bitcoin. The new mayor of New York is confident that Bitcoin is the future, he wants to make New York the center of cryptocurrency and digital finance. Adams supports the baton started by Miami Mayor Francis Suarez, who is ready to receive his salary in Bitcoin. Adams took this to Twitter and said: "New York is a city for advanced and modern citizens. We are always ready to move towards global innovation, digitalization, and great success, so I am ready to receive my first three salaries in Bitcoin. New York will now become a mecca for fast-growing, innovative industries." Miami Mayor Francis Suarez was a pioneer in US politics who is fully prepared to receive his salary in Bitcoin. Suarez is confident he can make Miami a digital city. Eric Adams is due to take over as mayor of New York on January 1, and it is not yet entirely clear how he will receive his salary in bitcoin at the legislative level, so a special expert group will be assembled to resolve this issue, which will deal with this issue. This is very big news for the entire crypto market, if such world centers as New York and Miami give the green light to Bitcoin, then everything can begin to scale after them. After Bill de Blasio leaves office, Eric Adams wants to make the city not anti-business, but crypto-directed and digitalized. Adams loves the competition between Miami and New York, and he is pleased that cities like these are giving the green light to crypto technology. However, New York Attorney General Laetitia James can put a spoke in his wheels. She has previously begun to take serious reprisals against unregistered cryptocurrency companies in New York, James also submitted her candidacy for the governor of New York. Miami also began to develop at an even more accelerated pace after Mayor Suarez accepted his Bitcoin salary. Miami hosted the largest cryptocurrency conference, Miami Coin, and the city received over $7 million. Anthony Pompliano became like water, and earlier said that American politicians should accept payments in cryptocurrency. The material has been provided by InstaForex Company - www.instaforex.com |
| EUR/USD: "Green" Nonfarm Payrolls allowed the approach to the borders of the 14th figure Posted: 05 Nov 2021 11:51 AM PDT The US dollar continues its triumphant march throughout the market. The October Nonfarm Payrolls report, which was published at the start of the American session on Friday, only fueled interest in the greenback. After a long exhausting siege, the EUR/USD bears finally broke through the resistance level of 1.1530 (the price minimum of the year, which coincided with the lower line of the Bollinger Bands indicator on the daily chart) and headed to the base of the 15th figure. The last time the pair was at such lows was more than a year ago - in July 2020. Sellers of EUR/USD tried to change the price echelon in order to settle within the 14th price level, but the first blitzkrieg attempt failed. Now the bears need to keep the price below the level of 1.1530, which has been acting as a price citadel for almost two months. Otherwise, the pair will drift again in the range of 1.1530-1.1600.
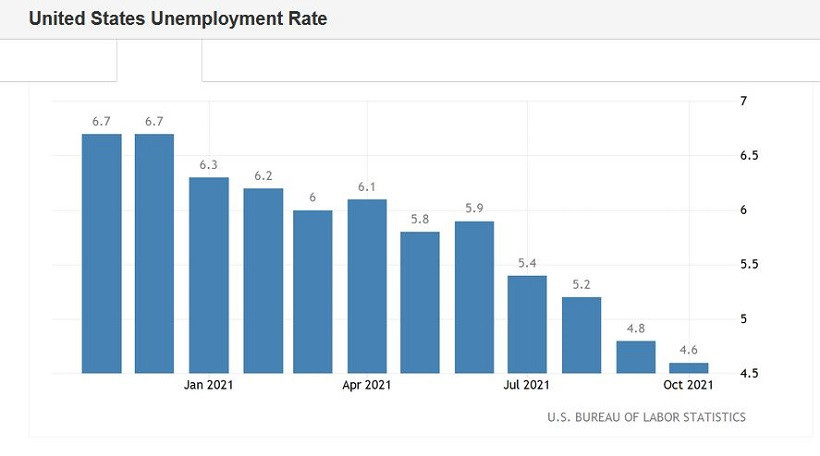
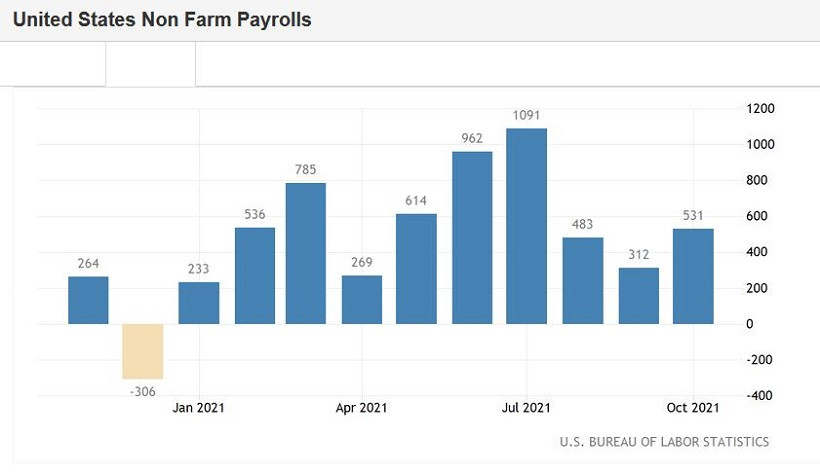
It is noteworthy that the US dollar sharply strengthened its positions literally the day after the announcement of the results of the November Fed meeting, which turned out to be not as hawkish as expected. The Fed announced the tapering of QE (which was very predictable) and denied rumors that the regulator intends to start tightening monetary policy in the middle of next year. Federal Reserve Chairman Jerome Powell clearly hinted that the start of a QE tapering is not a signal that the Central Bank will raise the rate soon. Also, the head of the Fed once again repeated the message that the increase in inflation is temporary, and, therefore, the regulator does not need to stop this growth by tightening the parameters of monetary policy. Against the background of such rhetoric, the EUR/USD pair demonstrated a corrective growth, which safely "stalled" as soon as the price crossed the 1.1600 mark. The very next day after the announcement of the results of the November meeting, the dollar began to actively gain momentum throughout the market. What caused the dollar rally? There is no consensus among experts on this matter, but most of them are inclined to think that the market "did not believe" the Fed. First of all, I didn't believe that the regulator would be able to demonstrate patience next year, calmly observing the growth of inflation. Therefore, the markets are still pricing in at least one rate hike in 2022, while many currency strategists are confident that the Central Bank will return to this issue twice - next summer and in November-December. Agreeing with this thesis, I can only add that to some extent, dollar bulls were restrained by concerns about possible stagflation - the growth of inflationary indicators against the background of a slowdown in other macroeconomic indicators, primarily in the labor market. That is why weak data on US GDP growth undermined the position of the greenback and that is why the October Nonfarm Payrolls provided it with such support. The release laid the basis for further strengthening of the dollar, as it reduced the risks of a stagflationary scenario. By and large, participants received a very categorical message on Friday which allowed us to draw a certain conclusion of an equally categorical nature. And this conclusion boils down to the fact that the time interval between the completion of the QE tapering (July 2022) and the first round of rate hikes will be quite short (if at all). And this interval will be reduced as the American labor market recovers and inflation continues to rise. So, all the components of Friday's Nonfarm Payrolls report came out in the "green zone." The number of people employed in the non-agricultural sector increased by 531,000 – this is the strongest growth rate since July of this year. The unemployment rate dropped to 4.6% (the best result since April 2020). The growth rates of salaries did not disappoint either. Friday's figures (0.4% MoM and 4.9% YoY) complemented the good dynamics of the increase in the number of people employed in the non-agricultural sector. In the private sector of the economy, the indicator also showed strong dynamics – an increase of 604,000 with a growth forecast of 400,000. The number of people employed in the manufacturing sector of the economy immediately increased by 60,000 (the forecast was at the level of 22,000). Note that following the results of the November meeting, the members of the Federal Reserve said that by the middle of next year, the requirement of full employment "can be fulfilled." The trends announced suggest that this scenario will be implemented ahead of schedule.
It is difficult for the European currency to oppose anything to the greenback. Following the results of the last meeting, the European Central Bank only intensified its "dovish" rhetoric, putting pressure on the euro. The timid assumptions of some analysts that the ECB may shift the expected timing of a rate hike at least to 2023 did not materialize. ECB President Christine Lagarde continues to "hold the line" - both regarding QE and the interest rate issue. All this suggests that the EUR/USD pair will continue to be under background pressure. Corrective pullbacks are not excluded (including large-scale ones), but the euro will not be able to reverse the trend for the pair in the foreseeable future. Therefore, it is advisable to use any corrective bursts to open short positions. For example, Friday's downside impulse has faded away when approaching the psychologically important key mark of 1.1500. Ahead of the weekend, traders began to fix profits en masse, thereby "deploying" the pair. At the same time, downside prospects remain a priority: when approaching the 1.1600 mark (the middle line of the Bollinger Bands indicator on the daily chart), you can consider selling the pair with a target of 1.1530 (the lower line of the Bollinger Bands on the same timeframe). The material has been provided by InstaForex Company - www.instaforex.com |
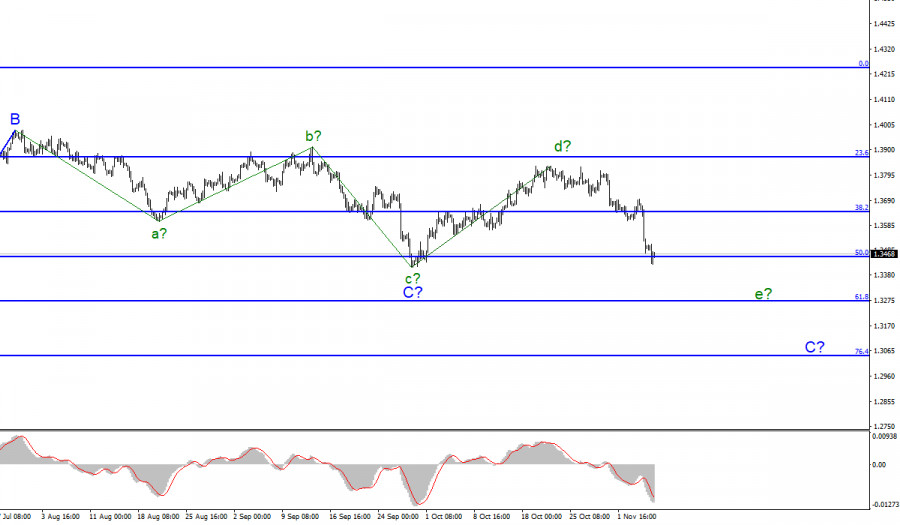
| Wave analysis of GBP/USD for November 5; Pound fell 300 pips and remains in a bearish tone Posted: 05 Nov 2021 11:27 AM PDT |
| Bitcoin rallies due to inflation and the Fed Posted: 05 Nov 2021 11:12 AM PDT Many people have been talking about this lately, including JP Morgan. And today this relationship was confirmed by billionaire Peter Thiel. In light of the recent rally of the main cryptocurrency and its current trading near $60,000, he is pessimistic about the prospects for the global economy. While the Fed condones inflation, investors are going to Bitcoin Thiel rebukes the Fed for not coping well with a problem that could snowball into a larger crisis. The growing threat of inflation has been cited more than once as the reason for the significant adoption of cryptocurrency in 2021. The founder of Paypal believes that the global economy is already knee-deep in crisis, and this is especially striking when you look at the recent BTC prices. Is it all about the Fed? Thiel, whose statements we will consider as bitcoin continues to technically decline in the triangle, largely blames the American Central Bank. The investor believes that the Fed is in a "closed" state as a result of its seemingly narrow-minded approach to this issue. There have been a lot of criticisms lately from cryptocurrency enthusiasts for allegedly printing money "without limits," especially with the proposed $2 trillion stimulus package. The inflationary implications of such a move are already being discussed in cryptocurrency circles. "Canary in the coal mine" This is what Thiel recently called Bitcoin, explaining that its price is a good indicator of what is happening in the economy now. If investors are fleeing traditional assets and even gold, then things are not going well. Does this mean that as soon as the Fed starts raising rates, Bitcoin will fall? I think you shouldn't get ahead of yourself so much because it is unlikely to happen quickly. The American central bank, like many others, is likely to fail to curb inflation quickly. On Wednesday, the Fed began to taper QE. However, Fed Chair Jerome Powell spoke very carefully about the rate hike. And the Bank of England on Thursday did not raise the rate, despite the off-scale inflationary pressure. According to October data, the annual inflation rate in the United States reached 5.4%. In 2020, the average inflation rate was fixed at 1.2%. Given the current caution of world central banks in tightening monetary policy due to the employment situation, prices will continue to rise for a long time. At the same time, the emergence of new instruments such as Bitcoin ETFs will intensify the flight into digital assets. Don't forget the side triangle Meanwhile, the technical benchmarks for BTCUSD have not changed. The hypothetical triangle and the consolidation range 59,383.67 - 62,637.96 inside it are still relevant. There is still a reserve of motion to the lower boundaries of the figures, and, possibly, after the weekend, there will be more clarity on the issue of the further medium-term direction of the main cryptocurrency.
|
| Posted: 05 Nov 2021 11:00 AM PDT |
| Bitcoin Spot ETF Will Bring Multi-Billion Dollar Investment And Kill Competition With Gold Posted: 05 Nov 2021 09:52 AM PDT While bitcoin is resuming the consolidation period interrupted by the results of the Fed meeting, extremely encouraging theses about the future of the first cryptocurrency are being heard within the framework of the large-scale Bloomberg Financial Innovation investment forum. In the near future, Bitcoin may finally end competition with gold, protect against inflation and multiply its capitalization. The main stumbling blocks on the way to this are the SEC and the Bitcoin spot ETF. The need to launch this product became one of the main theses of the last summit. Despite the record performance of the futures fund, the market is hungry for more. And taking into account the tapering of the stimulus program, Bitcoin needs a new powerful source of investment. MicroStrategy CEO Michael Saylor is confident that the launch of a spot exchange-traded fund on the first digital asset will lead to trillion-dollar investments and the complete absorption of precious metals, especially gold. According to Saylor, the ETF will become a new stage in the development of the digital asset market and will significantly increase the attractiveness of Bitcoin as a means of protection against inflation. He also stressed that the spot ETF is the way to the final stage of institutionalization of cryptocurrencies among traditional representatives of large capital.
As of November 5, the SEC commissioners have more than ten applications on the table to launch a full-fledged exchange-traded fund on bitcoin. In the information space, there are diametrically opposite rumors about the possible approval of the first application. There is an opinion that the spot fund will appear no earlier than 2022, and the main purpose of the SEC will be to approve a futures ETF on ETH. At the same time, the SEC postponed consideration of the next application to launch Bitcoin ETF to December 2021, which gives players hope for the launch of the fund by the end of 2021. The main reason for optimism is the fact that the regulator gave feedback and asked Grayscale to explain the mechanisms for changing the product to a spot ETF. However, it is most likely that a full-fledged fund will not be launched this year, since the SEC has already made its choice in favor of a futures fund, which is the lesser of the evils for the regulator. Having relieved the pressure, the state agency received a reprieve and reduced public pressure, and therefore the adoption of the fund's ETF on the spot market in 2021 is unlikely. Despite this, all forecasts indicate that the coin will reach at least $100k. As of November 5, bitcoin continues to trade in a narrow range of $60k-$64k, and despite the growth of investments among major players, the coin is in no hurry to break into the growth zone. Its price practically did not change over the past day and week, which indicates the continuation of the trend of fluctuations in the current range. In addition, in order to maintain and implement a healthy bullish momentum, the coin needs to collect liquidity from the dangerous range of $53k-$58k, where a trend reversal may occur. Despite this, the confident purchase of investors at these levels will allow Bitcoin to significantly add stability and form powerful pools of purchases outside the range of fluctuations. On the daily chart, Bitcoin is confidently entering the consolidation phase, but narrowing occurs and soon an upward trend or an aggravation of the correction may begin. The coin was moving through the resistance zone, but its bullish or bearish breakdown may occur soon. Most likely, the price will continue to decline within the current range, but the strength of the bears is not enough to make an exit through the lower boundary of the area. Technical indicators also signal the uncertainty of the trend, which indicates the continuation of the flat movement: the MACD is steadily going down, but the stochastic retains a local bullish mood. The relative strength index is already starting to move sideways, which indicates a lack of initiative on the part of the players.
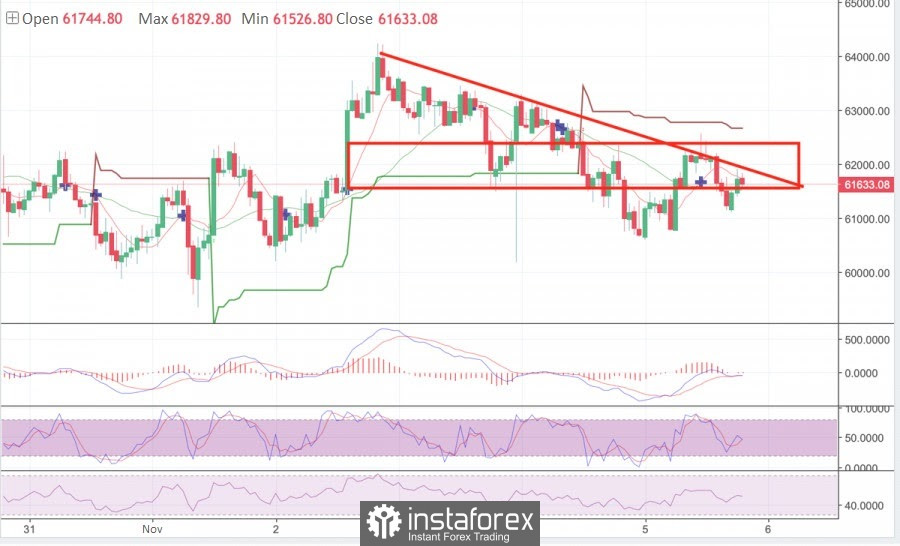
On a narrower timeframe, the situation stabilizes, albeit within the framework of a local downward trend. In addition, the price is still moving under the supertrend line, which indicates the sellers' advantage. During the current day, buyers returned to the usual narrow range of $61.2k-$62.2k, but the price rested on the upper limits of the resistance area. The technical picture is as uncertain as on the daily chart, which indicates weak audience activity at this stage. The MACD is moving below the zero mark with no claims for growth, and the stochastic is close to forming a bearish intersection, which indicates an aggravation of pressure from sellers. Following the results of Friday, buyers tried to go beyond the local range of fluctuations in order to continue pushing prices to the upper limit of a wide consolidation range, but they ran into the sales shelf. Therefore, the price will continue to plow the expanses of the local corridor, without leaving which the development of the upper part of a wide area is impossible.
|
| November 5, 2021 : EUR/USD Intraday technical analysis and trading plan. Posted: 05 Nov 2021 09:26 AM PDT
Bearish persistence below the price zone of 1.2050-1.2000 allowed the recent downtrend to be established. So, the EURUSD pair has expressed significant bearish decline while the price level of 1.1650 stood as a prominent demand level that prevented further bearish decline. The bullish pressure that originated around 1.1650 failed to push higher than the price level of 1.1900. That's why, another bearish pullback towards 1.1650 was executed. Bullish signs were expected around the price levels of 1.1650-1.1700 as it corresponded to a recent previous bottom. However, extensive bearish decline has pushed the EURUSD pair towards 1.1600 and lower levels was about to be reached if sufficient bearish momentum was maintained. Moreover, significant bullish recovery has originated recently upon testing the price level of 1.1570. The recent bullish pullback towards 1.1650-1.1680 was expected to offer bearish rejection and a valid SELL Entry. Significant bearish decline brought the EURUSD pair again towards 1.1550 levels which still stands as an Intraday Support zone. Hence, sideway movement maybe expected in the nearest future. Please note that any Bullish movement above 1.1680 should be considered as an early exit signal to offset any SELL trades. The material has been provided by InstaForex Company - www.instaforex.com |
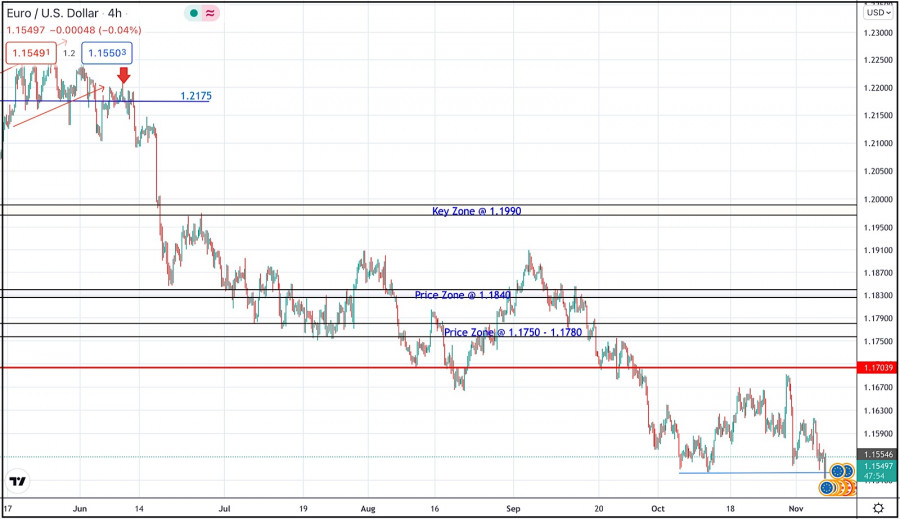
| November 5, 2021 : EUR/USD daily technical review and trading opportunities. Posted: 05 Nov 2021 09:25 AM PDT
Recently, Persistence below the depicted price zone of 1.1990 indicated further downside movement towards 1.1840 and 1.1780 where a sideway consolidation range was established. During last week, the EURUSD pair has been trapped within a narrow consolidation range between the price levels of 1.1780 and 1.1840. A bullish breakout was executed above 1.1840 shortly after. Temporary Upside pullback was expected towards 1.1990. However, re-closure below the price level of 1.1840 has initiated another downside movement towards 1.1780 which failed to hold prices for a short period of time before significant upside movement was presented into market. Intraday traders were advised to wait for candlestick closure above 1.1780 - 1.1840 for another ascending swing to be initiated. However, immediate downside selling pressure brought the pair down below 1.1700. More downside movement took place towards the price level of 1.1600 where significant buying pressure existed. Bearish persistence below 1.1700 and 1.1600 has enhanced further decline towards 1.1500. Currently, the price zone around 1.1700 stands as a prominent supply-zone to be watched for SELLING pressure and a possible SELL Entry upon any upcoming ascending movement. The material has been provided by InstaForex Company - www.instaforex.com |
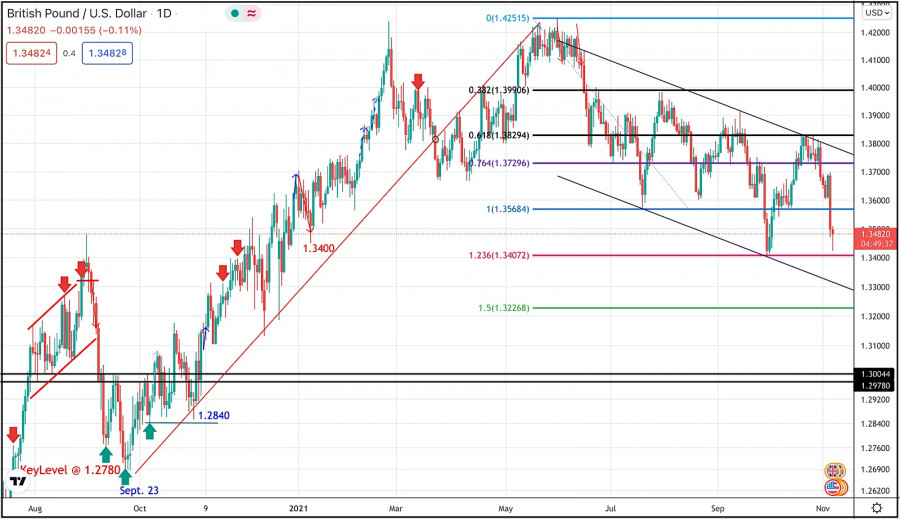
| November 5, 2021 : GBP/USD Intraday technical analysis and significant key-levels. Posted: 05 Nov 2021 09:24 AM PDT
The GBPUSD pair has been moving sideways with some bearish tendency while bearish breakout below 1.3600 was needed to enhance further bearish decline. On the other hand, the nearest SUPPLY level was located around 1.4000 where bearish rejection and a valid SELL Entry was anticipated. The recent bullish rejection witnessed around 1.3600 as well as the temporary bullish breakout above 1.3830 indicated a high probability that this bullish movement may pursue towards 1.4025 then 1.4100. However, the pair remained trapped within a fixed price range until significant bearish momentum emerged into the market. Bearish breakout below 1.3680 enabled further bearish decline towards 1.3400 which corresponded to 123% Fibonacci Level of the most recent bearish movement. This was a good entry level for a corrective bullish pullback towards 1.3650 and 1.3720 which was temporarily bypassed. Recently, the pair was testing the resistance zone around 1.3830 where bearish pressure originiated into the market. Currently, the short-term outlook is bearish as long as the pair maintains its movement below 1.3730. Another bearish visit was expected towards 1.3570 and probably 1.3400 as they correspond to significant Fibonacci Expansion Levels. The material has been provided by InstaForex Company - www.instaforex.com |
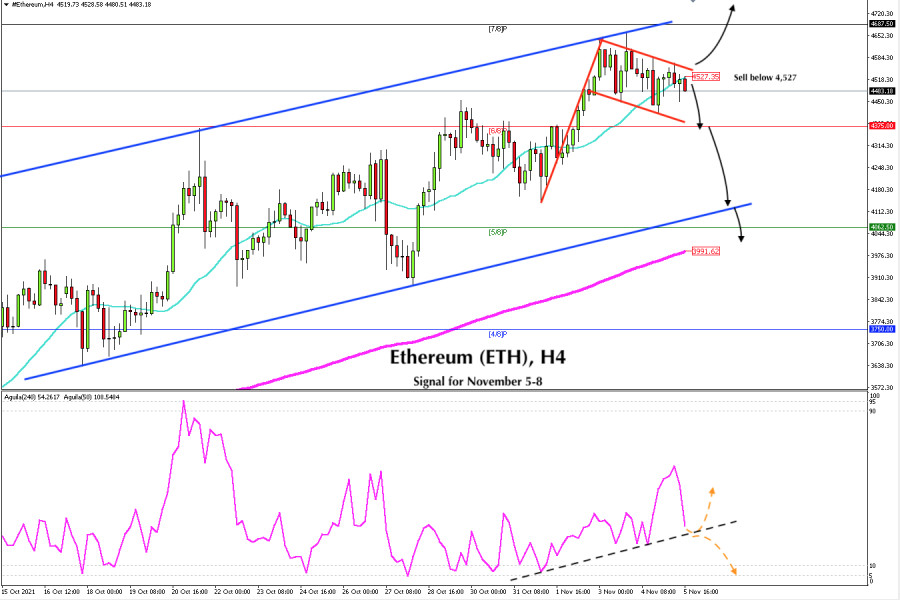
| Trading signal for Ethereum (ETH) on November 05 - 08, 2021: sell below 4,527 (SMA21) Posted: 05 Nov 2021 08:46 AM PDT
Since November 3, Ether has been consolidating and forming a bullish pennant technical pattern. This technical figure is a sign of a probable strong bullish move that could push ETH to the psychological level of 5,000 in the next few days. On the contrary, as Ethereum consolidates below the 21 SMA, it is likely to continue the correction movement and could eventually weaken to the support of 6/8 murray around 4,375. A sharp break and a daily close below this support zone could accelerate the decline to the 200 EMA around 3,991. The optimism and euphoria of the cryptocurrency market faded when on November 4, US Federal Reserve Chairman Jerome Powell confirmed that the central bank would begin to reduce its monetary stimulus, So, the regulator will scale back its bond purchases by $15 billion per month. Investors seems to be unwilling to buy EHT above the all-time high of $ 4,665. On the contrary, we believe that as long as EHT remains below the strong resistance of the 21 SMA (4,527), the crypto could continue oscillating and make a technical correction with the aim of accumulating more sellers. ETH could fall to the support of the uptrend channel around 4,120 or 5/8 murray at 4,062. This zone is a psychological level, giving us an opportunity to buy ETH again. Our trading idea for the next few hours is to watch the key level of 4,527. Below this level, ETH is likely to continue its decline. So, we will have an opportunity to sell with targets at 4,375 and up to 4,125. Conversely, if ETH makes a sharp breakout and confirms the bullish pennant pattern, it will be an opportunity to buy above 4,560 with targets up to 7/8 murray around 4,687 and up to the psychological level of $ 5,000. Support and Resistance Levels for November 05 - 08, 2021 Resistance (3) 4,687 Resistance (2) 4,615 Resistance (1) 4,542 ---------------------------- Support (1) 4,418 Support (2) 4,375 Support (3) 4,316 *********************************************************** A trading tip for ETH for November 05 - 08, 2021 Sell below 4,527 (SMA 21) with take profit at 4,375 and 4,112 (bottom of uptrend channel), stop loss above 4,660. The material has been provided by InstaForex Company - www.instaforex.com |
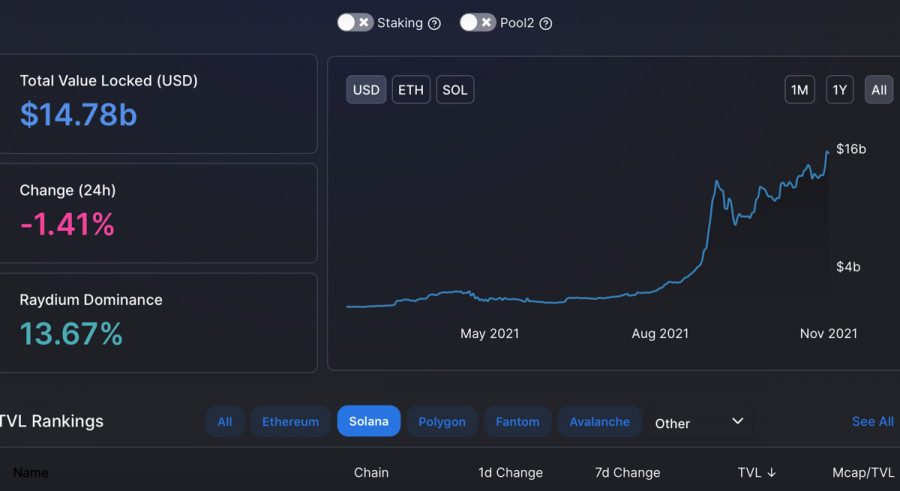
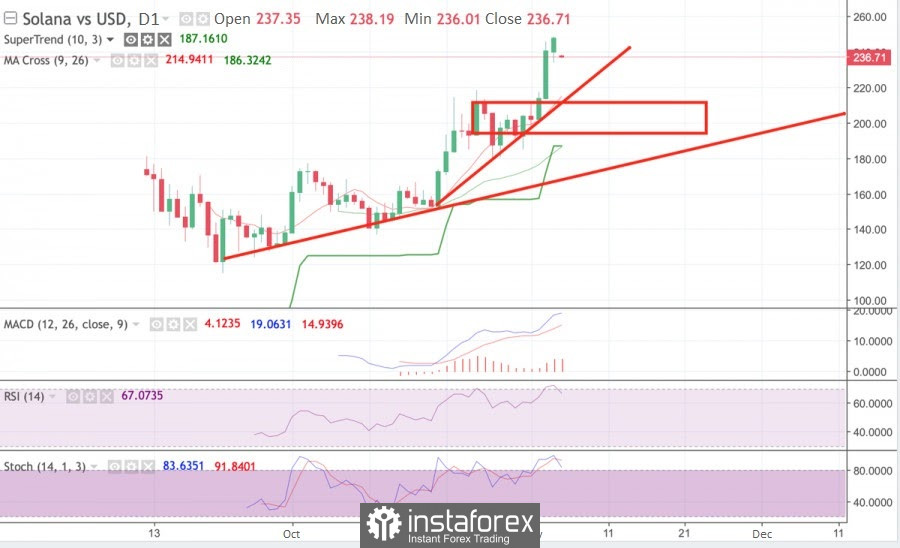
| Posted: 05 Nov 2021 08:17 AM PDT Solana has come a long way from recovering from a spam attack and a complete network shutdown to setting a new historical record. An important factor in such a rapid recovery of the coin's quotes was played by the pace of development of the altcoin ecosystem, which allowed attracting a new audience, investments, and improving reputation. As of November 5, the coin sank slightly in value due to the expected correction after a new record, and therefore the question arises: is the cryptocurrency able to continue the upward movement and update the absolute maximum within the current window for the altcoin market? As of 11:00 UTC, the altcoin is quoted at around $237, having risen in price by 21% over the week. Now the coin is prone to decline due to overheating that occurred during the establishment of the historical record. The coin began a steady growth on October 20 and in less than a month updated the historical maximum at around $250. The main catalyst for the growth of quotes was the rapid growth of decentralized projects based on Solana. The new record value of the coin coincided with the renewal of record amounts of funds blocked in the DeFi projects of the SOL ecosystem, which reached $15 billion. The growth in the number of users, investments, and transactions in related projects positively influenced the price movement of the main coin, as well as on-chain indicators of unique addresses in the asset network and total transaction volumes, which set a local record shortly before reaching $250.
In addition, the Solana ecosystem has significantly strengthened in recent months as a competitor to ETH and DOT in terms of the attractiveness of the main network for hosting various projects. It is worth noting that both SOL and DOT took advantage of excessive commissions on the ether network, poaching promising projects and updating their historical highs. The main sponsor of ATH Solana was the cross-blockchain computing network and the DeFi index provider Aleph.im, which announced the launch of the Serum Markets solution for one of the largest DeFi protocols, Serum, running on Solana. Thanks to this, it was possible to significantly accelerate and systematize the huge data flow passing through the decentralized platform. The rapid development of the ecosystem and related projects allowed Solana to show how great is the potential of blockchain-derived products and the investment demand for them. Taking into account the big plans for the future outlined in the roadmap of the project, as well as the inclusion of the token in Grayscale Digital Large Cap Fund, there is no doubt that Solana will continue to grow in price and receive great investment opportunities due to the development of the DeFi sector. Meanwhile, on the daily chart, the coin formed a massive bullish candle, which indicates a confident dominance of the bulls but began to decline as part of a short-term correction following the formation of such a powerful pattern. The main technical indicators of the cryptocurrency are in the overbought zone, and therefore the current decline should be considered as price stabilization. The nearest key support zone for the price will be the $192-212 segment, from where a powerful breakdown to the historical maximum was made. A sharp rebound in the price and a further phase of consolidation in a narrow range can be expected in this area.
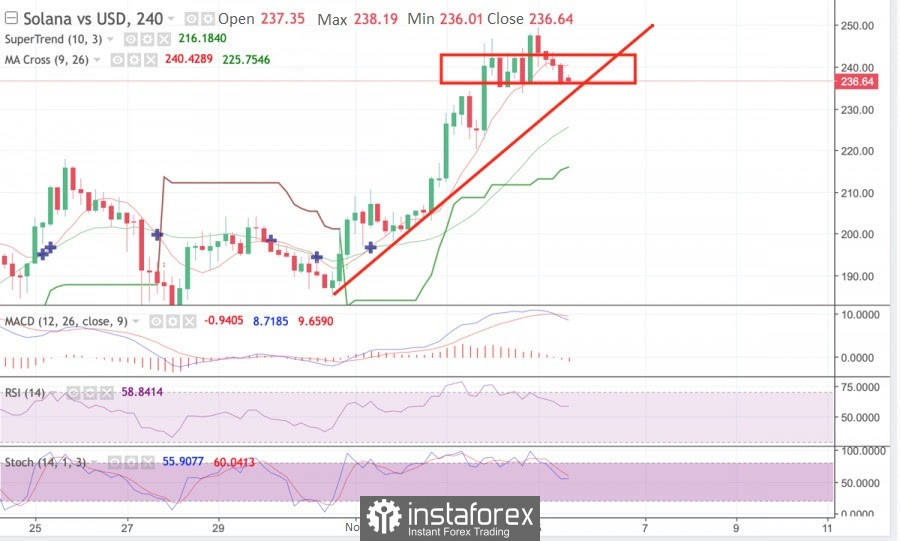
The four-hour timeframe signals the end of the fall and the continuation of the price movement within the consolidation period: the MACD has formed a bullish intersection but continues to move flat, and the stochastic oscillator and the relative strength index indicate the stabilization of the growth momentum and the start of the accumulation period. The chart also shows a false breakdown of the resistance zone of $235-$242, which ended with the setting of a record. However, now the coin has returned to this range with the strong support of bears, which push the price beyond this range. Taking into account the candle analysis, we can say that sellers have received additional volumes for pressure and most likely the price will leave the current range. In this case, the downward movement will continue to the local support zone at $232, where a rebound is most likely to occur, considering the recovery of technical charts indicating prerequisites for an impulsive upward movement. Taking all this into account, Solana is approaching a period of stabilization of quotes and further upward movement to new maximums.
|
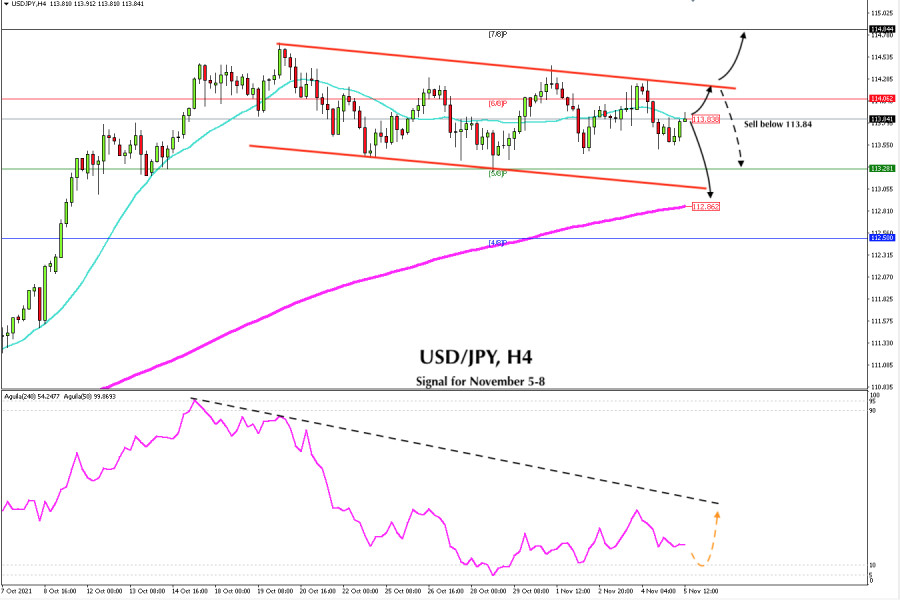
| Trading signal for USD/JPY on November 05 - 08, 2021: sell below 113.84 (SMA 21) Posted: 05 Nov 2021 07:56 AM PDT
Since October 18, USD/JPY has been oscillating within a downtrend channel. In the early hours of the American session before the publication of payroll (NFP), the pair is trading around 113.84 just at the same level of the SMA of 21. If the employment data in the United States is upbeat for the US dollar, USD/JPY is expected to decline to the support at 113.28 and to the 200 EMA around 112.86. The USD/JPY pair is consolidating within a range from 113.30 to 114.25. The swing movement is expected to continue for the next several days until it finds support at the 200 EMA, and then resumes its uptrend. According to the daily chart and the 4-hour chart, the Japanese yen has a strong upward trend. So, there is a good point to buy USD/JPY if it manages to make a correction in the area of 112.86. There is the EMA of 200 or 4 Murray / 8 around 112.50. This zone will be the key point for a new bullish wave targeting 114.06 and the price could rise to the psychological level of 115.00. The eagle indicator is approaching oversold levels. The pair is moving below a downtrend channel. We believe that if it hits the 10 to 5-point level, it could give the yen further bullish momentum. Meanwhile, it is now consolidating and showing a neutral signal. USD / JPY is likely to continue trading within the range levels between 114.25 and 13.28. Market sentiment report for today shows that there are 66.53% of operators who are buying the yen. This is a positive sign and it is likely that in the next few days we will see a drop to the level of 112.35 (EMA 200). On the contrary, if this figure decreases, we could see a rise in USD / JPY and the pair could reach the level of 114.84 (7/8). Our trading idea is to sell below the SMA of 21 located at 113.84, with targets at 113.45 and up to 113.28 (5/8). If a pullback occurs towards the top of the downtrend channel, it will also be an opportunity to sell. Support and Resistance Levels for November 05 - 08, 2021 Resistance (3) 114.52 Resistance (2) 114.06 Resistance (1) 113.88 ---------------------------- Support (1) 113.46 Support (2) 113.28 Support (3) 113.07 *********************************************************** A trading tip for USD/JPY for November 05 - 08, 2021 Sell below 113.84 (SMA 21) with take profit at 113.46 and 113.28 (5/8), stop loss above 114.25. The material has been provided by InstaForex Company - www.instaforex.com |
| Video market update for November 05,2021 Posted: 05 Nov 2021 07:54 AM PDT |
| Elon Musk's favorite Shiba Inu crashes more than 20%, plight of cryptocurrency continues. 0 ahead ? Posted: 05 Nov 2021 07:15 AM PDT Shiba Inu (SHIB) has fallen by 23% during Thursday's trading, coming in near the low of $0.000043 and dropping out of the top ten cryptocurrencies. Notably, in late October SHIB performed a spectacular rally largely due to short posts, which CEO of Tesla Ilon Musk left in his Twitter. So, on October 28, the altcoin hit all-time highs, climbing above $0.000088.
However, this week Shiba Inu began to demonstrate a downtrend, predicted by many crypto-experts. The dramatic fall of the coin occurred amid a large-scale dumping of the asset by major investors (whales), who forced the cryptocurrency up in October. For example, the day before, market whales sold SHIB in total of about $9.6 billion. Digital asset market analysts give some other reasons for the decline in the value of the meme coin. First, the weakness of the global crypto market. Secondly, active profit taking on the dog coin. Thus, according to the data of the cryptocurrency exchange Coinbase, published last week, the average holding time of Shiba Inu is only 11 days. Thirdly, the news that online broker Robinhood Markets Inc is not going to list the altcoin in the near future, which Shiba Inu fans have been waiting for a long time. Finally, the most terrible blow to the coin meme was the completely unexplained event last Tuesday, when the largest SHIB whale moved 40 trillion (about $3 billion) of assets to four different addresses, where they remain now. Some crypto market experts suggest that if the whale sells all the Shiba Inu coins it has, the cryptocurrency will lose about 99.99% in value and risk falling to almost zero. Amid the negative news, fans of the dog coin sounded the alarm and asked Amazon founder Jeff Bezos for assistance. The SHIB community requested the online company to accept altcoin as a payment method. However, analysts believe such a scenario is unlikely. The material has been provided by InstaForex Company - www.instaforex.com |
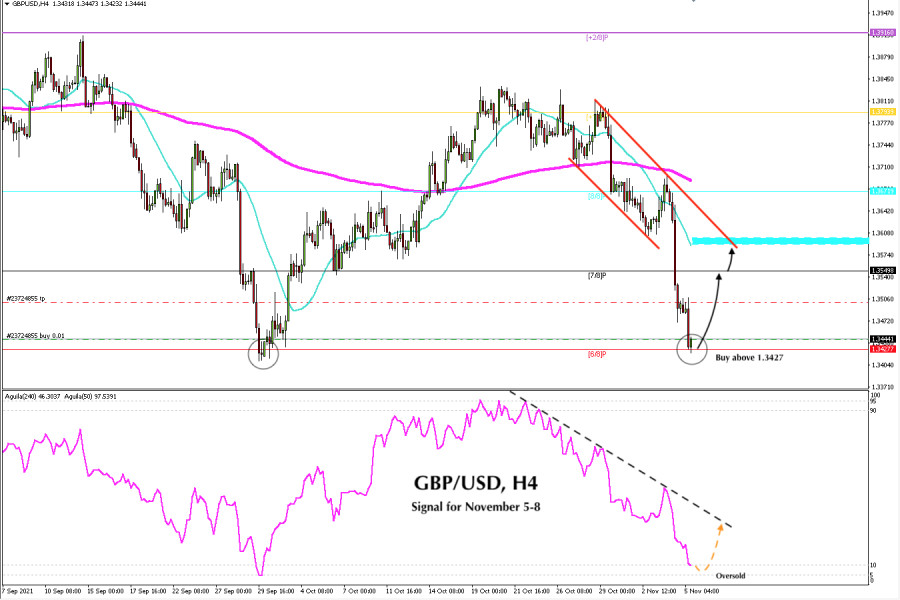
| Trading signal for GBP/USD on November 05 - 08, 2021: buy above 1.3427 (6/8) Posted: 05 Nov 2021 06:56 AM PDT
In the European session, the British pound fell to the 6/8 Murray zone around 1.3427 against the US dollar. This is the price level of September 30. GBP/USD is expected to consolidate above this level in the next few hours. The eagle indicator is showing a strong oversold signal and an imminent technical bounce is likely in the coming days. The zone of 6/8 murray represents strong support. In previous weeks and months, GBP/USD has been able to rebound and find a very strong bottom in order to return to the bullish path again. Therefore, we believe that if the British pound remains above this level of 1.3427, it is likely to rise to the level of 7/8 of murray at 1.3549 and could reach the SMA of 21 around 1.3590. The eagle indicator has reached the 10-point level. This is a strong oversold area. Therefore, we believe that a good technical rebound could occur and could give us an opportunity to buy at the current price levels. Our take profit can be located at 7/8 of murray and at the SMA of 21. The strong fall of the British pound this week was caused by the Bank of England (BoE)'s decision to keep the interest rate and QE unchanged. Apart from that, the strength of the US dollar dragged down GBP/USD from 1.3696, a one-week high, to 1.3423. All in all, the currency pair has lost more than 270 pips, making GBP/USD close in the red. The weekly chart shows that the 200 EMA is located at 1.3388. GBP/USD is likely to remain above this level. The price could always dip or rebound and could reach 1.37 again. The pair might climb to the psychological level of 1.40. On the contrary, a weekly close below 1.3380 would be the beginning of a bearish movement and we could expect a fall to the 1.3000 level, thus showing that it has a long bearish path. Our trading plan is to buy at current price levels as long as the British pound remains above 1.3427 (6/8), with targets at 1.3500 and 1.3549 (7/8). Contrary to this, if the pound if the pound closes below 6/8 of murray, we should avoid buying and waiting for new support for a technical bounce. Support and Resistance Levels for November 05 - 08, 2021 Resistance (3) 1.3623 Resistance (2) 1.3549 Resistance (1) 1.3462 ---------------------------- Support (1) 1.3427 Support (2) 1.3328 Support (3) 1.3183 *********************************************************** A trading tip for GBP/USD for November 05 - 08, 2021 Buy above 1.3427 (6/8) with take profit at 1.3547 and 1.3590 (SMA 21), stop loss below 1.3390. The material has been provided by InstaForex Company - www.instaforex.com |
| Main US indices show mostly growth Posted: 05 Nov 2021 06:42 AM PDT
The major US stock indices closed mixed on Thursday's trading session. The industrial Dow Jones index dropped by 0.09%, while the S&P 500 index and the NASDAQ index gained 0.42% and 0.81%, respectively, reaching new all-time highs. On Wednesday, the Fed decided to taper the QE program, which was adopted during the pandemic. Investors were not surprised by this decision, as the Fed has already repeatedly warned of its intentions. The information that interest rates will remain low also brings some optimism. At the same time, investors remain concerned about rising inflation. Rising prices, in turn, can exacerbate supply problems and lack of labor capacity. The most important indicators are the prices of food and fuel for cars. Notably, the unemployment rate in the US is declining. Thus, in the last week of October, there were 269,000 unemployment claims. This indicator decreased compared to the previous week's reading. Among the components of the Dow Jones index, shares of Merck & Company Inc. increased by 2.12%, Nike Inc. grew by 1.77%, Salesforce Inc. gained 1.75%, while shares of Dow Inc., The Goldman Sachs Group Inc., and The Travelers Companies Inc. fell by 3.17%, 2.37% and 2.34%, respectively. Among the components of the S&P 500 index, Qualcomm Inc., Lumen Technologies Inc., and NVidia Corp. showed the biggest gains of 12.80%, 12.64%, and 12%, respectively. The biggest drop in the value of the securities was shown by DISH Network Corp. by 13.95%, Qorvo Inc. (NASDAQ:QRVO) by 13.28%, and NRG Energy Inc. by 11,10%. Among the components of the NASDAQ index, Evaxion Biotech AS grew by 96.15%, TDH Holdings Inc. gained 82.28%, and Cassava Sciences Inc. increased by 48,96%. Shares of Vimeo Inc. dropped by 30.07%, Rimini Street Inc. fell by 29.6%, and Qurate Retail Inc. Series A slipped by 27.47%. The volatility index increased by 2.25% and reached 15.44. Gold futures gained 1.66% and reached $1,793.20 per ounce. WTI crude futures declined by 2.02% to $79.23 per barrel. Brent crude futures also dropped by 1.48% to $80.78 per barrel. The STOXX Europe 600 composite index rose by 0.4% thanks to the information that the Bank of England left the interest rate unchanged, contrary to investors' expectations. Major Asian indicators also showed growth. The Shanghai Composite and Hang Seng rose by 0.8% and the Nikkei 225 index gained 0.9%. The material has been provided by InstaForex Company - www.instaforex.com |
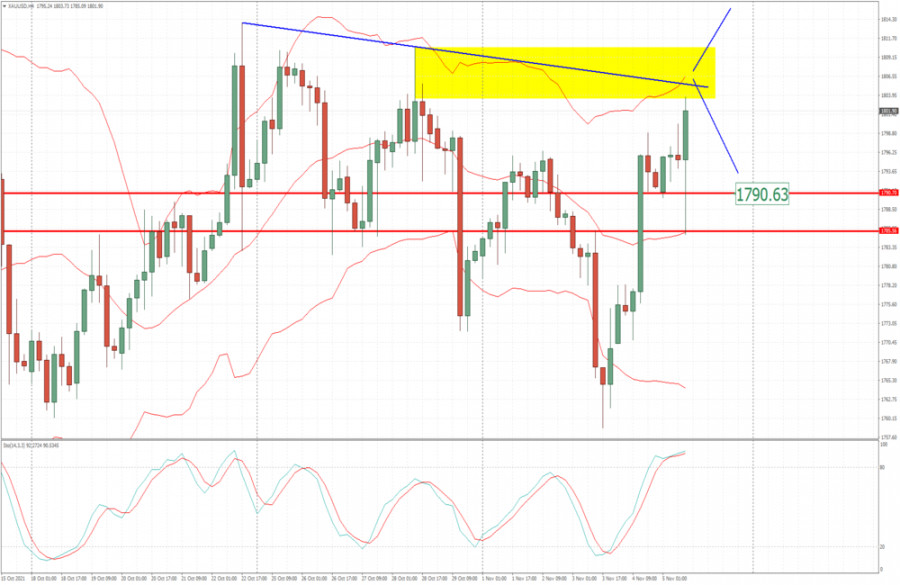
| Analysis of Gold for November 05,.2021 - Key resistance zone on the test Posted: 05 Nov 2021 06:39 AM PDT Technical analysis:
Gold has been trading upside after the financial events today but I see potential extreme condition and buying climax. Trading recommendation: Due to extreme condition and potential buying climax, my advice is to watch for selling opportunities. Major supply zone is set at $1,804-$1,810. Downside targets are set at the price of $1,790 and $1,785 Stochastic oscillator is showing overbought condition, which is another sign for the extreme bull read this morning.... The material has been provided by InstaForex Company - www.instaforex.com |
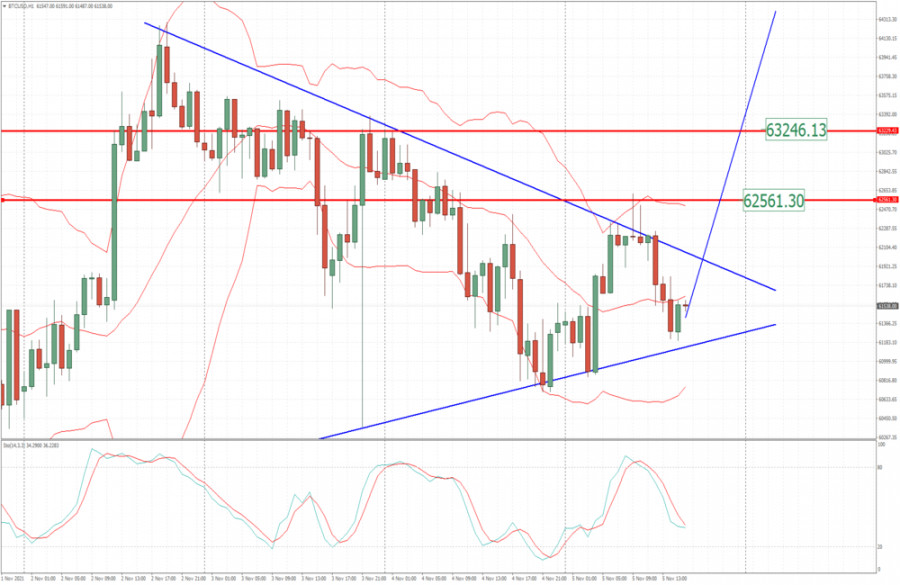
| BTC analysis for November 05,.2021 - Higher lows with uipside breakout in the background Posted: 05 Nov 2021 06:23 AM PDT Technical analysis:
BTC has been trading downside in last few hours but with building higher lows in the background. Trading recommendation: Due to higher lows in the background and the contraction on longer frames, I see potential for the rally in next period. Watch for buying opportunities with the next upside targets at $62,500 and $63,250 Stochastic is showing potential bull cross around 50 level, which is another sign for potential rally. Support level is set at $60,725 The material has been provided by InstaForex Company - www.instaforex.com |
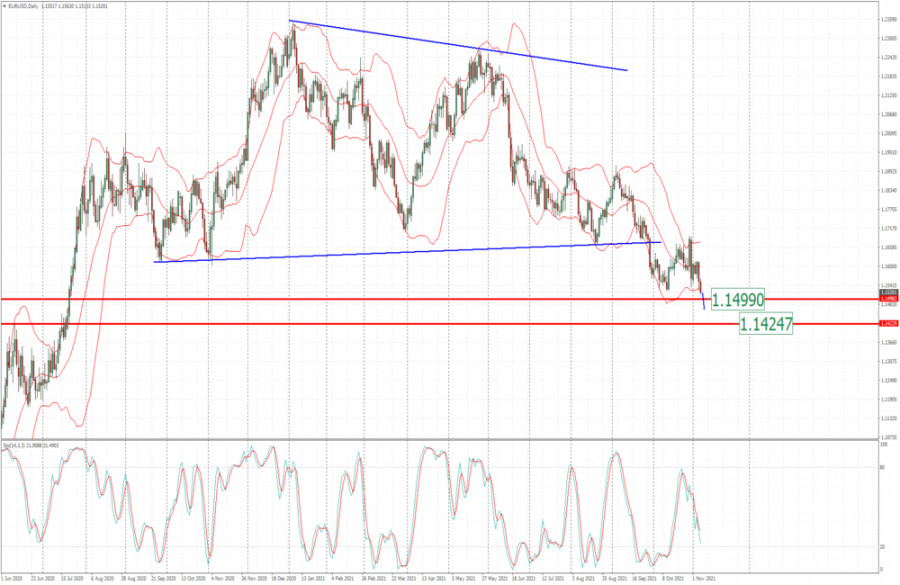
| EUR/USD analysis for November 05, 2021 - Strong downside pressure and potential for bigger drop Posted: 05 Nov 2021 06:12 AM PDT Technical analysis:
EUR/USD has been trading downside in last few days as I expected. Thee price is close to important 1.1500 mark. Trading recommendation: Due to strong downside pressure and downside trend, my advice is to watch for selling opportunities on the rallies. Next major downside target is set at the price of 1,1425 Stochastic is showing fresh bear cross, which is another sign and confirmation for the downside continuation. Resistance is set at 1,1560 The material has been provided by InstaForex Company - www.instaforex.com |
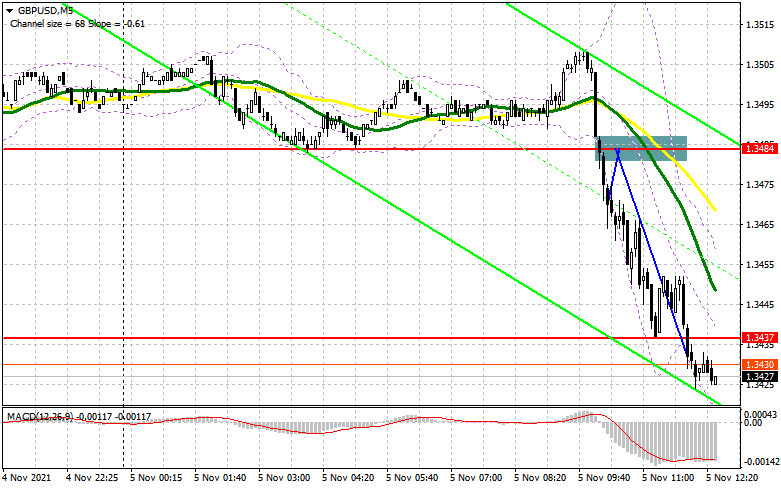
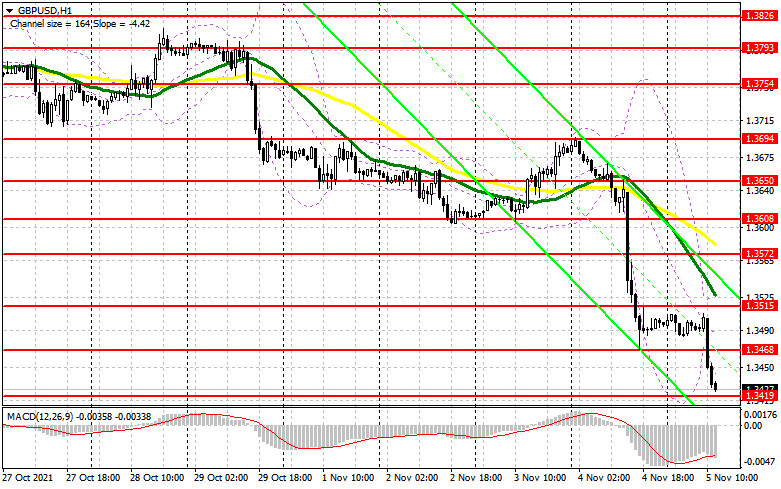
| Posted: 05 Nov 2021 04:33 AM PDT To open long positions on GBP/USD, you need: Quite predictably, the pressure on the British pound remained in the first half of the day, especially after yesterday's statements made by the governor of the Bank of England. In my morning forecast, I paid attention to the level of 1.3084 and recommended making decisions on entering the market. Let's look at the 5-minute chart and figure out what happened. An instant breakout of this range without a reverse test from top to bottom did not allow us to form a convenient entry point into short positions with the aim of further falling of the pair, although it was possible to sell the pound without it, since, after yesterday's collapse, the trend was clearly on the side of the bears. As a result, we observed a decline of GBP/USD by more than 50 points to the support area of 1.3437.
In the afternoon, all attention will be on the report on the US labor market, as the further direction of the pound depends on these data. Bulls will count on poor indicators, which will give them at least some hope for an upward correction at the end of the week. The primary task of the bulls is to regain control over the morning level of 1.3468. Weak data on the labor market will allow breaking above this range, and its reverse test from top to bottom will give an entry point into long positions. Such a scenario will lead to the demolition of several bears' stop orders and will open a direct road to today's maximum of 1.3515. Moving averages that limit the upward potential of the pair pass above this level. A breakthrough in this area will increase the probability of updating 1.3572 and 1.3608, but this is with very poor indicators for Non-Farm Employment Change. In the scenario of a further decline of the pair in the afternoon, an important task for buyers will be to protect the support of 1.3419. Only the formation of a false breakdown will increase the pound's chance of an upward correction of the pair within the day. In the scenario of the absence of active actions on the part of the bulls in the area of 1.3419, the best option for buying the pound will be a test of the next support - 1.3375. However, I advise you to open long positions against the trend there only after a false breakdown. You can watch GBP/USD purchases immediately for a rebound from the minimum of 1.3308 based on a correction of 25-30 points within a day. To open short positions on GBP/USD, you need: Sellers have plenty of chances to keep the market under their control - they just need a strong report on the US labor market. In this case, the bears will be able to push the pound below weekly lows. A breakout of 1.3419 and a reverse test from the bottom up will form a sell signal for GBP/USD in the expectation of a further drop in the trend to new lows this month: 1.3375 and 1.3308. A more distant target will be the 1.3254 area, where I recommend fixing the profits. However, such a scenario will be possible in the case of very strong data on the American labor market. In case of GBP/USD growth in the second half of the day, the bears will be set to defend the resistance of 1.3468. However, only the formation of a false breakdown there will give a good entry point to the market. If there is no activity of bears at 1.3468, I advise selling the pound only after the formation of a false breakdown in the area of 1.3515, above which the moving averages are playing on their side. I advise you to open short positions immediately for a rebound from the level of 1.3572, or even higher - from a new maximum in the area of 1.3608, counting on the pair's rebound down by 20-25 points inside the day.
The COT reports (Commitment of Traders) for October 19 recorded a reduction in short and an increase in long positions, which reflects the upward trend in the pound observed in the middle of this month. The decision of the Bank of England will determine the direction of the British pound in the near future. Most likely, after a downward correction, the bulls will take advantage of the chance and start buying the pound again at more attractive prices, even despite the decisions made by the regulator, which will affect the GBP /USD only in the short term. The speech of the Governor of the Bank of England, Andrew Bailey, may have a positive impact on the market, as the problem of inflationary pressure will force the Central Bank to act sooner or later. I advise you to count on the further strengthening of the pound and take advantage of any decline in the short term, which may form in the case of weak fundamental statistics. The COT report indicates that long non-commercial positions rose from the level of 46,794 to the level of 49,112, while short non-commercial positions fell from the level of 58,773 to the level of 47,497. This led to a change in the non-commercial net position from a negative value to a positive one. The delta was 1,615, against -11,979 a week earlier. The closing price of GBP/USD increased significantly: from 1.3591 to 1.3735. Signals of indicators: Moving averages Trading is conducted below 30 and 50 daily moving averages, which indicates the formation of pressure on the pound. Note: The period and prices of moving averages are considered by the author on the hourly chart H1 and differ from the general definition of the classic daily moving averages on the daily chart D1. Bollinger Bands In the case of growth, the average border of the indicator in the area of 1.3485 will act as resistance. Description of indicators
|
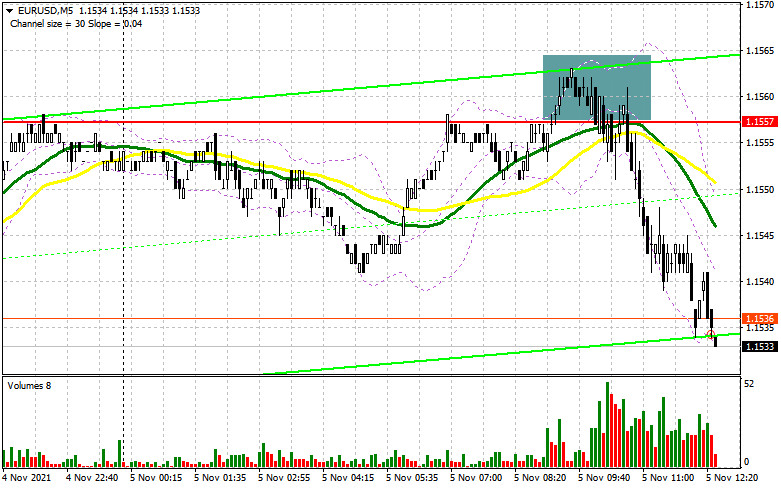
| Posted: 05 Nov 2021 04:33 AM PDT To open long positions on EURUSD, it is required: In my morning forecast, I paid attention to the level of 1.1557 and recommended making decisions on entering the market. Let's look at the 5-minute chart and figure out the entry point. Weak data on the eurozone returned pressure on the pair. As a result, several unsuccessful attempts to break 1.1557 were formed, which only led to the formation of a signal to sell the euro. At the time of writing, the pair has already fallen from the entry point by 25 points. However, from a technical point of view, nothing has changed for the second half of the day.
Now the focus has shifted to data on the US labor market and it is on them that the further direction of the dollar depends. Of course, the bulls will not give up hope of going beyond the resistance of 1.1557, which they failed to do in the first half of the day. Only weak data on the number of new jobs in the US and the reverse test of 1.1557 from top to bottom form an entry point into long positions to restore EUR/USD to the area of 1.1587, where I recommend fixing the profits. A break in this range will lead to an additional buy signal and a return of EUR/USD to the upper boundary of the wide side channel 1.1615. In case of continued pressure on the pair and strong US data, only the formation of a false breakdown around 1.1529 will give an excellent signal to buy the euro with the aim of an upward correction. In the scenario of the lack of activity of buyers at 1.1529, it is best to wait for the formation of a false breakdown in the area of 1.1494. However, you can open long positions in EUR/USD immediately to rebound from the minimum of 1.1454, or even lower - from 1.1426, counting on a correction of 15-20 points inside the day. To open short positions on EURUSD, you need: Euro sellers coped with the task assigned to them. However, from a technical point of view, nothing has changed much. In the case of EUR/USD growth during the US session before the release of the Nonfarm Employment Change report, only the formation of a false breakdown in the area of 1.1557 will lead to the formation of another signal to sell the euro to reduce to the support of 1.1529. The fact that the bears did not reach this level during the European session, having stopped from it in one step, indicates the presence of a large static player there, whose further presence will depend on US data. Only the breakout of this range and its update from the bottom up form an additional signal to open new short positions, followed by a fall of the pair to the area of 1.1449. A breakdown of this range will also lead to the demolition of buyers' stop orders, which will quickly dump EUR/USD to 1.1454, where I recommend fixing the profits. A more distant goal will be the support of 1.1426, but it will be available only in the case of very good reports on the American labor market. In the scenario of the pair's growth in the afternoon and the absence of sellers at the level of 1.1557, it is best to postpone sales until the test of the maximum of 1.1587. It is possible to open short positions immediately for a rebound based on a downward correction of 15-20 points from a large resistance of 1.1615.
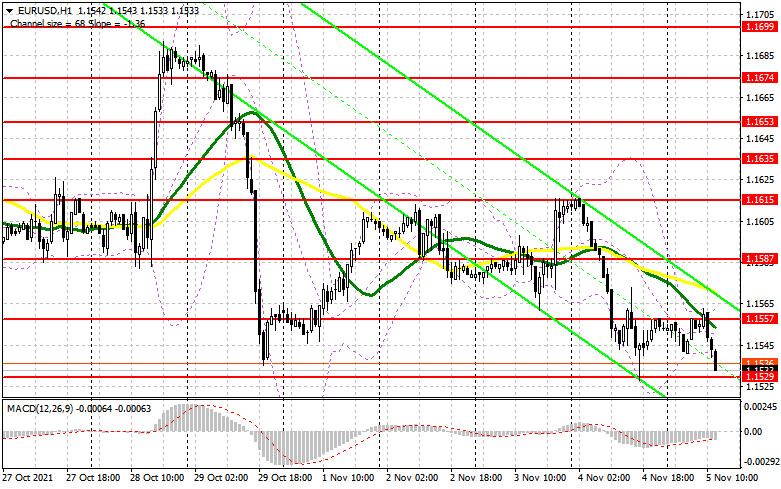
The COT report (Commitment of Traders) for 19 recorded a reduction in both short and long positions, which led to a slight recovery of the negative delta, as more sellers left the market than buyers. The slowdown in activity in the manufacturing and services sectors of the eurozone this week will not allow euro buyers to get beyond the 16th figure. However, the key problem in the shorter term, which harms the growth of the euro, is the sharp spread of the fourth wave of coronavirus infection throughout the European Union. As for the United States of America, the good pace of activity of the American economy and the expected reduction of the economic support program will not create serious problems for economic growth in the future. However, this will not help the US dollar much, as investors will prefer risky assets. The COT report indicates that long non-commercial positions decreased from the level of 202,512 to the level of 193,320, while short non-commercial positions dropped from the level of 220,910 to the level of 205,427. At the end of the week, the total non-commercial net position decreased and amounted to -12,107 against -18,398. The weekly closing price rose to the level of 1.1613 against 1.1553. Signals of indicators: Moving averages Trading is conducted below 30 and 50 daily moving averages, which indicates the formation of a bear market. Note: The period and prices of moving averages are considered by the author on the hourly chart H1 and differ from the general definition of the classic daily moving averages on the daily chart D1. Bollinger Bands A breakthrough of the lower limit of the indicator in the area of 1.1530 will lead to an instant fall of the euro. In case of growth, the upper limit of the indicator around 1.1560 will act as resistance. Description of indicators
|


| You are subscribed to email updates from Forex analysis review. To stop receiving these emails, you may unsubscribe now. | Email delivery powered by Google |
| Google, 1600 Amphitheatre Parkway, Mountain View, CA 94043, United States | |


Comments