Forex analysis review
Forex analysis review |
- USDCHF bullish continuation | 12th Nov 2021
- USDCAD bearish drop | 12th Nov 2021
- Trading signal for Crude Oil (WTI - #CL) on November 12 - 13, 2021: sell below $82.39 (SMA 21)
- Forecast for AUD/USD on November 12, 2021
- Forecast for USD/JPY on November 12, 2021
- Forecast and trading signals for GBP/USD for November 12. Detailed analysis of the movement of the pair and trade deals.
- Forecast and trading signals for EUR/USD on November 12. Detailed analysis of the pair's movement and trade deals. The holiday
- Overview of the GBP/USD pair. November 12. Great Britain: a trade war with the European Union is just around the corner,
- Overview of the EUR/USD pair. November 12. Inflation in the US may force the Fed to move faster with the tightening of monetary
- Short-term technical analysis on EURUSD for November 11, 2021.
- Short-term technical analysis on Gold for November 11, 2021.
- Inflation fuels the dollar's ambition, but what if the Fed fails
- Macron's message to the people of France, mandatory third dose and nuclear reactors
- USDCHF reaches first target.
- Ethereum continues to trade inside bullish channel.
- Ethereum upside confirmed once again
- USD/JPY further growth awaits confirmation
- November 11, 2021 : EUR/USD daily technical review and trading opportunities.
- November 11, 2021 : EUR/USD Intraday technical analysis and trading plan.
- November 11, 2021 : GBP/USD Intraday technical analysis and significant key-levels.
- Analysis of GBP/USD for November 11; Sterling continues to decline but UK statistics could not finish it off
- How to trade EUR/USD on November 12. Simple trading tips for beginners. Lackluster trading on Thursday with USD still retaining
- Analysis of EUR/USD for November 11; Joe Biden urges Congress to fight against inflation
- Litecoin: $400 not a joke, but a new price benchmark in the flesh
- Gold Approaches 1,868.62 yesterday
| USDCHF bullish continuation | 12th Nov 2021 Posted: 11 Nov 2021 08:35 PM PST
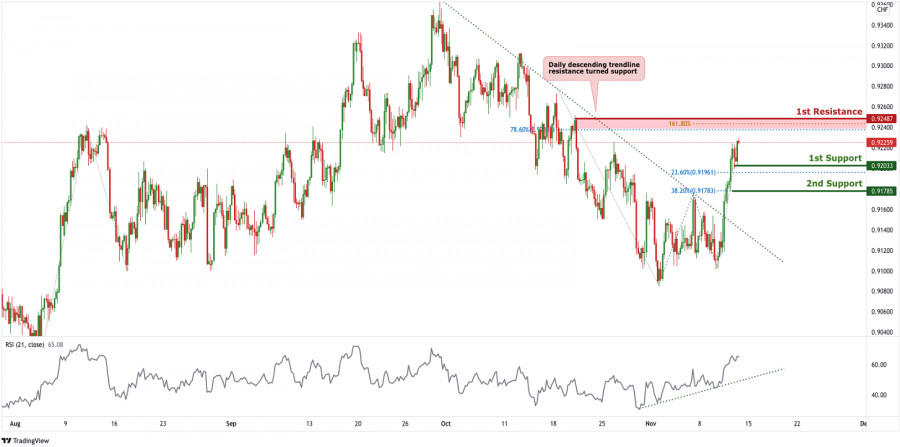
In reference to yesterday's analysis, price indeed bounced and hit our 1st resistance at 0.92487. On the H4 timeframe, we can see that price have broken out of the descending trendline resistance, signifying a bullish momentum. We can expect price to bounce from 1st Support in line with 23.6% Fibonacci retracement towards 1st Resistance in line with 78.6%Fibonacci retracement and 161.8% Fibonacci projection. Our bullish bias is further supported by the RSI indicator where it is abiding to the ascending trendline. Trading Recommendation Entry: 0.92033 Reason for Entry: 23.6% Fibonacci retracement Take Profit: 0.92487 Reason for Take Profit: 78.6% Fibonacci retracement and 161.8% Fibonacci Projection Stop Loss: 0.91785 Reason for Stop Loss: 38.2% Fibonacci retracement The material has been provided by InstaForex Company - www.instaforex.com |
| USDCAD bearish drop | 12th Nov 2021 Posted: 11 Nov 2021 08:28 PM PST
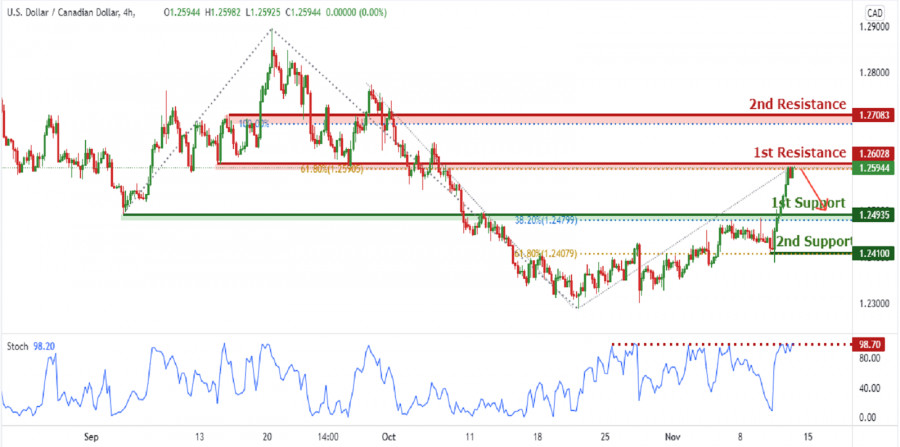
On the H4, with price approaching resistance on the stochastics indicator and the graphical resistance at 1.26028 in line with the 61.8% Fibonacci retracement at 1st resistance, we have a bearish bias that price will to 1st support at 1.24935 in line with the graphical swing overlap support and 38.2% Fibonacci retracement and possibly to 2nd support at 1.24100 in line with the horizontal swing low support and 61.8% Fibonacci retracement. Alternatively, we may see price break 1st resistance structure and head for 2nd resistance at 1.257083 in line with the 100% Fibonacci projection level and horizontal overlap resistance. Trading Recommendation Entry: 1.26028 Reason for Entry: 61.8% Fibonacci retracement and the horizontal swing high resistance Take Profit: 1.24935 Reason for Take Profit: Graphical swing overlap support and 38.2% Fibonacci retracement Stop Loss:1.257083 Reason for Stop Loss: 100% Fibonacci projection level and horizontal overlap resistance The material has been provided by InstaForex Company - www.instaforex.com |
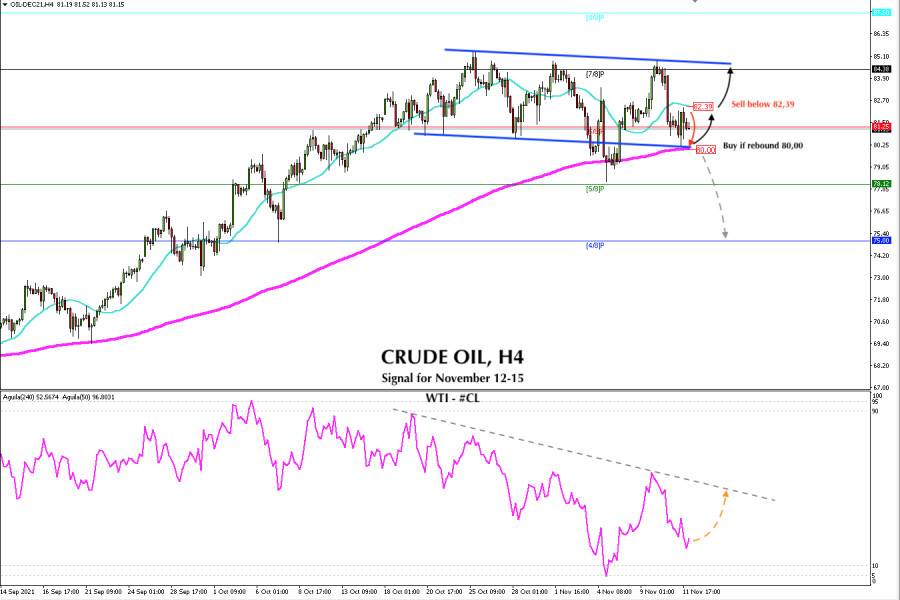
| Trading signal for Crude Oil (WTI - #CL) on November 12 - 13, 2021: sell below $82.39 (SMA 21) Posted: 11 Nov 2021 08:20 PM PST A barrel of oil (WTI, #CL) is trading at 81.25 below the SMA of 21 and below the 6/8 support of murray. It is showing a bearish bias which is limited by the EMA of 200 located at 80.00. Since October 20, WTI has been oscillating within a slightly sloping downtrend channel. Crude oil has moved in a price range of about 450 pips. This consolidation is likely to continue in the coming days and return the price to the level of 84.38. The US inflation data, which exceeded analysts' forecasts, delivered a strong blow to oil prices and raised expectations that the Federal Reserve could withdraw monetary stimulus more quickly. Another factor that has exerted pressure on oil is the strength of the US dollar and the decline in the Wall Street indices. WTI has a positive correlation with the equity markets. As they have been going through a correction in recent days, the price of crude has also weakened.
In order for Crude to resume its uptrend, it has to overcome and settle above 84.38 (7/8). If it continues to move below this level, certain limitations will be expected and it will continue to oscillate within the price range of 84.38-80.25. For a bearish scenario and a change in the trend, WTI should have a daily close below the 200 EMA located at 80.00. From this level, it may fall to the support level of 5/8 of murray at 78.12 and to the support of 4/8 around 75.00. Iraqi Oil Minister Ihsan Abdul-Jabbar Ismail said on November 11 that the Organization of the Petroleum Exporting Countries (OPEC +) is expected to maintain its policy of gradually increasing oil production per 400,000 barrels per day. In the next few hours, we expect a technical bounce around the 200 EMA which will be a signal to buy. Our primary target will be at 82.39. On the other hand, a consolidation above the 21 SMA will be a bullish sign, and the price could rise to 84.38. Below we leave the support and resistance levels for the next two days. Support and Resistance Levels for November 12 - 15, 2021 Resistance (3) 83.33 Resistance (2) 82.25 Resistance (1) 81.50 ---------------------------- Support (1) 80.14 Support (2) 79.11 Support (3) 78.12 *********************************************************** A trading tip for CRUDE OIL for November 12 - 15, 2021 Sell below 82.39 (SMA 21) with take profit at 80.00 (EMA 200) and stop loss above 82.95. The material has been provided by InstaForex Company - www.instaforex.com |
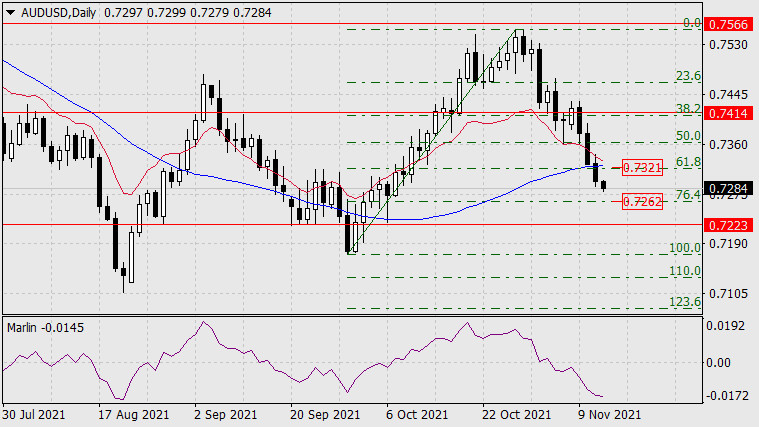
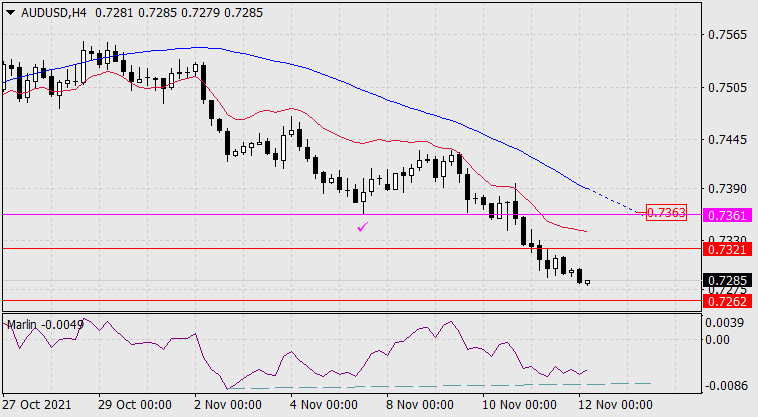
| Forecast for AUD/USD on November 12, 2021 Posted: 11 Nov 2021 07:32 PM PST Yesterday, the Australian dollar showed a steady decline by 30 points with the consolidation below the MACD indicator line. The double convergence option did not materialize, now we are waiting for the price near the nearest target along the Fibonacci line of 76.4% at the price of 0.7262. Further, the 0.7223 target level may open. An upward reversal will now only indicate a price return above the 61.8% Fibonacci level at 0.7321, which coincides with the MACD line on a daily scale.
On the four-hour chart, there is still the possibility of a weak convergence formation. There may be a reversal at any target level (0.7262, 0.7223). But the closer the price approaches the Fibonacci level of 100.0%, the higher the likelihood of a medium-term further decline increases. Thus, there is no sign of a continuation of the Australian dollar's decline and we have no targets for this decline, there is only a clear condition for its probable upward reversal.
|
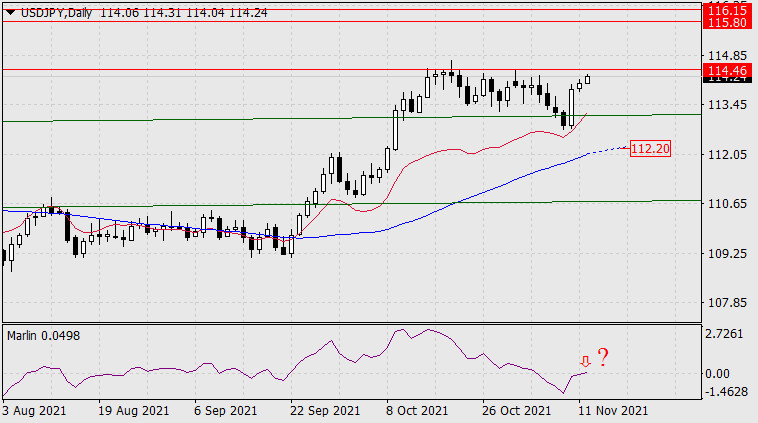
| Forecast for USD/JPY on November 12, 2021 Posted: 11 Nov 2021 07:27 PM PST The USD/JPY pair continues its slow growth under the continuing pressure from the US dollar. Consolidating above the target level of 114.46 - above the November 1 high, opens the way for the price to the target range of 115.80-116.15. Until this moment, the price can reverse downward, which is indicated to us, as a scenario, by the Marlin Oscillator, which is unfolding downward from the border of the growth area. The target of the decline will be the MACD line, around 112.20.
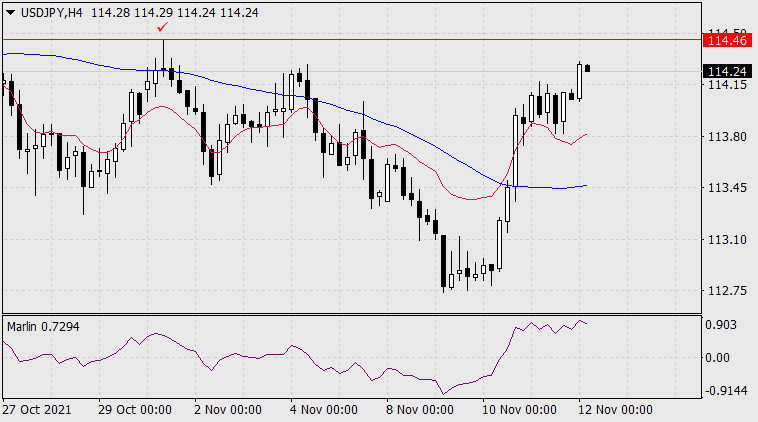
On the four-hour chart, the Marlin Oscillator has formed a sideways trend over the past day and a half. This could be a sign of a downward price reversal. But at the moment the price is still hot, it may continue to rise. The observed uncertainty can be completed in a day or two, and then trading risks will be significantly reduced.
|
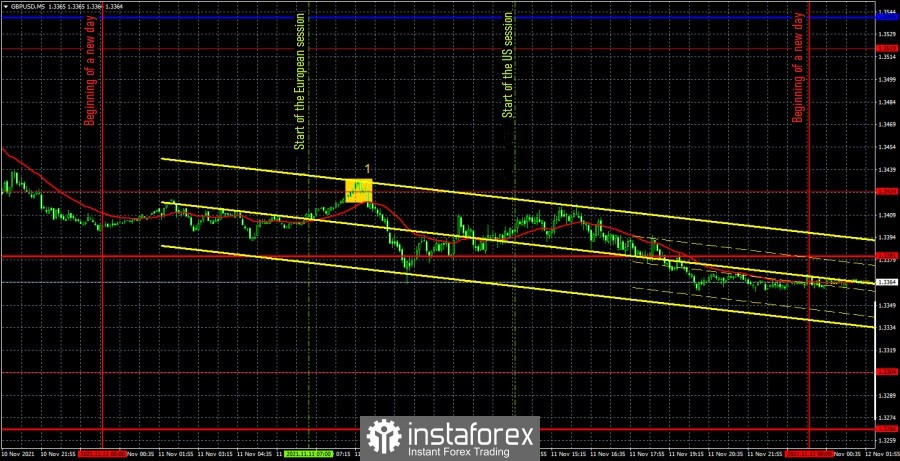
| Posted: 11 Nov 2021 06:46 PM PST GBP/USD 5M
The GBP/USD pair was trading quite actively at first on November 11. The fact is that early in the morning several important macroeconomic reports were published in the UK, which provoked a new drop in the British currency's quotes. However, the pound stopped falling, and the pair followed the example of the euro/dollar and began to move exclusively sideways. Since the flat was not obvious for the pound/dollar, it made sense to trade yesterday. However, only one trading signal was formed, also early in the morning. Let's figure out what should have been done on Thursday. As we have already said, there was only one trading signal during the day, and volatility was 71 points. The pair went down by all 71 points after reports on GDP for the third quarter and industrial production for September were published in Britain. Both, if not turned out to be disappointing, then turned out to be weaker than forecasts, so a new fall in the British pound followed. The signal in the form of a fuzzy rebound from the extreme level of 1.3424 should have been worked out, because the rebound itself spoke in favor of a new fall, and also "macroeconomics" spoke in favor of a fall. Subsequently, the price settled below the support level of 1.3381, which made it possible to keep short positions open. However, very soon the consolidation was completed above the level of 1.3381, which served as a signal to close short positions. The profit on the transaction was 25-30 points. We remind you that signals did not form near the support levels (thicker red lines). And since no other line or level was worked out on Thursday, there were no more signals either. GBP/USD 1H
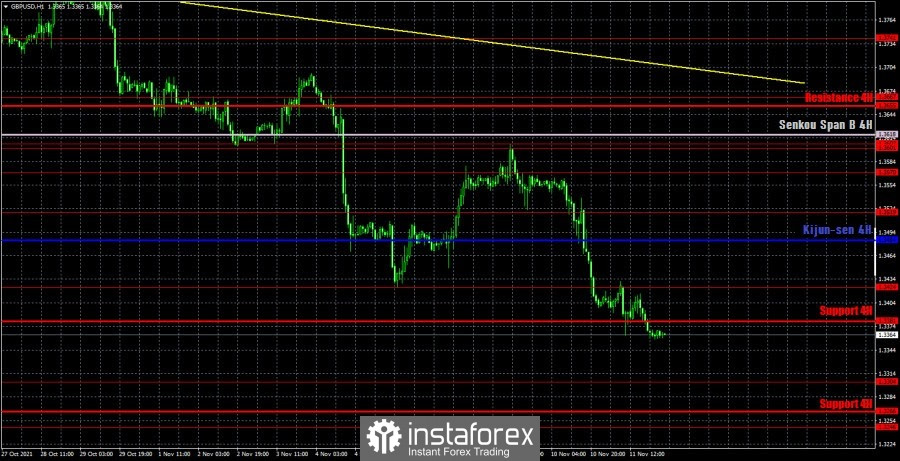
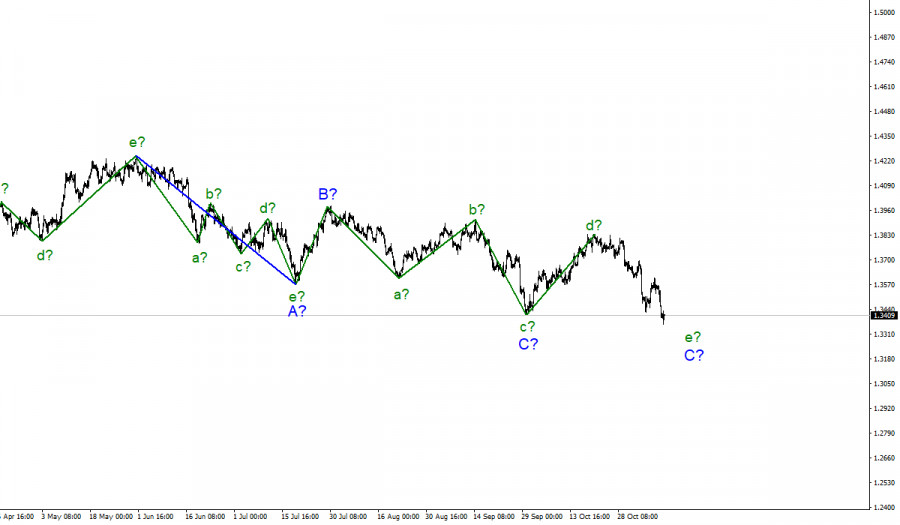
The pound/dollar pair maintains a downward trend on the hourly timeframe, as it continues to be located below the trend line. At the moment, the pound/dollar pair is very close to its annual lows and does not show any desire to start an upward correction. The price is very far from the trend line, so almost any correction in size will be interpreted as a correction. And because of this, the meaning of the trend line is somewhat lost. However, on the other hand, there is a trend movement itself, and it allows you to trade and open profitable positions. We highlight the following important levels on November 12: 1.3246, 1.3304, 1.3424, 1.3519, 1.3570. The Senkou Span B (1.3618) and Kijun-sen (1.3484) lines can also be signal sources. It is recommended to set the Stop Loss level to breakeven when the price passes in the right direction by 20 points. The lines of the Ichimoku indicator can move during the day, which should be taken into account when searching for trading signals. There will be nothing interesting in the UK or the US on Friday. We have already talked about the consumer sentiment index from the University of Michigan. But, unless its value exceeds the forecast (72.5) by 10 points or turns out to be the same number of points worse, it is unlikely that the markets will pay attention to this report at all. Thus, today we expect a calm movement of the pound/dollar pair, possibly a correction, since this week there was a strong downward movement. We recommend you to familiarize yourself: Overview of the EUR/USD pair. November 12. US inflation could force the Fed to move faster with monetary tightening. Overview of the GBP/USD pair. November 12. Great Britain: a trade war with the European Union is just around the corner, a scandal with Boris Johnson. Forecast and trading signals for GBP/USD for November 12. Detailed analysis of the movement of the pair and trade deals. COT report
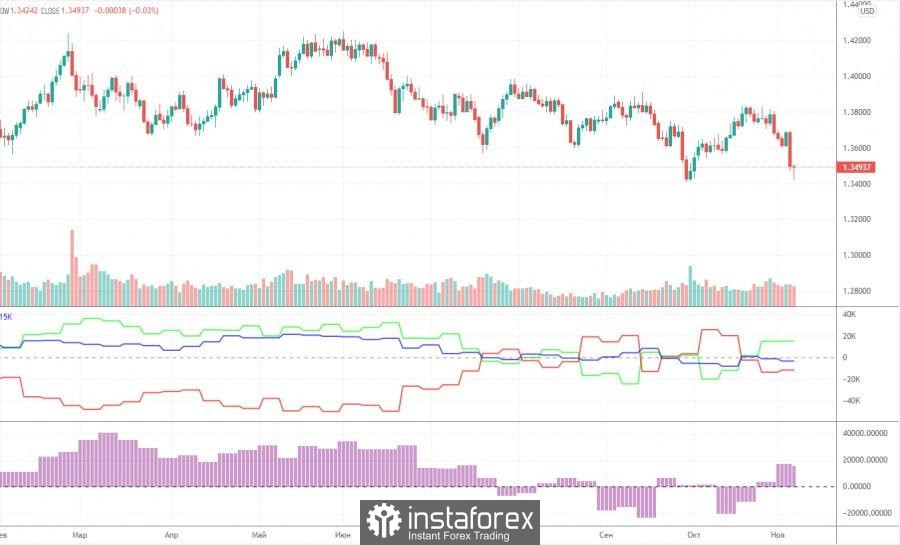
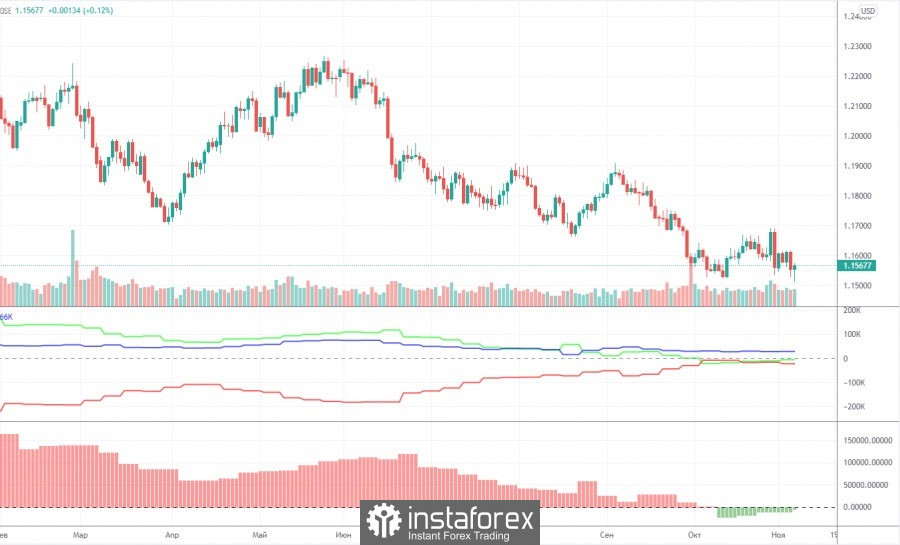
The mood of professional traders practically did not change during the last reporting week (October 26-November 1). However, it should be noted that the two most important days of last week – Wednesday and Thursday - when all the strongest movements occurred, were not included in the latest report. That is, in a week we will be able to see how much and in which direction the mood of professional traders has changed. In the meantime, we can only draw the same conclusions as a week ago. The green and red lines of the first indicator continue to constantly change the direction of movement, constantly intersecting. This suggests that big players themselves do not understand what to do with the pound. However, this can be clearly seen from the very schedule of the pair's movement, starting from July. These four months, the pound/dollar pair has been between the levels of 1.3400 and 1.4000, that is, in the horizontal channel. It was during this period of time that commercial and non-commercial traders changed their mood almost every week. Thus, taking into account the previous changes, we would assume that a new growth of the British currency will begin in the near future with the prospect of a 500-point rise. Moreover, the results of the Bank of England meeting were not dovish. The British currency has fallen undeservedly, which means that the markets may soon recoup this injustice. It should also be noted that during the reporting week, professional traders opened 5.8 buy contracts (longs) and 7.5 thousand sell contracts (shorts). Thus, the net position has not changed much. Explanations for the chart: Support and Resistance Levels are the levels that serve as targets when buying or selling the pair. You can place Take Profit near these levels. Kijun-sen and Senkou Span B lines are lines of the Ichimoku indicator transferred to the hourly timeframe from the 4-hour one. Support and resistance areas are areas from which the price has repeatedly rebounded off. Yellow lines are trend lines, trend channels and any other technical patterns. Indicator 1 on the COT charts is the size of the net position of each category of traders. Indicator 2 on the COT charts is the size of the net position for the non-commercial group. The material has been provided by InstaForex Company - www.instaforex.com |
| Posted: 11 Nov 2021 06:31 PM PST EUR/USD 5M
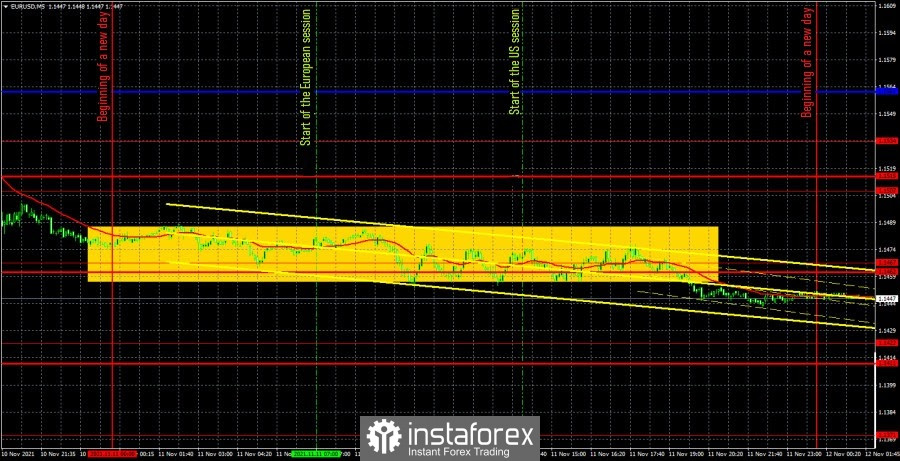
The EUR/USD pair is in its usual mode during the penultimate trading day of the week. Namely, in total flat. After the markets worked out the report on US inflation, which could really plunge into shock, the pair simply stopped moving, but at the same time it is located near its annual lows. In previous articles (especially fundamental ones), we talked about the nature of the pair's movement at the present time. The 800 points that the price has passed from top to bottom since May can be divided into such periods: about ten days when there was a really strong downward movement, and the rest of the days when the pair stood in one place or pretended to decline. Thus, this is exactly the problem: there is a trend, but the nature of the movement itself leaves much to be desired. Yesterday was a vivid illustration of that. How can you work with the pair if it is in a 30-point horizontal channel all day? We didn't even analyze the technical signals, since it became clear from the very night that there would be no movements on Thursday. The bears were still trying to continue moving down at the European trading session, but they gave up very quickly and just started watching the situation. No important macroeconomic report published on November 11. No important fundamental event on November 11. We had a stunningly fun and interesting day, during which not a single transaction was opened. The most interesting thing is that from the current positions, the price can safely continue moving down. That's just it can happen in two days, and in five days. EUR/USD 1H
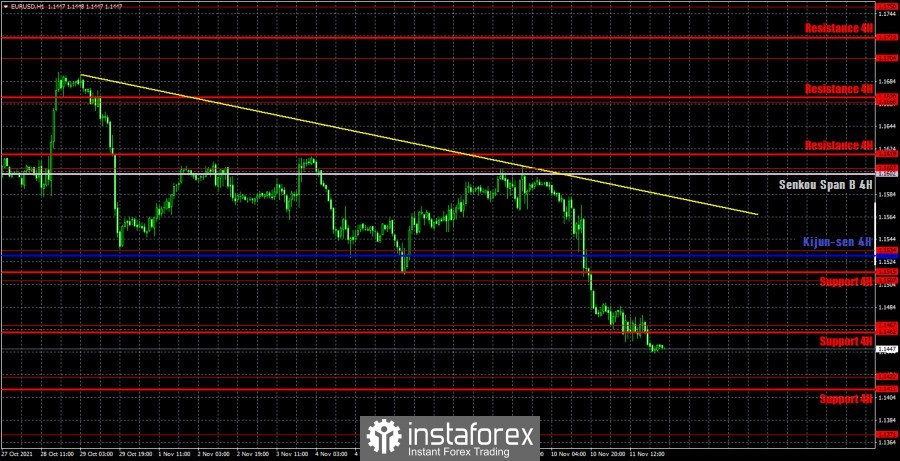
The downward trend quickly formed on the hourly timeframe, quickly reversed, quickly formed anew. As we mentioned above, the problem is that the pair moves trendily somehow too rarely. One trending day, five flat ones. Thus, the trend line just manages to be canceled in a few days of "downtime" that follow the trend. Therefore, the downward trend persists and the pair even falls from time to time, but only such movements usually occur during the days of the strongest statistics or "foundation". We highlight the following levels for trading on Friday – 1.1422, 1.1467, 1.1507, 1.1534, 1.1607, 1.1666, as well as the Senkou Span B (1.1602) and Kijun-sen (1.1530) lines. The lines of the Ichimoku indicator may change their position during the day, which should be taken into account when searching for trading signals. Signals can be rebounds or breakthroughs of these levels and lines. Do not forget about placing a Stop Loss order at breakeven if the price moves 15 points in the right direction. This will protect you against possible losses if the signal turns out to be false. Only a secondary report on industrial production will be released in the European Union, and a secondary report on consumer sentiment from the University of Michigan will be released in the United States on November 12. The probability that the markets will work out this data is very low. Most likely, today we are waiting for another "fun" day, in which you can sit out "on the fence". We recommend you to familiarize yourself: Overview of the EUR/USD pair. November 12. US inflation could force the Fed to move faster with monetary tightening. Overview of the GBP/USD pair. November 12. Great Britain: a trade war with the European Union is just around the corner, a scandal with Boris Johnson. Forecast and trading signals for GBP/USD for November 12. Detailed analysis of the movement of the pair and trade deals. Analysis of the COT report
The mood of non-commercial traders changed, but not much, during the last reporting week (October 26-November 1). A group of "non-commercial" traders closed 4,000 buy contracts (longs) and 10.5 thousand sell contracts (shorts) during the reporting week. Consequently, the net position of professional players has grown by 6.5 thousand, which is not so much. However, the changes in the mood of non-commercial traders are best seen by the first indicator in the chart above. The red and green lines have been moving towards each other for a long time, and in the last couple of months they have been almost at the same level. This suggests that the previous trend is ending, and the mood of the major players at this time is as neutral as possible. This is confirmed by the data on the total number of contracts. The non-commercial group has 195,000 buy contracts (longs) and 199,000 sell contracts (shorts). The commercial group has 418,000 buy contracts and 442,000 sell contracts. That is, as we can see, the numbers are almost the same. Therefore, there are theoretical chances for the continuation of the downward movement in the pair. The trend began to end (an upward trend) when the red and green lines (net positions of the commercial and non-commercial groups) began to narrow. That is, for quite a long time. And now, logically, the downward trend continues. However, this "trend" is still not too similar to the trend. Rather, a banal three-wave correction. Explanations for the chart: Support and Resistance Levels are the levels that serve as targets when buying or selling the pair. You can place Take Profit near these levels. Kijun-sen and Senkou Span B lines are lines of the Ichimoku indicator transferred to the hourly timeframe from the 4-hour one. Support and resistance areas are areas from which the price has repeatedly rebounded off. Yellow lines are trend lines, trend channels and any other technical patterns. Indicator 1 on the COT charts is the size of the net position of each category of traders. Indicator 2 on the COT charts is the size of the net position for the non-commercial group. The material has been provided by InstaForex Company - www.instaforex.com |
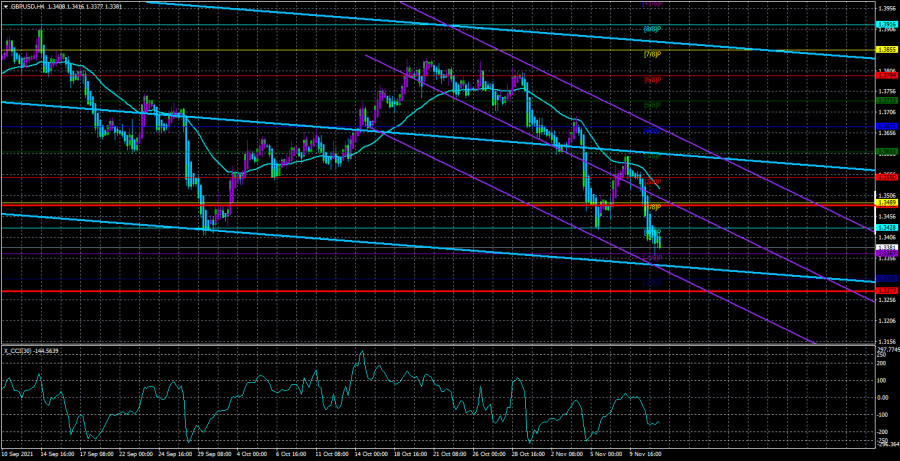
| Posted: 11 Nov 2021 04:38 PM PST 4-hour timeframe
Technical details: Higher linear regression channel: direction - downward. Lower linear regression channel: direction - downward. Moving average (20; smoothed) - downward. The GBP/USD currency pair was in a downward movement yesterday and the day before yesterday, which is not surprising, given the value of the consumer price index in the United States. Thus, the downward trend for the pound/dollar pair persists and it looks much more confident and beautiful than for the euro/dollar pair. The GBP/USD pair is not permanently fixed above the moving average, so as not to continue the upward movement later. The movements themselves are much more volatile than for the euro, especially in the last 6-7 trading days. Thus, it is the pound that now shows what movements need to be shown so that they want to trade. Both linear regression channels are directed downwards, as well as moving, so short positions should still be considered now. We have repeatedly assumed that in the second half of the year, the pound may begin to grow, with a long-term and strong. However, there are no grounds and signals for this now. The price is still below the moving average, so what purchases can we talk about now? Recall that any hypothesis, any assumption must be confirmed by specific trading signals. If there are none, then the assumption just remains an assumption. In the last few weeks, "macroeconomics" and "foundation" have been on the side of the dollar. The Fed meeting and reports on Nonfarm and inflation turned out to be unequivocally in favor of the US currency. The meeting of the Bank of England, from our point of view, was obliged to support the pound, but this did not happen and it is this moment that makes us doubt the long-term growth of the US currency. The Bank of England has made it clear that it may raise the key rate as early as next month. And that's the main thing. If this happens, the pound will not be able to show growth. And if it does not show, then once again in the context of the pound/dollar pair, you will have to ask a question about the logic of movements and decisions made by the market. London is racing towards a trade war with the EU. Yesterday, we already said that the European Union is now considering the possibility of creating a backup plan that will provide for the introduction of duties on British imports, as well as restrict Britain's access to the EU energy market. Surely, other methods of influencing the British, who in the last few years have continued to "swing their rights" and believe that the European Union should accept any of their opinions and support any of their requests, will also be considered. However, although they are famous for their liberal views in the European Union, they are not ready to be led by London all the time. The European Union is ready to discuss the problem of the "Northern Ireland Protocol", but is not ready to completely change it, because London wants it that way. The same applies to outright threats and blackmail of London regarding Article 16, which will allow it to refuse to comply with certain provisions and clauses of the Brexit agreement. Such an article does exist, but, as often happens, its content is rather vague and it can be interpreted as you like. However, the European Union is ready to go all the way this time. Italy, Spain, France, Germany, and the Netherlands have already expressed their displeasure with London's behavior and are preparing for a worsening of the conflict. Meanwhile, Prime Minister Boris Johnson got into another scandal. This time he tried to change the rules because of his fellow party member, who got into a corruption scandal. We are talking about Owen Paterson, who lobbied for the interests of two companies and who was facing an investigation on corruption charges. Since the leader of the party and the prime minister of the country undertook to protect his fellow party member, he was also immediately accused of corruption and bribery. Representatives of the Labor Party say that this is not the first time that companies close to the Tories have a much better chance of receiving government orders. At this time, Johnson is being asked to apologize and admit his own mistake. And not only the opposition but also his own Conservative Party. Recall that this is not the first scandal involving Johnson. And criticism of the British Prime Minister pours with enviable regularity. So far, Boris Johnson is confidently following in the footsteps of Donald Trump.
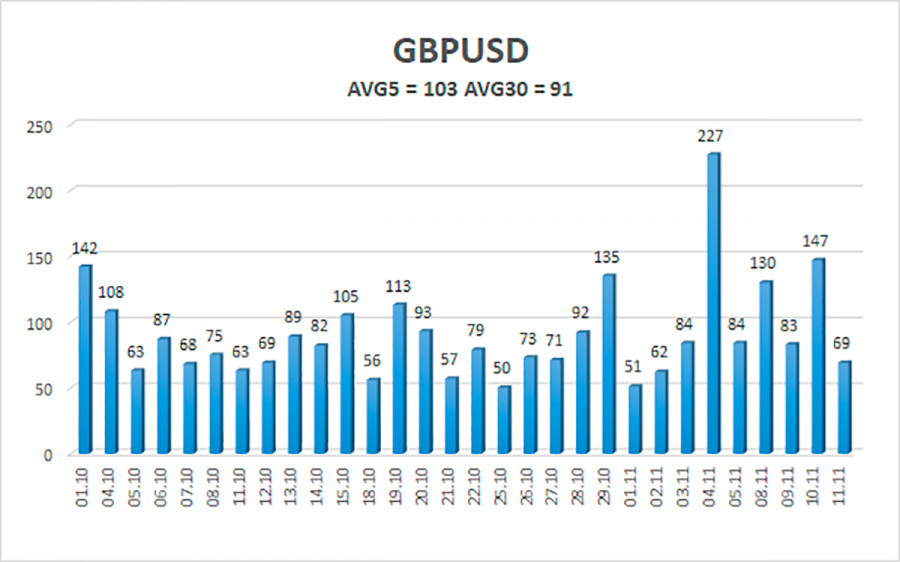
The average volatility of the GBP/USD pair is currently 103 points per day. For the pound/dollar pair, this value is "average". On Friday, November 12, we expect movement inside the channel, limited by the levels of 1.3277 and 1.3483. A reversal of the Heiken Ashi indicator upwards will signal a new round of upward correction. Nearest support levels: S1 – 1.3367 S2 – 1.3306 Nearest resistance levels: R1 – 1.3428 R2 – 1.3489 R3 – 1.3550 Trading recommendations: The GBP/USD pair continues to be below the moving average on the 4-hour timeframe, so the trend remains downward. Thus, at this time, it is necessary to remain in short positions with the targets of 1.3306 and 1.3277 levels until the Heiken Ashi indicator turns upwards. Buy orders can be considered if the price is fixed above the moving average line with targets of 1.3550 and 1.3611 and keep them open until the Heiken Ashi turns down. Explanations to the illustrations: Linear regression channels - help determine the current trend. If both are directed in the same direction, then the trend is strong now. Moving average line (settings 20.0, smoothed) - determines the short-term trend and the direction in which trading should be conducted now. Murray levels - target levels for movements and corrections. Volatility levels (red lines) - the likely price channel in which the pair will spend the next day, based on current volatility indicators. CCI indicator - its entry into the oversold area (below -250) or into the overbought area (above +250) means that a trend reversal in the opposite direction is approaching. The material has been provided by InstaForex Company - www.instaforex.com |
| Posted: 11 Nov 2021 04:38 PM PST 4-hour timeframe Technical details: Higher linear regression channel: direction - downward. Lower linear regression channel: direction - downward. Moving average (20; smoothed) - downward. The EUR/USD currency pair continued its downward movement on Thursday, which was started the day before. If we study the period of the last three weeks, it becomes clear: the dollar has shown tangible growth three times and each time after some serious macroeconomic or fundamental event. The first time was the ECB meeting, the second time was the Fed meeting, and the third time was the US inflation report. Since all three of these events turned out to be in favor of the US currency, it is not surprising that the US dollar is currently growing again. However, there are still doubts about his further ability to grow. At this time, the pair moves as follows: it waits for an important event and falls, after which it can stand in one place for several days, adjust sluggishly or slowly decline with minimal volatility. If you look at the daily timeframe, where each candle is visible, then we can conclude that the entire downward movement from the last local maximum (May 25 - 1.2260) occurred, by and large, in a dozen trading days. The rest of the time, the pair showed volatility of 40-50 points per day, trading in different directions or with a minimal downward bias. Thus, although there is a trend now, a downward trend is present, the movement itself remains as uncomfortable and strange as possible. There is a feeling that traders do not want to buy the dollar. However, at the same time, they are forced to do so by macroeconomic statistics and the "foundation". Also in favor of this option is the constant consolidation of the price above the moving average, after which the upward movement does not begin. Thus, we advise traders to use either minimum TF or maximum TF in trading. James Bullard hints at the earlier completion of the QE program. American inflation rose to 6.2% y/y in October and this is a very close phenomenon to it. Of course, now many economies of the world are experiencing problems, especially with inflation, but the States, which still have the largest economy in the world, somehow affect all other countries. Thus, it is impossible not to attach importance to inflation in America if you do not live in another country. In the modern world, all states are tied to each other. It is not for nothing that the Fed fears the collapse of Chinese construction companies, which have accumulated loans and are now on the verge of bankruptcy since the volume of construction has long exceeded the volume of demand even in China. Because if a couple of Chinese companies collapse, it will entail a whole wave of bankruptcies of other companies, which will plunge the whole world into the "crisis of 2008". And now this is especially true, when not only private companies have accumulated debts, but the states themselves are drowning in them. Thus, the higher the inflation, the worse. The more difficult it will be to stop it in the future. Moreover, the Fed and the US Congress will have to take emergency measures. Joe Biden has already stated that he sets a goal for the government to curb inflation, as it hurts the pockets of ordinary Americans. But Jerome Powell and Janet Yellen persistently do not attach importance to such a strong price increase. Most likely, they understand everything perfectly. However, they do not want to provoke panic in the markets. Therefore, they continue to say that high inflation is a "temporary phenomenon" and price growth will begin to slow down next year. But the chairman of the St. Louis Fed, James Bullard, who is famous for his tough and honest statements, said that next year he expects two rate hikes, and the regulator may complete the quantitative stimulus program not in July-August, but in April. Forcing deadlines is exactly what is needed to stop the uncontrolled rise in prices and keep inflation under control (if it is still possible). "If inflation turns out to be more stable than we think, then we may probably need to take action a little earlier," Bullard said.
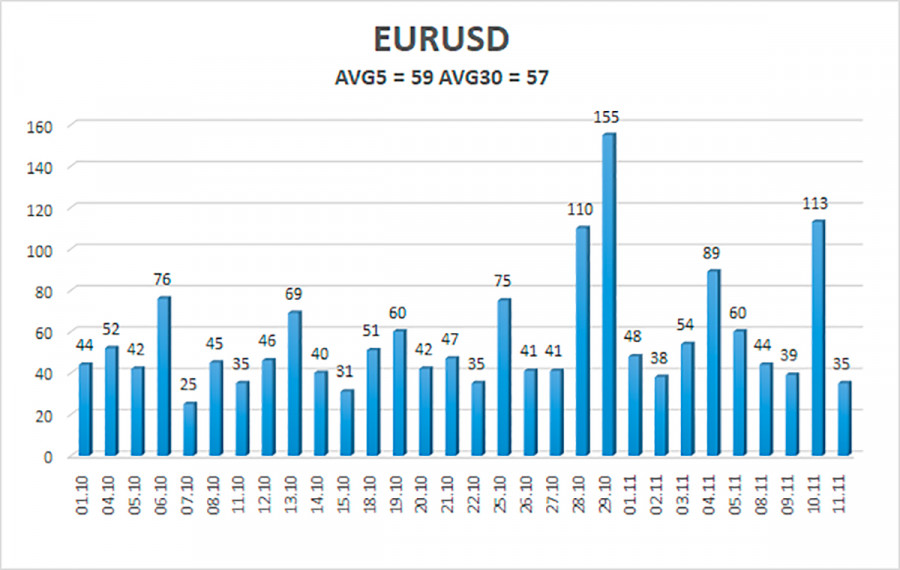
The volatility of the euro/dollar currency pair as of November 12 is 59 points and is characterized as "average". Thus, we expect the pair to move today between the levels of 1.1408 and 1.1526. The upward reversal of the Heiken Ashi indicator signals a round of upward correction. Nearest support levels: S1 – 1.1414 S2 – 1.1353 Nearest resistance levels: R1 – 1.1475 R2 – 1.1536 R3 – 1.1597 Trading recommendations: The EUR/USD pair continues its downward movement. Thus, today it is necessary to stay in short positions with targets of 1.1414 and 1.1408 until the Heiken Ashi indicator turns upwards. Purchases of the pair should be considered if the price is fixed back above the moving average, with a target of 1.1597. It should be taken into account that reversals now occur very often and the price loves to falsely break through the moving lately. Explanations to the illustrations: Linear regression channels - help determine the current trend. If both are directed in the same direction, then the trend is strong now. Moving average line (settings 20.0, smoothed) - determines the short-term trend and the direction in which trading should be conducted now. Murray levels - target levels for movements and corrections. Volatility levels (red lines) - the likely price channel in which the pair will spend the next day, based on current volatility indicators. CCI indicator - its entry into the oversold area (below -250) or into the overbought area (above +250) means that a trend reversal in the opposite direction is approaching. The material has been provided by InstaForex Company - www.instaforex.com |
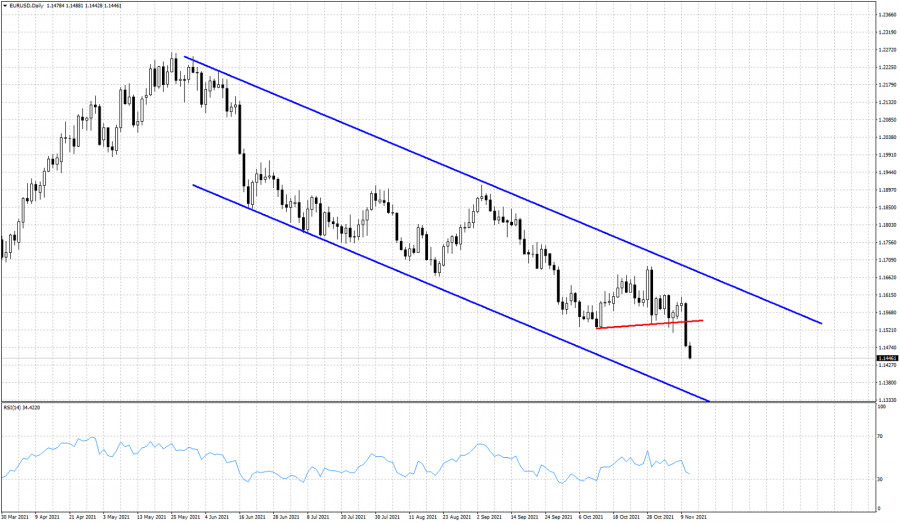
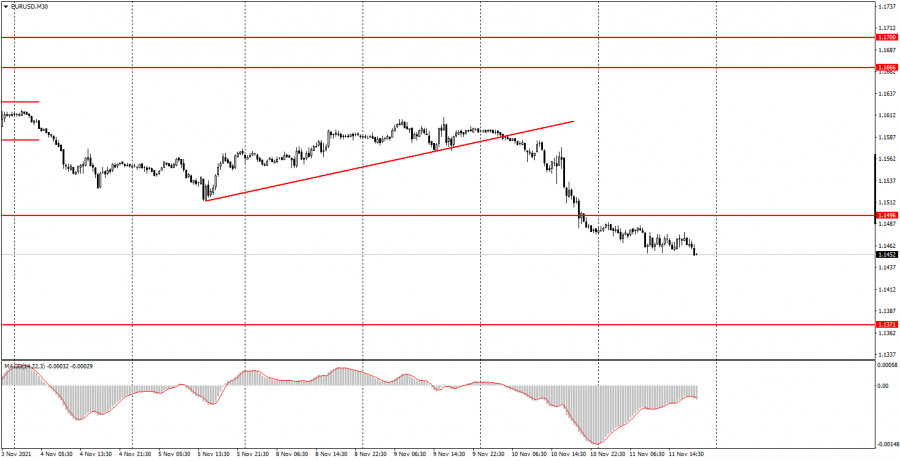
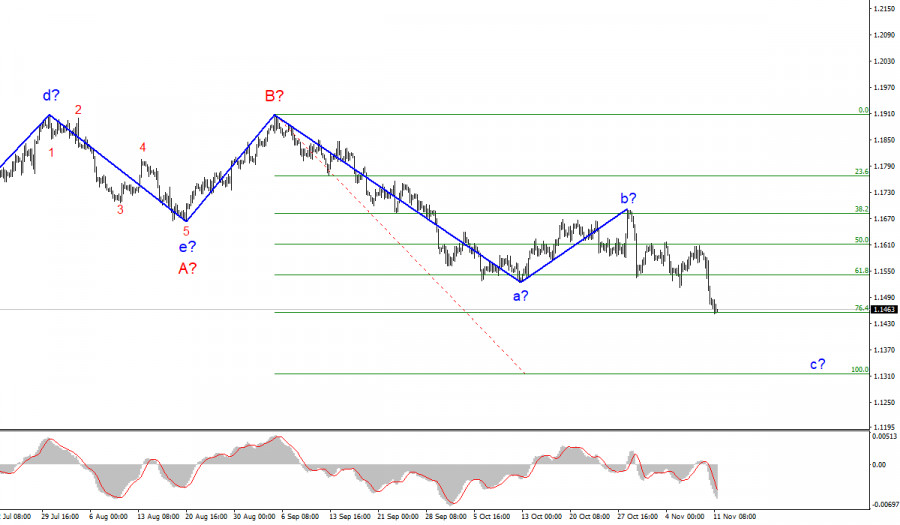
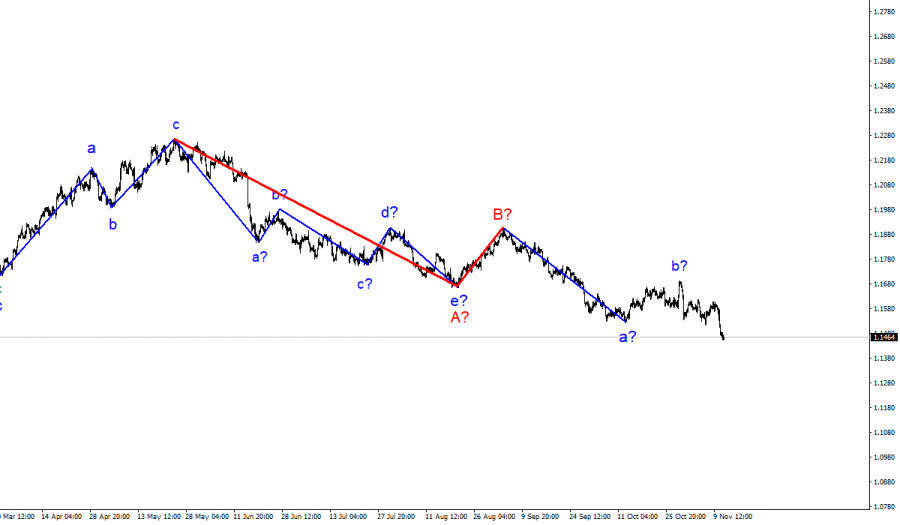
| Short-term technical analysis on EURUSD for November 11, 2021. Posted: 11 Nov 2021 01:33 PM PST EURUSD yesterday provided us with a new bearish signal. Price broke below support at 1.1535 and as expected, EURUSD is making new lows. EURUSD is trading near 1.1450. Price remains trapped inside a bearish channel.
Red line - support trend line Support by the channel boundary is at 1.1360. Over the past few days we warned traders that a break below the red trend line would be a sell signal. As long as price stays below 1.1670 bears will remain in full control of the trend. The RSI is showing some warning signs to traders, but still there is no reversal signal. The material has been provided by InstaForex Company - www.instaforex.com |
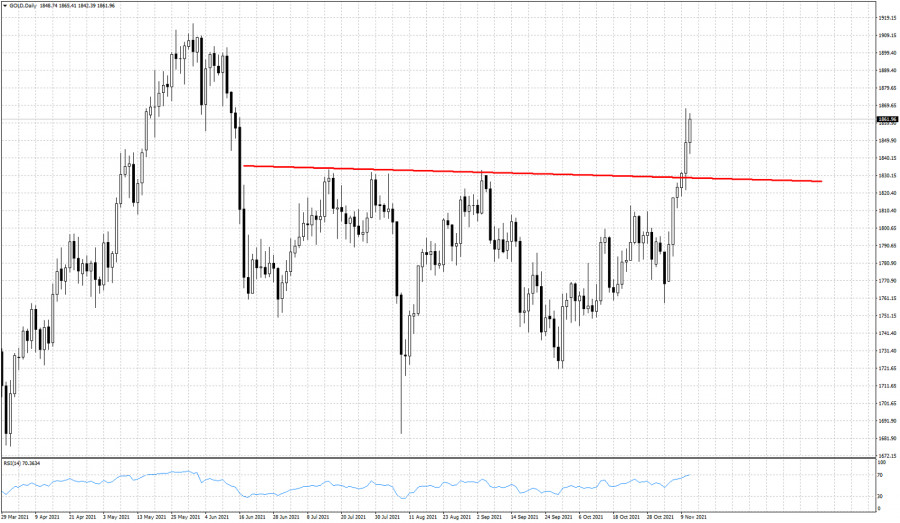
| Short-term technical analysis on Gold for November 11, 2021. Posted: 11 Nov 2021 01:25 PM PST Gold price broke out and above the Head and Shoulders pattern yesterday. Today price has recapture $1,860 and this is a positive sign. Despite Dollar strength, Gold price remains in a bullish trend.
A back test towards $1,825 is not out of the question. Short-term trend remains bullish but a back test is justified. This does not mean we should expect a pull back. Any pull back is considered a buying opportunity. Gold price has potential to reach $1,950 and I do not expect to see a move higher as a straight line. I expect to see price form higher highs and higher lows. The material has been provided by InstaForex Company - www.instaforex.com |
| Inflation fuels the dollar's ambition, but what if the Fed fails Posted: 11 Nov 2021 01:24 PM PST
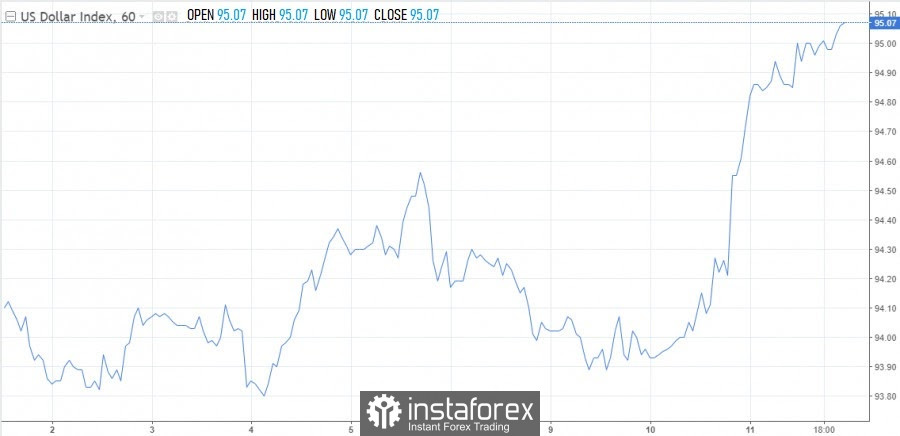
Shocking data on inflation in the United States echoed throughout the foreign exchange market. The dollar has jumped and is trying to overcome the 95.10 barrier on the index. Concerns about price pressures in the global economy have intensified among investors. Now they have begun to wonder not only whether the Fed will start raising rates next year, but also about the timing and scale of policy tightening. The American regulator cannot but react to such a price increase, economists say. Therefore, before the next meeting, which is scheduled for December 15, turbulence in the markets will increase. Why is inflation increasing and who can stop it? In terms of inflation, the Fed is seen as a lifeline, but is the regulator able to cope with this process on its own? To answer this question, first you need to clarify the factors contributing to the increase in inflation. There are two of them, this is an increase in energy prices (gasoline is getting more expensive for the same reason) and a shortage of semiconductors (new cars are getting more expensive). The problems contributing to the acceleration of inflation did not appear yesterday, and they are unlikely to be within the power of the Fed. Can the Central Bank solve the issue of rising gasoline prices? This is a stone in the garden of the American government. It's not that there have been no attempts from the authorities, Joe Biden is trying, but unsuccessfully. It is not possible to put pressure on OPEC, we will have to extract strategic oil reserves to increase supply at least within the framework of our state. There is another idea – the Democrats proposed to ban oil exports to the United States. Some actions will be taken. High inflation began to hit Biden's rating harder, who immediately after the release of unpleasant statistics called the task of slowing price growth paramount. Oil shortages and logistical problems are where the root of the problem lies. Will the Fed be able to establish logistical ties and solve the oil shortage by raising the rate? Of course not. Consequently, accelerating inflation should not push the US Central Bank to raise the rate earlier, as the markets expect, since inflation is not monetary in structure. At the same time, the dollar rose on market expectations of an earlier tightening of policy. This was the first reaction–impulsive, thoughtless and, perhaps, excessive. Investors will be impressed by the inflation data for some time. As a sober assessment of the situation, a correction of the dollar may occur. In general, the forecast for the US currency remains unchanged, what is happening is only good. The greenback is expected to continue to grow over a long distance, but not so much and not without multi-day pullbacks. The macroeconomic and technical picture speak in favor of continued growth of the dollar in the short term. So far, the index has managed to stay above the previous highs near 94.50, but it can continue to grow straight to the round mark of 96.00.
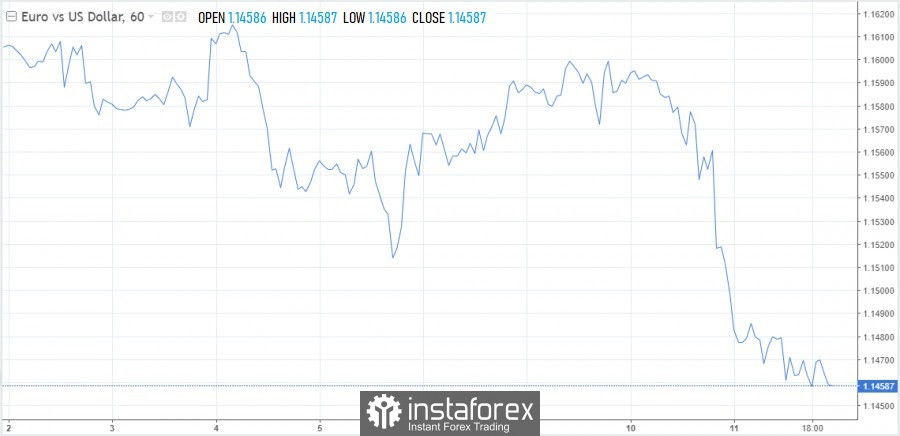
Among the winners from inflation in the United States are the dollar and gold, and among the victims are the euro. Experts call the root cause of the fall of the EUR/USD pair with an increase in the spread between US and German government bonds. The euro is likely to remain under pressure until the end of the week. The 1.1300 level appeared on the radar. At the moment, the pair has reached the overbought area, but there are no signs of a reversal yet. Support is marked at 1.1450, 1.1410 and 1.1370. The resistance is 1.1515, 1.1550, 1.1600.
|
| Macron's message to the people of France, mandatory third dose and nuclear reactors Posted: 11 Nov 2021 01:24 PM PST
There are five months left until the presidential elections in France, but the current president Emmanuel Macron has not yet confirmed his participation in the April race for the post of head of state. However, if you listen to his fiery speech addressed to his people last Tuesday, the French president still plans to stand for election. The ambitious national message of Macron, broadcasting from the Elysee Palace on the main French TV channels, concerned the country's economy and health. The President voiced optimistic prospects for the development of economic indicators, but at the same time recalled that the country's recovery could be disrupted by difficulties with hiring for companies, disrupted supply chains and the inflation that follows. One of the problems Macron called the next wave of coronavirus, which could overwhelm the population of France this winter if they refuse to give themselves a third dose of the vaccine. The President promised that the government of the country will henceforth approach vaccination with booster versions of vaccines with all rigor, not forgiving its people of self-will. From December 15, revaccination in the country will become a prerequisite for confirming a sanitary pass. All residents of France, including people over 65 years of age, should be vaccinated with booster drugs. Those who for some reason do not want to do this will be deprived of the privileges that they were entitled to after the introduction of the first two doses of vaccines, that is, they will not be able to visit restaurants, bars and cinemas. "Get vaccinated to protect yourself. Get a third vaccination to live normally," Macron said. However, unlike the United States, where children aged 5 to 11 years have already started to be vaccinated, in France they do not risk doing this yet. But at the same time, wearing protective masks is mandatory in schools. The President also announced the extension of the system of sanitary passes until the end of July 2022 (before that it was valid until November 15). According to official data, currently about 75% of the French population is fully vaccinated. Macron's rivals also speak to French citizens, but not everyone has the theme of health and vaccinations as a leitmotif in their appeals. For example, the far-right TV presenter and publicist Eric Zemmour, who may well challenge Emmanuel Macron and outstrip the main rival of President Marine Le Pen, avoids vaccination topics in his appeals to the population, and bypasses economic development. He is mainly concerned with the country's security problems and immigration. In his message to the population, the French president also announced the construction of EPR-type nuclear reactors on the territory of the country in the coming years. This is an important step for France's transition to carbon-free energy production. By the way, before that, the Macron government announced investments in small modular nuclear reactors (MMR) in the amount of about one billion euros. During his presidential term, Macron has faced many difficulties: the pandemic and its consequences for the economy, the "yellow vests" movement, the strikes on the pension reform plan and the failure in the recent local elections. At the same time, the head of France tightened the conditions for receiving unemployment benefits and abolished the popular wealth tax (conservatives tried to do this before him, but failed). Macron's government has also provided subsidies to support households that have been more affected by high energy prices. The material has been provided by InstaForex Company - www.instaforex.com |
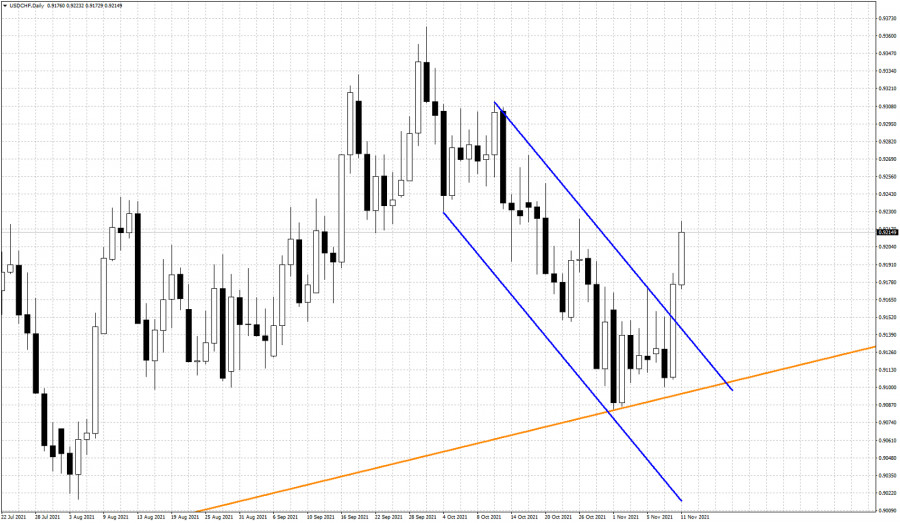
| Posted: 11 Nov 2021 01:19 PM PST Since last week when price reached the 0.91 support level where we find the upward sloping channel, we turned bullish expecting a reversal and a move at least towards 0.9220. Confirmation of this idea was the break above 0.9150.
Orange line - support trend line USDCHF has reached and surpassed our first bounce target which was at 0.9220. Short-term trend remains bullish and after the channel breakout and trend line back test, we remain confident that USDCHF will reach higher levels. It is important however for price not to break below 0.91. This would be considered a sign of weakness. The material has been provided by InstaForex Company - www.instaforex.com |
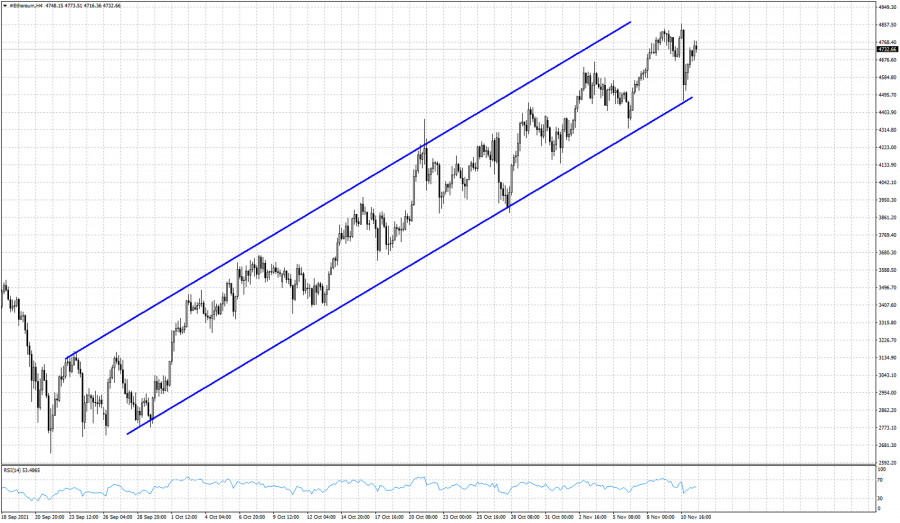
| Ethereum continues to trade inside bullish channel. Posted: 11 Nov 2021 01:16 PM PST Ethereum made a pull back towards $4,465 but price respected the channel boundaries. A new upward has followed and as long as price is above yesterday's lows, bulls remain in charge of the trend and are expected to push price to new highs.
Ethereum continues to trade inside the upward sloping blue channel. The lower channel boundary continues to be respected. Price continues making higher highs and higher lows. Support is at yesterday's low around $4,450. Holding above this level is key for the bullish trend. The RSI continues to provide bearish divergence signals. Traders need to be cautious. The material has been provided by InstaForex Company - www.instaforex.com |
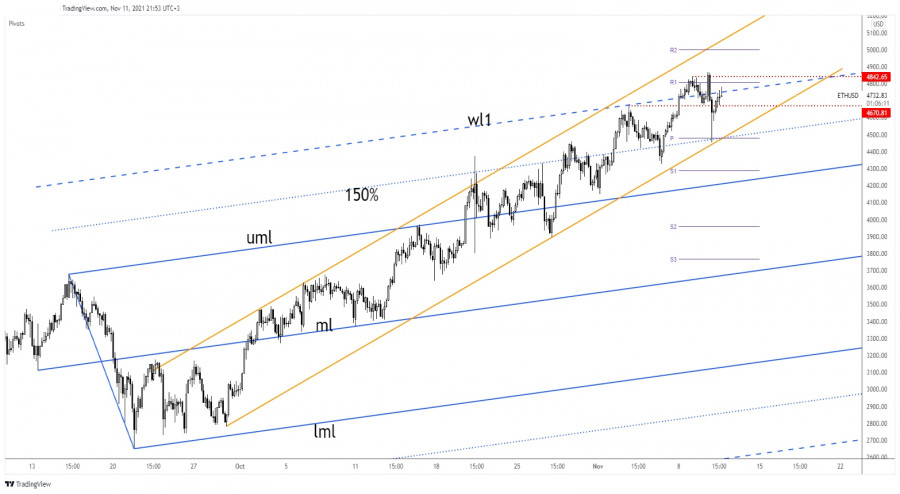
| Ethereum upside confirmed once again Posted: 11 Nov 2021 12:21 PM PST Ethereum plunged after reaching a fresh all-time high of 4,868.79 level. It has dropped as much as 4,452.86 yesterday. The retreat was a strong one, around 8.54%, but the buyers are still strong and have taken the lead again. At the moment of writing, ETH/USD was trading at 4,755.80. The crypto dropped also because the price of Bitcoin has retreated after reaching a fresh historical high. Ethereum maintains a bullish bias despite temporary declines. Actually, a minor retreat helps the buyers to go long again. ETH/USD false breakdown with great separation
Technically, its failure to stay above 4,842.65 signaled a potential correction. ETH/USD stands within an ascending channel, so the outlook is bullish. It has registered a false breakdown with great separation below the 150% Fibonacci line of the Ascending Pitchfork and under the weekly pivot point (4,480.49) signaling strong upside pressure. It has failed to retest the uptrend line and now it challenges the Ascending Pitchfork's warning line (wl1). In the short term, ETH/USD could move sideways trying to accumulate more bullish energy before jumping higher. Ethereum forecastYesterday's pin bar, the false breakdown with great separation signaled strong buyers. A minor consolidation, a range pattern, or any other continuation formation could confirm an upside continuation. Also, a valid breakout above the 4,842.65 level could validate further growth towards the 5,000 psychological level. The material has been provided by InstaForex Company - www.instaforex.com |
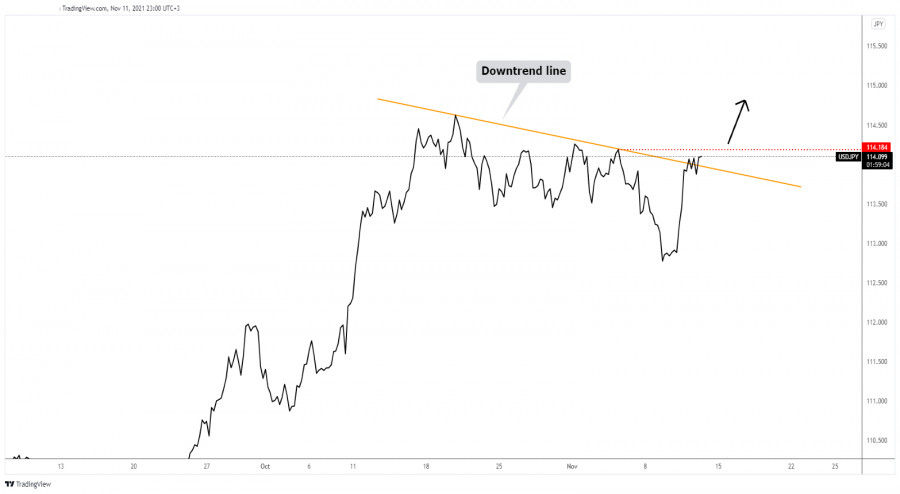
| USD/JPY further growth awaits confirmation Posted: 11 Nov 2021 12:19 PM PST
USD/JPY upside breakoutThe USD/JPY pair failed to resume its downside movement and now it has managed to jump above the downtrend line. Stabilizing above the downtrend line could signal further growth. You should be careful because failing to stay above this line could announce a potential downside movement. 114.18 former high is seen as an upside obstacle, as a resistance level. So, stabilizing above the downtrend line and passive above 114.18 could activate an upside continuation. USD/JPY trading conclusionJumping above 114.18 could represent a buying opportunity. This scenario may confirm that USD/JPY could resume its upwards movement. The material has been provided by InstaForex Company - www.instaforex.com |
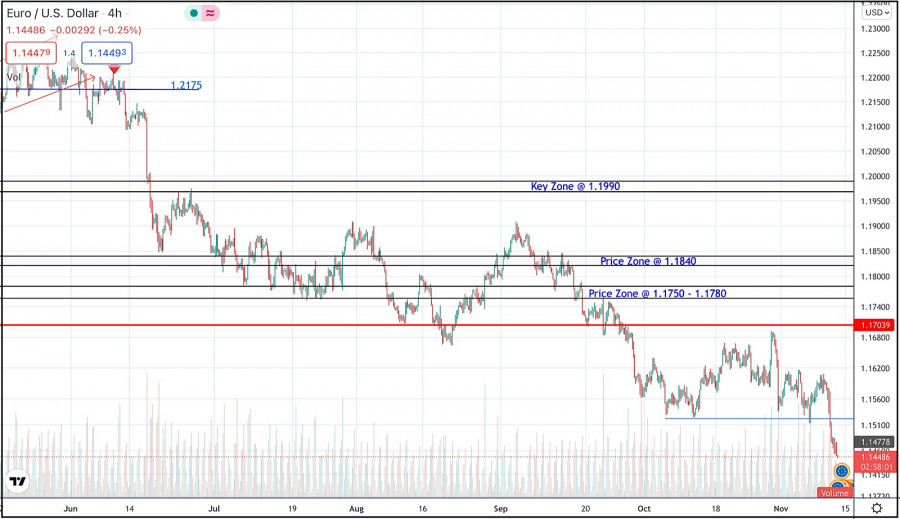
| November 11, 2021 : EUR/USD daily technical review and trading opportunities. Posted: 11 Nov 2021 11:13 AM PST
Recently, Persistence below the depicted price zone of 1.1990 indicated further downside movement towards 1.1840 and 1.1780 where a sideway consolidation range was established. During last week, the EURUSD pair has been trapped within a narrow consolidation range between the price levels of 1.1780 and 1.1840. A bullish breakout was executed above 1.1840 shortly after. Temporary Upside pullback was expected towards 1.1990. However, re-closure below the price level of 1.1840 has initiated another downside movement towards 1.1780 which failed to hold prices for a short period of time before significant upside movement was presented into market. Intraday traders were advised to wait for candlestick closure above 1.1780 - 1.1840 for another ascending swing to be initiated. However, immediate downside selling pressure brought the pair down below 1.1700. More downside movement took place towards the price level of 1.1600 where significant buying pressure existed. Market price slided below 1.1700 and 1.1600. This has enhanced further decline towards 1.1500. Currently, the price zone around 1.1700 stands as a prominent supply-zone to be watched for SELLING pressure and a possible SELL Entry upon any upcoming ascending movement. Currently, it is not advised to add new SELL Entries as the pair already looks oversold. The material has been provided by InstaForex Company - www.instaforex.com |
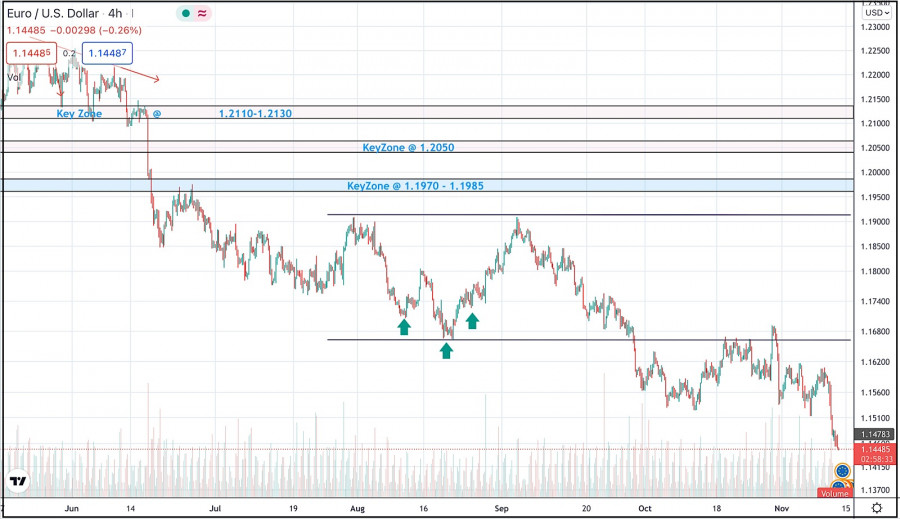
| November 11, 2021 : EUR/USD Intraday technical analysis and trading plan. Posted: 11 Nov 2021 11:12 AM PST
Bearish persistence below the price zone of 1.2050-1.2000 allowed the recent downtrend to be established. So, the EURUSD pair has expressed significant bearish decline while the price level of 1.1650 stood as a prominent demand level that prevented further bearish decline. The bullish pressure that originated around 1.1650 failed to push higher than the price level of 1.1900. That's why, another bearish pullback towards 1.1650 was executed. Bullish signs were expected around the price levels of 1.1650-1.1700 as it corresponded to a recent previous bottom. However, extensive bearish decline has pushed the EURUSD pair towards 1.1600 and lower levels was about to be reached if sufficient bearish momentum was maintained. Moreover, significant bullish recovery has originated recently upon testing the price level of 1.1570. The recent bullish pullback towards 1.1650-1.1680 was expected to offer bearish rejection and a valid SELL Entry. Significant bearish decline brought the EURUSD pair again towards 1.1550 levels which stood as an Intraday Support zone. Hence, sideway movement was expected until bearish decline occurred again Please note that any Bullish movement above 1.1680 should be considered as an early exit signal to offset any SELL trades. The material has been provided by InstaForex Company - www.instaforex.com |
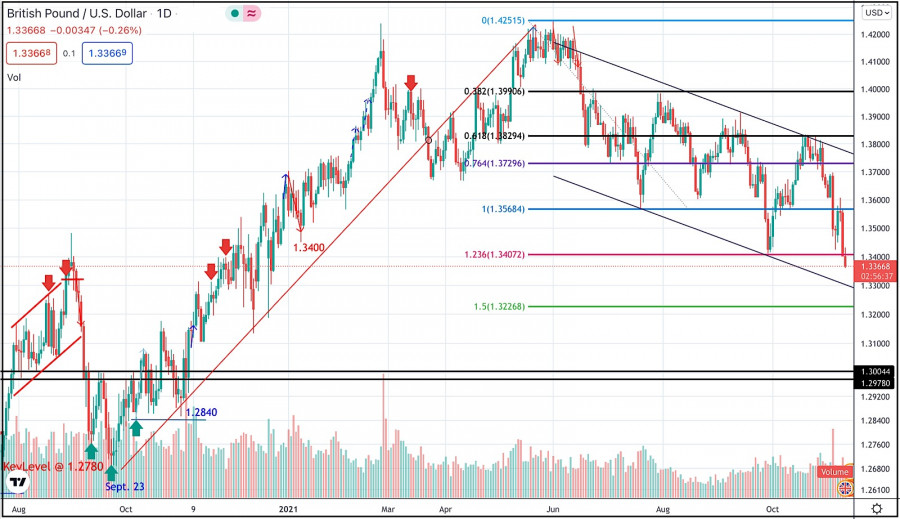
| November 11, 2021 : GBP/USD Intraday technical analysis and significant key-levels. Posted: 11 Nov 2021 11:10 AM PST
The GBPUSD pair has been moving sideways with some bearish tendency while bearish breakout below 1.3600 was needed to enhance further bearish decline. On the other hand, the nearest SUPPLY level was located around 1.4000 where bearish rejection and a valid SELL Entry was anticipated. The recent bullish rejection witnessed around 1.3600 as well as the temporary bullish breakout above 1.3830 indicated a high probability that this bullish movement may pursue towards 1.4025 then 1.4100. However, the pair remained trapped within a fixed price range until significant bearish momentum emerged into the market. Bearish breakout below 1.3680 enabled further bearish decline towards 1.3400 which corresponded to 123% Fibonacci Level of the most recent bearish movement. This was a good entry level for a corrective bullish pullback towards 1.3650 and 1.3720 which was temporarily bypassed. Shortly after, the pair was testing the resistance zone around 1.3830 where bearish pressure originiated into the market. Currently, the short-term outlook is bearish as long as the pair maintains its movement below 1.3730 and 1.3570. Another bearish visit was expected towards 1.3400 where significant bullish rejection was expressed as it corresponded to significant Fibonacci Expansion Level. Any bearish decline below it will probably enable more bearish extension towards 1.3270. On the other hand, the price level of 1.3570 stands as an intraday resistance level to be watched either for bearish reversal or a continuation pattern upon any upcoming visit. The material has been provided by InstaForex Company - www.instaforex.com |
| Posted: 11 Nov 2021 10:45 AM PST |
| Posted: 11 Nov 2021 10:33 AM PST Analyzing Thursday trades EUR/USD on M30 chart
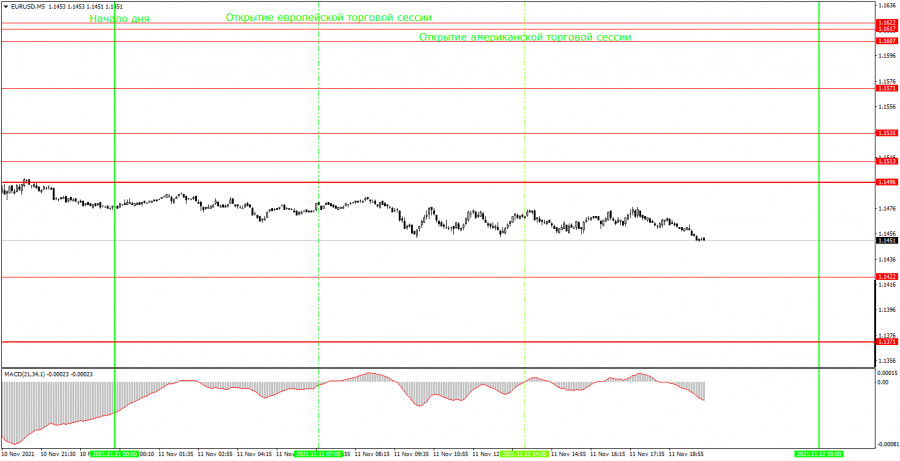
On Thursday, the EUR/USD pair was trading as usual, with daily volatility of just over 30 pips. Besides, a full-fledged flat movement was observed throughout the day. In the evening, the bearish pressure on the pair resumed, resulting in a slight decline or, rather, the continuation of the downward movement. Formally, the pair is moving downwards at the moment after breaking through the ascending line. However, this trend does not even have two pivot points to form its own trendline. Thus, the trend is very difficult to trade with, especially for beginners who usually work with the most simple analysis tools. Anyway, the US dollar continues to strengthen after yesterday's report on US inflation which rose to 6.2% on a yearly basis. Today, no important fundamental news or economic releases have been published either in the US or the EU. This partly explains such weak volatility. EUR/USD on M5 chart
On the 5-minute time frame, there was hardly any movement on Thursday. Although the market stabilized later in the afternoon, there was a clear sideways movement most of the day with minimum volatility of less than 30 pips. Moreover, the price did not even approach the levels at which a trading signal could have been formed. This is partly because few levels can be seen near these price values. The price has not been at such low levels for more than 10 months. So, the illustration depicts mostly strong levels but almost does not show the weak ones which in most cases represent the lows and highs of the day. The quotes also failed to reach the nearest level of 1.1422. So, today turned out to be an unplanned day off for traders. Trading tips on Friday On the 30-minute time frame, the pair continues to move down although the MACD indicator is pointing upwards. This is another disadvantage of such a movement that we have observed lately. In other words, the movement is so weak that the MACD indicator does not react to it. Today, quotes have passed a little more than 30 pips. This is a very small distance even for the euro/dollar pair. However, the movement may continue with the target of 1.1371. On the 5-minute time frame, the key levels for November 12 are located at 1.1371, 1.1422, 1.1496, 1.1513, and 1.1535. Take Profit should be set at a distance of 30-40 points. Stop Loss should be placed to a breakeven point as soon as the price passes 15 pips in the right direction. . On the M5 chart, the nearest level could serve as a target unless it is located too close or too far away. If it is, then you should act according to the situation or trade with a Take Profit. On Friday, beginners will again have nothing to pay their attention to, since neither the US nor the EU will publish any important macroeconomic reports. In theory, the consumer sentiment index from the University of Michigan can affect the market sentiment, but the likelihood is low. Basic rules of trading 1) The signal strength is determined by the time the signal took to form (a bounce or a breakout of the level). The quicker it is formed, the stronger the signal is. 2) If two or more positions were opened near a certain level based on false signals (which did not trigger a Take Profit or test the nearest target level), then all subsequent signals at this level should be ignored. 3) When trading flat, a pair can form multiple false signals or not form them at all. In any case, it is better to stop trading at the first sign of a flat movement. 4) Trades should be opened in the period between the start of the European session and the middle of the US trading hours when all positions must be closed manually. 5) You can trade using signals from the MACD indicator on the 30-minute time frame only given that volatility is strong and there is a clear trend that should be confirmed by a trend line or a trend channel. 6) If two levels are located too close to each other (from 5 to 15 pips), they should be considered support and resistance levels. On the chart Support and Resistance Levels are the levels that serve as targets when buying or selling the pair. You can place Take Profit near these levels. Red lines are channels or trend lines that display the current trend and show in which direction it is better to trade now. The MACD indicator (14, 22, and 3) consists of a histogram and a signal line. When they cross, this is a signal to enter the market. It is recommended to use this indicator in combination with trend patterns (channels and trend lines). Important announcements and economic reports that you can always find on the economic calendar can seriously influence the trajectory of a currency pair. Therefore, at the time of their release, we recommend trading as carefully as possible or exiting the market in order to avoid sharp price fluctuations. Beginners on Forex should remember that not every single trade has to be profitable. The development of a clear strategy and money management is the key to success in trading over a long period of time. The material has been provided by InstaForex Company - www.instaforex.com |
| Analysis of EUR/USD for November 11; Joe Biden urges Congress to fight against inflation Posted: 11 Nov 2021 10:28 AM PST |
| Litecoin: $400 not a joke, but a new price benchmark in the flesh Posted: 11 Nov 2021 10:10 AM PST
Well-known analyst Peter Brandt is confident that the bullish mood will continue in the long term, and the cryptocurrency will overcome new highs following the upward trend. Litecoin is in high demand among institutional investors, and it looks like new highs are just around the corner. During this week, the altcoin's price has increased by more than 40%, and now Litecoin is trading at $266. Altcoin updated its half-year highs and broke out from the resistance level, which was around $232. Now you can observe a significant increase in activity, based on the indicators of on-chain activity, which accompanies the growth of the cryptocurrency. The volume of perpetual swaps has crossed the $7 billion milestone, and the demand for altcoin has increased significantly. Altcoin will be trading at the $400 turn. Brandt believes that once the September highs are overcome, the altcoin will again be able to retest the 2021 highs at around $395. After breaking this mark, physical resistance and psychological level at around $400 will follow. LTC continues to be in an upward trend as Walmart uses Litecoin and allows buyers to pay with cryptocurrency for purchases, however, according to official figures, it turned out that this was nothing more than rumors, but they allowed Litecoin to rise in price. The altcoin is now consolidating above the 100 percent Fibonacci level. If the bullish sentiment continues and the demand for altcoin continues to increase, more and more new buyers for the crypto asset will appear. The next stop should be at $400. However, if Litecoin falls below the $232 mark this month, it could trigger a massive sell-off and become a big obstacle to updating new all-time highs. However, for now, the cryptocurrency is in the tight grip of the bulls. The material has been provided by InstaForex Company - www.instaforex.com |
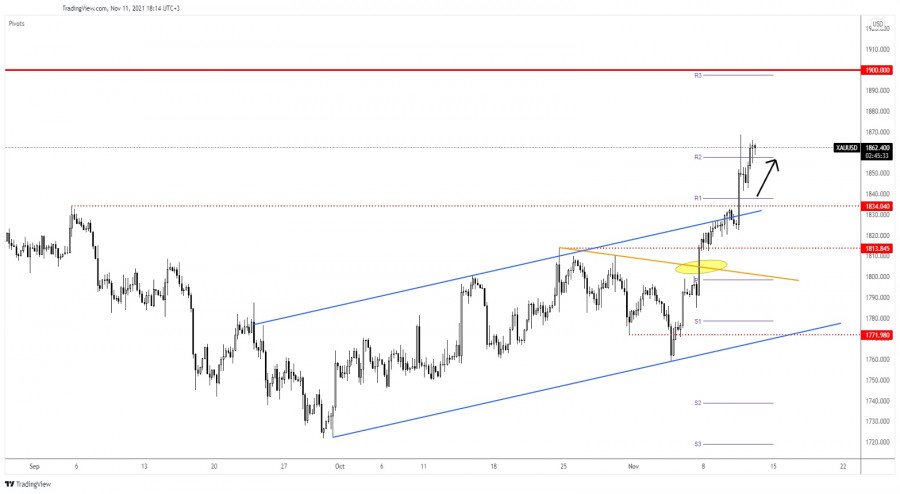
| Gold Approaches 1,868.62 yesterday Posted: 11 Nov 2021 08:37 AM PST The price of Gold is trading at the 1,860.97 level and it seems strong enough to be able to resume its growth. Despite the DXY's growth, the yellow metal has managed to jump higher and now is almost to stabilize above a static resistance. As you already know, the price of gold rallied yesterday after the US reported higher than expected inflation. XAU/USD is very attractive after ignoring the 1,834.04 upside obstacle. Tomorrow, the US JOLTS Job Openings and the Prelim UoM Consumer Sentiment could bring more action. Technically, the Dollar Index could retreat a little after its amazing rally. This situation could help XAU/USD to approach and reach new highs. XAU/USD Ended Its Retreat!
XAU/USD is back above the weekly R2 of 1,857.83. Yesterday, it has registered only a false breakout with great separation above this obstacle. It has failed to reach and retest the weekly R1 (1,837.97) and the 1,834.04 support levels signaling strong buyers. A minor consolidation here above the R2 could indicate an upside continuation and could bring new long opportunities. Gold Forecast!XAU/USD is bullish after taking out the 1,834.04 upside obstacle. Despite temporary retreats or sideways movements, the price of gold could jump higher. 1,900 psychological level is seen as the next major upside target. The material has been provided by InstaForex Company - www.instaforex.com |


| You are subscribed to email updates from Forex analysis review. To stop receiving these emails, you may unsubscribe now. | Email delivery powered by Google |
| Google, 1600 Amphitheatre Parkway, Mountain View, CA 94043, United States | |


Comments