Forex analysis review
Forex analysis review |
- Forecast and trading signals for GBP/USD for November 4. Detailed analysis of the movement of the pair and trade deals. The
- Forecast and trading signals for EUR/USD on November 4. Detailed analysis of the pair's movement and trade deals. The euro
- Overview of the EUR/USD pair. November 4. Macroeconomic statistics and Christine Lagarde's speech.
- How to trade EUR/USD on November 4? Simple tips for beginners. Flat becomes more and more interesting every day
- Shiba Inu Cryptocurrency (SHIB). Yesterday, a certain holder withdrew more than three billion US dollars in cryptocurrency,
- Is the Bank of England ready for a rate hike? What will happen to the pound
- Bitcoin under massive upside pressure
- USD/CAD upside reversal
- Trading plan for GBP/USD on November 4. Simple tips for beginners. GBP on solid footing ahead of two central banks' meetings
- Wave analysis of GBP/USD for November 3; UK's Business activity is growing so is the pound sterling
- November 3, 2021 : EUR/USD daily technical review and trading opportunities.
- November 3, 2021 : EUR/USD Intraday technical analysis and trading plan.
- November 3, 2021 : GBP/USD Intraday technical analysis and significant key-levels.
- Wave analysis of EUR/USD for November 3; ECB will not tighten monetary policy next year
- AUD/NZD. Neighborhood Confrontation: New Zealand dollar starts and wins
- Trading signal for Ethereum (ETH) on November 03-04, 2021: buy in case of rebound from 4,375 (SMA 21)
- JPMorgan experts compared gold and bitcoin volatility, says BTC price is twice overstated
- Bitcoin hints new momentum: up or down?
- Trading signal for USD/JPY on November 03-04, 2021: buy above 113.96 (SMA 21)
- Trading signal for EUR/USD on November 03-04, 2021: sell below 1.1587 (SMA 21)
- Video market update for November 03,2021
- Medium-term analysis on EURUSD.
- Gold remains vulnerable to more downside.
- USDCHF inside bearish channel, but price expected to make a trend reversal.
- XRPUSD challenges major short-term resistance.
| Posted: 03 Nov 2021 07:54 PM PDT GBP/USD 5M
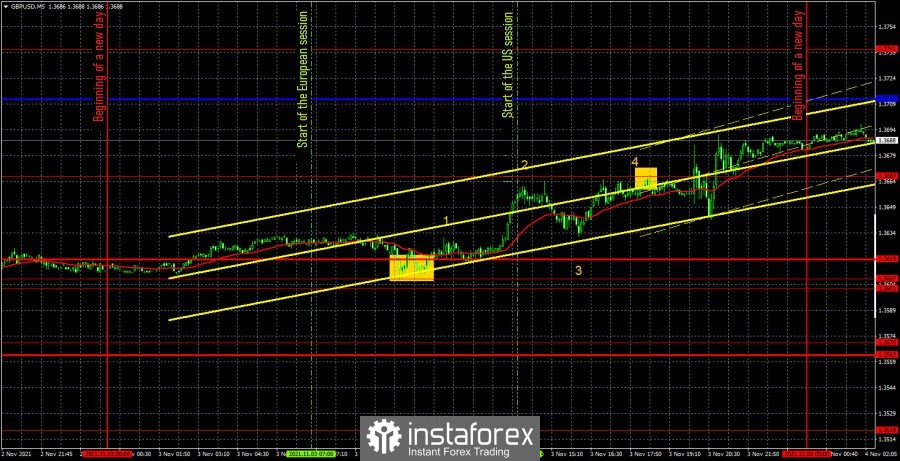
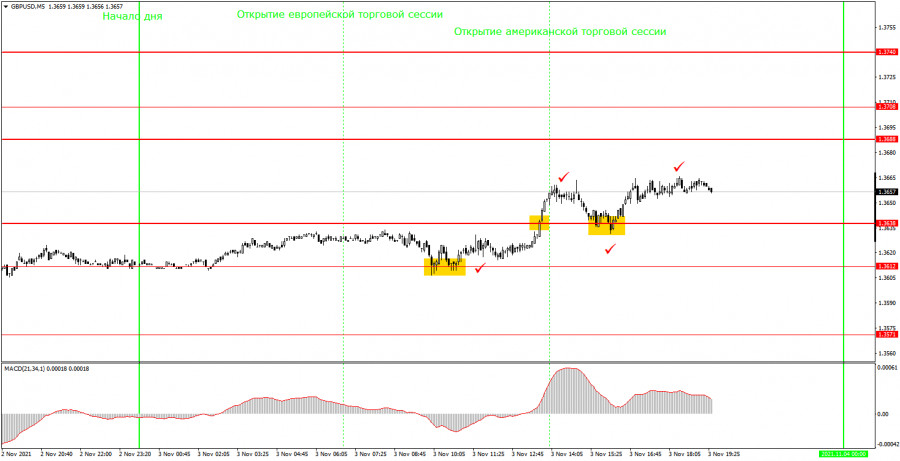
The GBP/USD pair traded rather sluggishly on November 3. The volatility of the environment was up to the moment of publication of the results of the Federal Reserve meeting, which is very little for the pound. And this despite the fact that there were quite important macroeconomic publications in the US during the day, and Bank of England Governor Andrew Bailey made a speech in the UK. However, the markets did not find it necessary to process this information. As we can see in the chart above, only the ISM service business activity index could theoretically influence the pair's movement, since it was at this time (the number "3" in the chart) that the direction of movement changed. However, the problem is that the ISM index turned out to be more positive than the analysts' forecasts, and rose to 66.7 points in October. Thus, after its publication, the dollar was supposed to rise in price, not fall in price. All other events of the day did not cause any reaction from the markets at all. The number "1" - business activity in the UK services sector. The number "2" is the US ADP report. Number "4" - Bailey's speech. As a result, it remains for us to consider only trading signals that were formed during the day and remind that we do not recommend considering signals in the evening, since lower timeframes involve intraday trading. Consequently, before the evening FOMC results were published and the press conference with Jerome Powell. Traders should have already left the market anyway. However, they did just that if they followed our recommendations. During the day, only one buy signal was generated when the price bounced off the 1.3607 level. After that, the pair went up about 40 points and stopped near the extremum level of 1.3667, from which it rebounded with an error of 1 point. It was at this moment that long positions should have been closed in a profit of about 30 points. Thus, despite the strong "foundation" and "macroeconomics", only one signal was formed, which made it possible to earn, despite the weak volatility. GBP/USD 1H
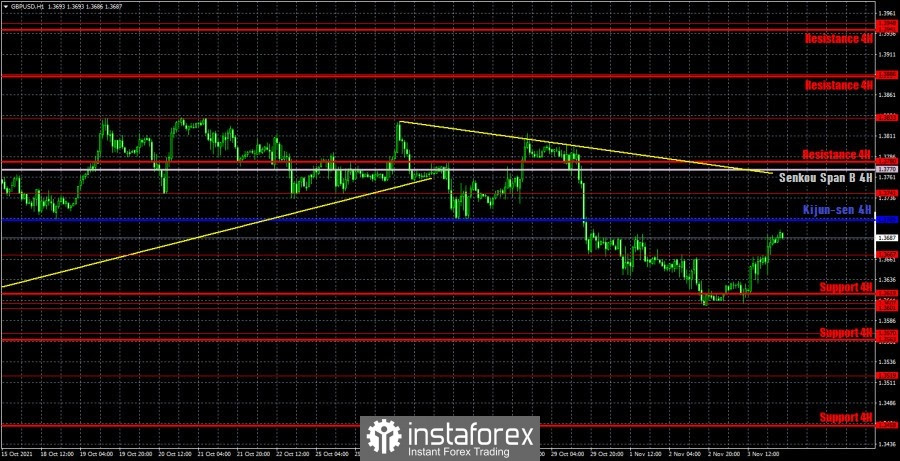
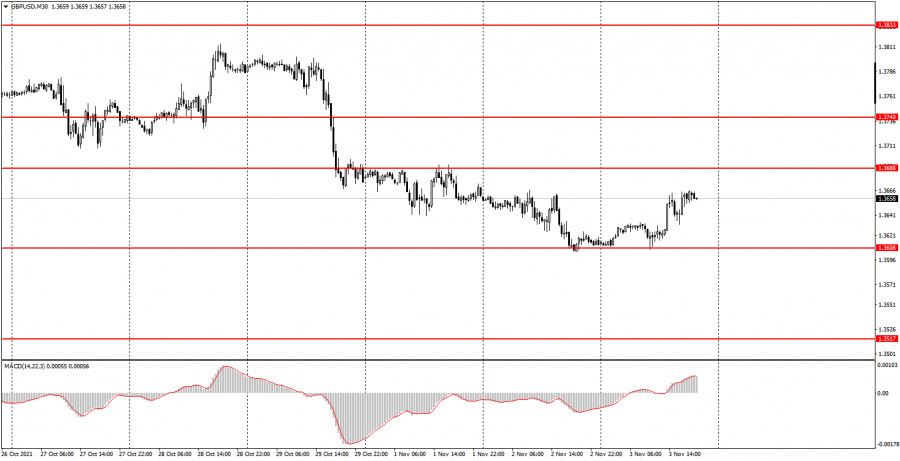
On the hourly timeframe, the pound/dollar pair is trying with all its might to continue the downward movement and even formed a downward trend line, which, however, it has a very small slope and is therefore, weak. However, the very movement of the pair in recent days is also not distinguished by special strength. So far, the downward trend continues, but it practically does not limit the pair in a possible upward movement. On November 4, we distinguish the following important levels: 1.3519, 1.3570, 1.3601 - 1.3607, 1.3667, 1.3741. Senkou Span B (1.3770) and Kijun-sen (1.3709) lines can also be signal sources. It is recommended to set the Stop Loss level at breakeven when the price passes in the right direction by 20 points. The Ichimoku indicator lines can move during the day, which should be taken into account when looking for trading signals. The results of the Bank of England meeting will be summed up in the UK on Thursday. And this is undoubtedly the most important event of the day. Everything will depend on whether important decisions are made by the British central bank, or whether at least its rhetoric changes in a slightly more hawkish direction? If not, then the markets may not react in any way to this event. We also have Bailey's speech today and a report on business activity for the construction sector. Thus, in general, the fundamental background may be strong today, but the market's reaction is unpredictable. You need to be prepared for any scenario. We recommend you to familiarize yourself: Overview of the EUR/USD pair. November 4. Macroeconomic statistics and Christine Lagarde's speech. Overview of the GBP/USD pair. November 4. Ahead of the Bank of England meeting. Forecast and trading signals for EUR/USD for November 4. Detailed analysis of the movement of the pair and trade deals. COT report
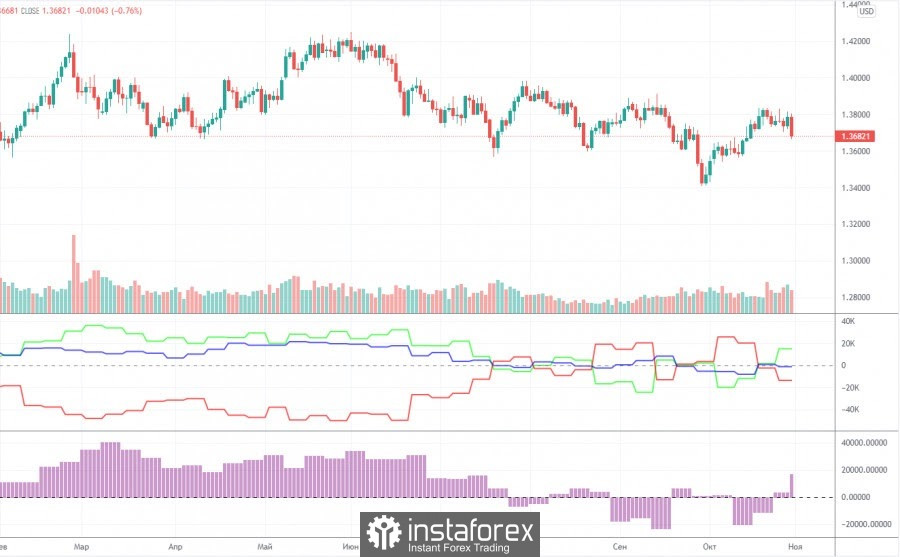
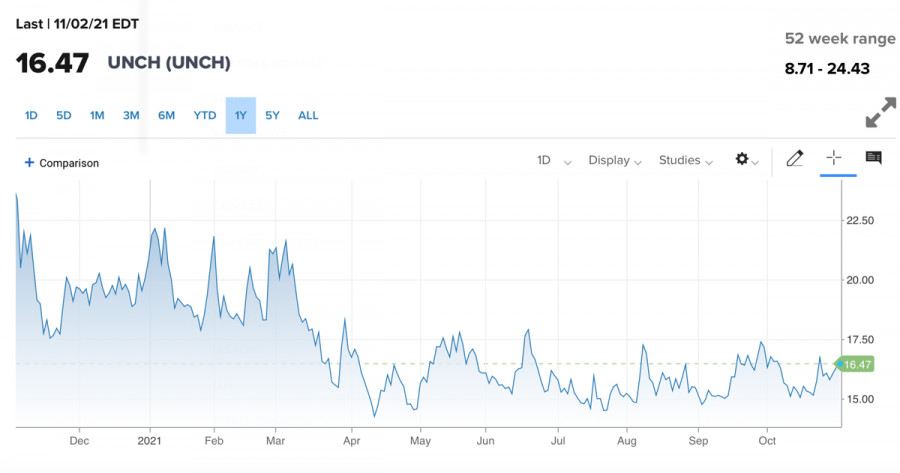
The mood of professional traders became more bullish during the last reporting week (October 19-25). The situation with the COT reports is now even more ambiguous than with the technical picture. And if we compare the COT reports for the euro and the pound, the situation becomes even stranger. Both indicators in the chart above show that the major players still do not have any clear, precise and understandable mood. Consequently, it simply does not make sense to make any forecasts based on COT reports now. The chart above clearly shows the pair's entire movement over the past six months. It is rather difficult to call it a trend or even a trend. The mood of the big players has been constantly changing in the last couple of months. The green and red lines of the first indicator (net positions of groups of traders "commercial" and "non-commercial") are constantly changing the direction of movement, constantly crossing the zero mark. This means that the two largest groups of traders are constantly increasing and decreasing their net positions. During the reporting week, professional traders opened 2.8 thousand buy contracts (longs) and closed 10.7 thousand sell contracts (shorts). Thus, their net position increased by 10,000 contracts. This is in line with what has been happening with the pound in recent weeks (it is growing). Nevertheless, it is impossible to make a long-term forecast, since the net position may fall already by the end of next week. Especially considering the fall of the pound itself on Friday. Explanations for the chart: Support and Resistance Levels are the levels that serve as targets when buying or selling the pair. You can place Take Profit near these levels. Kijun-sen and Senkou Span B lines are lines of the Ichimoku indicator transferred to the hourly timeframe from the 4-hour one. Support and resistance areas are areas from which the price has repeatedly rebounded off. Yellow lines are trend lines, trend channels and any other technical patterns. Indicator 1 on the COT charts is the size of the net position of each category of traders. Indicator 2 on the COT charts is the size of the net position for the non-commercial group. The material has been provided by InstaForex Company - www.instaforex.com |
| Posted: 03 Nov 2021 07:54 PM PDT EUR/USD 5M
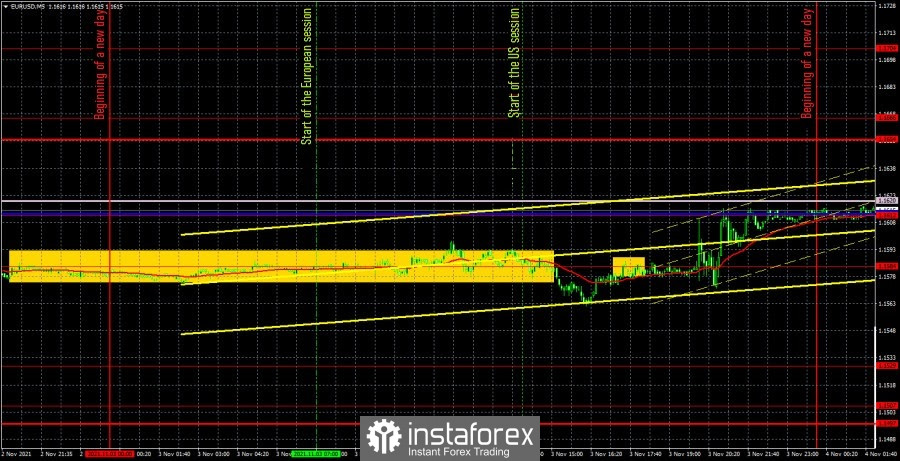
The EUR/USD pair showed volatility equal to... 36 points on Wednesday. Point. The volatility data are calculated prior to the release of the results of the Federal Reserve meeting. Obviously, during the publication of such important data, volatility is rising, but at the same time, traders should have already left the market by this time. Thus, in any case, we are not too interested in the evening movements of the EUR/USD pair. Moreover, they may be absolutely inconsistent with the nature of the published information. In general, we will consider the pair's movement only for the part of the day when traders could trade. Macroeconomic reports in this part were also available, but judging by the 36 points of volatility, traders did not pay any attention to it. And even if they did, is anyone interested in a 10-point market reaction? Thus, we can assume that the report on European unemployment, Market participants "passed" European Central Bank President Christine Lagarde's speech, the report on the change in the number of employed in the US ADP private sector, the indexes of business activity in the US services sector. We did not even begin to plot the time of the release of this data on the chart, but instead plotted one long rectangle, which indicates an absolute flat during the day. Moreover, this flat began a day earlier. As you might guess, no trading signals were generated during the past day. The only more or less significant signal was formed near the level of 1.1584 in the late afternoon. However, the closeness of the evening and the announcement of the results of the FOMC meeting did not allow traders to enter the market on this signal. Thus, yesterday had a frankly semi-holiday status. The Fed meeting and its results will be discussed in today's articles. EUR/USD 1H
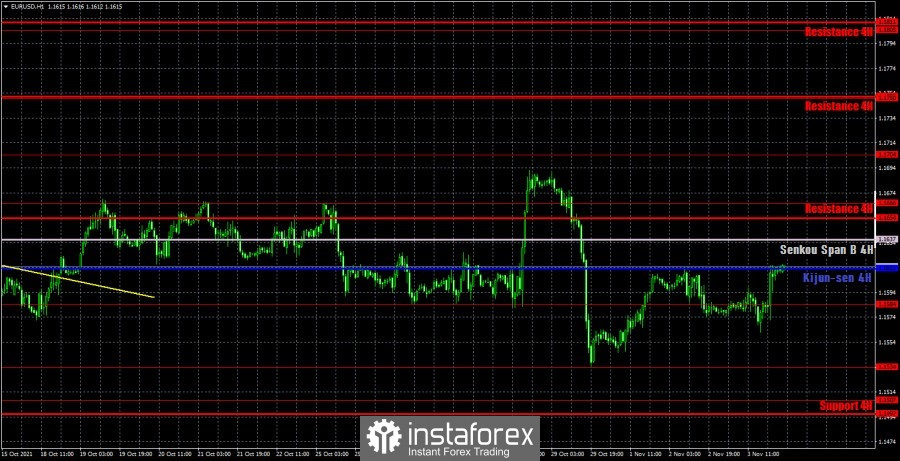
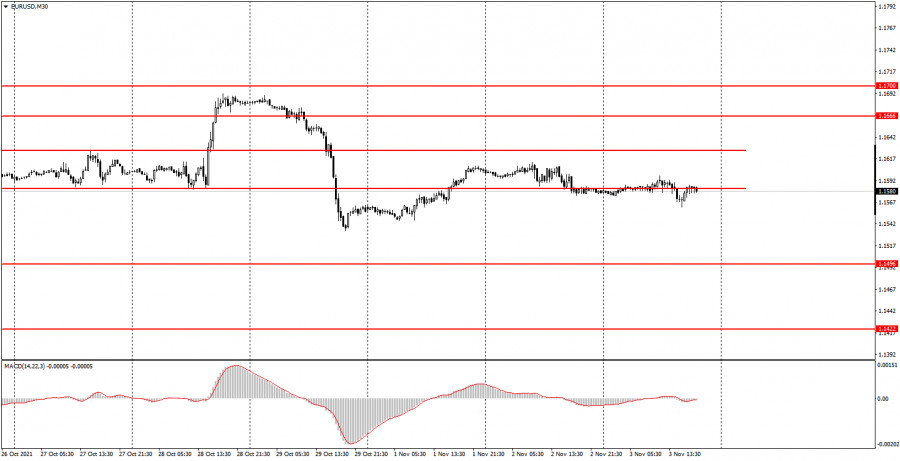
On the hourly timeframe, all of yesterday's movements are absolutely unimportant. Recall that at this time there is no trend on this timeframe, the pair's quotes were in absolute flat with low volatility for most of yesterday, and the evening movements were not able to change the current technical picture. Thus, it does not matter at all where the price of the hourly timeframe is now. The important thing is that there is still no trend line or trend channel. On Thursday, we highlight the following levels for trading - 1.1507, 1.1534, 1.1584, 1.1666, 1.1704, as well as the Senkou Span B (1.1613) and Kijun-sen (1.1637) lines. The Ichimoku indicator lines can change their position during the day, which should be taken into account when looking for trading signals. Signals can be rebounds or breakthroughs of these levels and lines. Do not forget about placing a Stop Loss order at breakeven if the price moves 15 points in the right direction. This will protect you against possible losses if the signal turns out to be false. Another speech by Christine Lagarde will take place in the European Union on November 4, as well as the publication of the index of business activity in the service sector and the forecast for the economy from the European Commission. Only a minor report on the number of applications for unemployment benefits in America. Despite the fact that European events are quite interesting in their "signage", most likely, the markets will ignore them today, as well as similar statistics and events yesterday. We recommend you to familiarize yourself: Overview of the EUR/USD pair. November 4. Macroeconomic statistics and Christine Lagarde's speech. Overview of the GBP/USD pair. November 4. Ahead of the Bank of England meeting. Forecast and trading signals for GBP/USD for November 4. Detailed analysis of the movement of the pair and trade deals. Analysis of the COT report
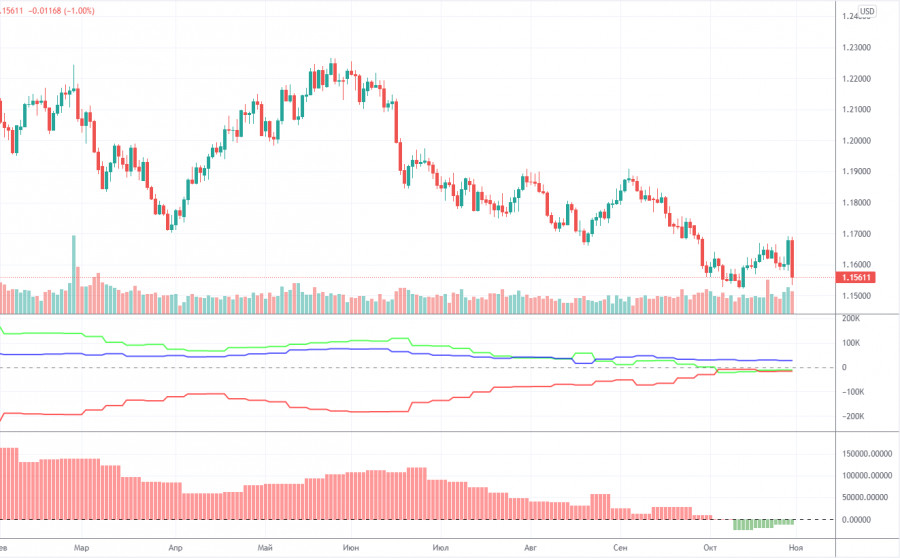
The mood of non-commercial traders practically did not change during the last reporting week (October 19-25). A group of non-commercial traders opened 4,000 sell contracts (shorts) and 4,000 buy contracts (longs). Consequently, the net position of professional players has not changed. And if so, then the mood of the large traders remained... bearish. Yes, exactly bearish, as evidenced by both indicators in the chart above. The green and red lines of the first (net positions of non-commercial and commercial players) continue to move towards each other, which still means that the upward trend is ending. Or the downward correction is delayed. Recall that the process of convergence of these lines began at the beginning of the year, when the upward movement stopped. At this time, this whole process does not even fit into a chart - the downward movement continues for so long, which we still consider to be a correction. The most interesting thing is that the last two trading days this week did not make it into the latest COT report. That is, we do not know how the major players traded on Thursday and Friday, when the pair passed about 250 points. It should also be noted that the net position of non-commercial traders remains below zero. That is, the number of short positions exceeds the total number of long positions. Consequently, based on the COT reports, the fall of the European currency may continue. The nearest target, as we have already said, is the important level of 1.1490. So far, the COT reports absolutely do not provide a conclusion about a change in trend. Explanations for the chart: Support and Resistance Levels are the levels that serve as targets when buying or selling the pair. You can place Take Profit near these levels. Kijun-sen and Senkou Span B lines are lines of the Ichimoku indicator transferred to the hourly timeframe from the 4-hour one. Support and resistance areas are areas from which the price has repeatedly rebounded off. Yellow lines are trend lines, trend channels and any other technical patterns. Indicator 1 on the COT charts is the size of the net position of each category of traders. Indicator 2 on the COT charts is the size of the net position for the non-commercial group. The material has been provided by InstaForex Company - www.instaforex.com |
| Overview of the EUR/USD pair. November 4. Macroeconomic statistics and Christine Lagarde's speech. Posted: 03 Nov 2021 06:12 PM PDT 4-hour timeframe
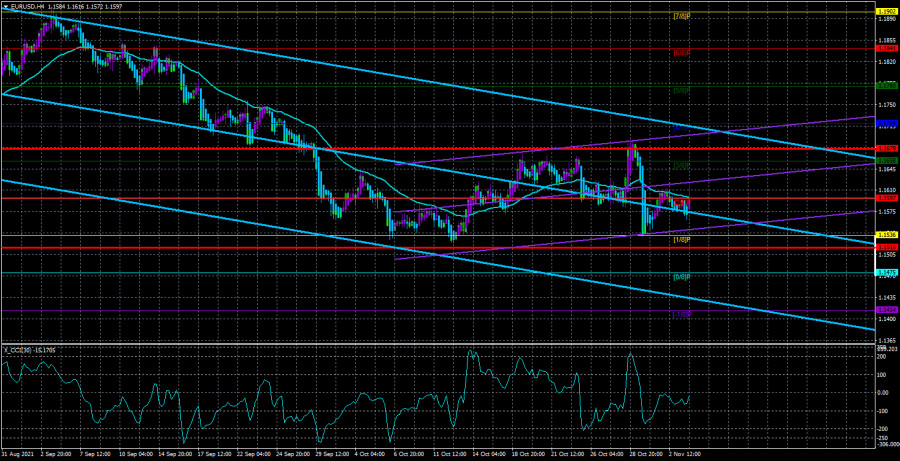
Technical details: Higher linear regression channel: direction - downward. Lower linear regression channel: direction - upward. Moving average (20; smoothed) - sideways. The EUR/USD currency pair continued a weak downward movement for most of the day on Wednesday. Although "continued" is not quite true. It would be more correct to say "continued to trade in a limited range." It should be noted right away that in this article, we will not consider the results of the Fed meeting, as well as all the movements of the pair that occurred after that. At least because in such cases, the markets often trade on nerves or emotions, and the very next day they try to correct their mistakes and return everything to normal. There are also reverse situations when there is no reaction at all, but the next day traders belatedly begin to work out the data that was received the day before. In any case, during the publication of the results of the Fed meeting and Jerome Powell's speech at the conference, we do not recommend trading the pair. This is too dangerous since it is possible to increase the movement, sharp reversals are possible, which cannot be predicted in advance, and technical analysis does not always have time to react to them. Thus, we will consider the events that occurred before the announcement of the results of the Fed meeting, in the quiet part of the day. And in the quiet part of the day, everything was, oddly enough, calm. And this is although, before the evening events, there were several important reports in both the European Union and the States, as well as a speech by ECB President Christine Lagarde. The markets had something to react to, but they did not consider it necessary to do so. Moreover, it should be noted that the euro/dollar and pound/dollar pairs moved differently during the day, and their movements were very difficult to associate with the macroeconomic and fundamental background that was present on Wednesday. Christine Lagarde "reassured": rates will not be raised next year. And the fundamental background for three-quarters of Wednesday was quite interesting. By and large, the most important event of this part of the day was the performance of Christine Lagarde. Unlike a lot of her other speeches, the head of the ECB did not repeat the phrases she had memorized and learned by heart by market participants but shared really important information. Namely, Christine Lagarde said that the current state of the EU economy and its prospects are unlikely to allow the central bank to raise key rates this year or next. According to the head of the ECB, three conditions for raising the rate have been formulated, and they will not be achieved next year with a 99% probability. "The forecast for inflation in the medium term remains restrained, so this indicator, as we expect, will begin to slow down next year. Thus, this condition (stable inflation of 2%) may not be achieved," Christine Lagarde said in Lisbon. The state of the EU economy and future inflation are still of great importance in the context of the ECB's monetary policy. As we can see, the European economy is recovering at a moderate pace (in the third quarter a little more than 2%) and so far there are no grounds for tightening monetary policy. The EU needs to at least complete the PEPP program in March next year and at the same time not inflate the APP program to the size of the PEPP program. In other words, the ECB will not become the central bank that will be the first to start raising rates. Recall that the Fed is going to raise the key rate at least once next year. At least, this is indicated by the "dot plot" chart, according to which already half of the members of the monetary committee support a rate increase in 2022. The same applies to the incentive program. PEPP volumes will decrease in the fourth quarter, but at the same time, as Lagarde herself said, the APP program will increase. Thus, it is still very difficult to calculate exactly how much the cash flow to the European economy is decreasing. While the US economy may start from November, the month is not counted for $ 15 billion every month. Thus, taking into account all the above information, at the moment, the growth of the dollar is slightly more likely than the growth of the euro. However, everything here depends on the growth rates of money supply in the US and the EU, which are very difficult to calculate now.
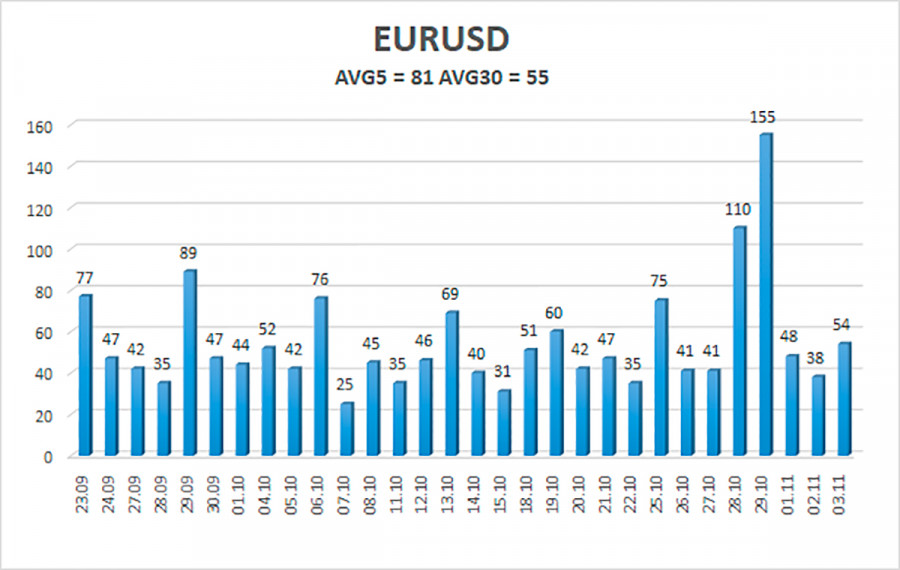
The volatility of the euro/dollar currency pair as of November 4 is 81 points and is characterized as "average". Thus, we expect the pair to move today between the levels of 1.1516 and 1.1678. The reversal of the Heiken Ashi indicator back down will signal the resumption of the downward movement. Nearest support levels: S1 – 1.1536 S2 – 1.1475 S3 – 1.1414 Nearest resistance levels: R1 – 1.1597 R2 – 1.1658 R3 – 1.1719 Trading recommendations: The EUR/USD pair continues to be below the moving average line. Thus, today we should consider short positions with targets of 1.1536 and 1.1516 as long as the price is below the moving average. Purchases of the pair should be considered if the price is fixed above the moving average, with a target of 1.1658. Explanations to the illustrations: Linear regression channels - help determine the current trend. If both are directed in the same direction, then the trend is strong now. Moving average line (settings 20.0, smoothed) - determines the short-term trend and the direction in which trading should be conducted now. Murray levels - target levels for movements and corrections. Volatility levels (red lines) - the likely price channel in which the pair will spend the next day, based on current volatility indicators. CCI indicator - its entry into the oversold area (below -250) or into the overbought area (above +250) means that a trend reversal in the opposite direction is approaching. The material has been provided by InstaForex Company - www.instaforex.com |
| Posted: 03 Nov 2021 02:58 PM PDT Analysis of previous deals: 30M chart of the EUR/USD pair
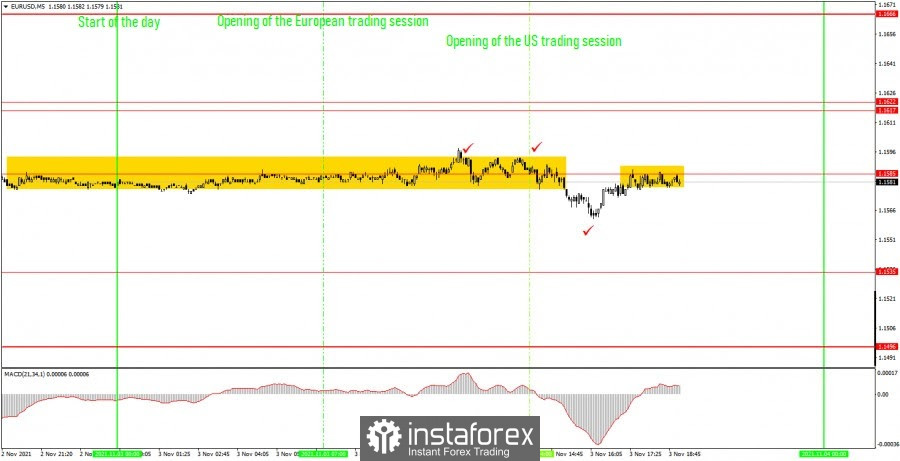
The EUR/USD pair passed from the low to the high of the day a little less than 40 points on Wednesday. Thus, the technical picture over the past day has not changed at all. Not only did the pair continue to trade exclusively sideways, it also began to ignore the lines of the last horizontal channel. Thus, even the forex guru would not find trading signals during the day. There is still no trend on the 30-minute timeframe. Accordingly, there is no trend line now, no trend channel. But today there was macroeconomic statistics and a speech by European Central Bank President Christine Lagarde. There is probably no need to pay attention since there was no market reaction to these events. In the chart below, all the most important events of the day are marked with check marks. The first two events hit the flat in a 16-point channel, the last event - the ISM business activity report in the US service sector - seemed to cause the euro/dollar to turn upward. But this index turned out to be much stronger than forecasts and was supposed to provoke a strengthening of the dollar (that is, a fall in the euro/dollar pair). 5M chart of the EUR/USD pair
On the 5-minute timeframe, Wednesday's movement does not raise any questions. The pair was flat during most of the trading day - the price circled around the level of 1.1585. Thus, short positions should not have been opened even when the quotes went slightly below this horizontal channel. If only because the probability of low volatility and outright flat remained. Plus, this departure took place just 45 minutes before the publication of the ISM index, which is considered a fairly important indicator. Moreover, its actual value (66.7) was not in line with the forecast (61.9), which should have provoked a reaction from traders. However, as we can see at the end of the day, traders saved their strength until the very evening. Because the results of the Federal Reserve meeting will be announced in half an hour, and in another half hour a press conference with Fed Chairman Jerome Powell will begin. Most likely, volatility will increase at this time, but novice traders should have already left the market, as uncontrolled and unpredictable movements may begin soon. Recall that the Fed is now expected to announce the curtailment of the quantitative stimulus program. If these words sound, then the euro/dollar pair may rush down. How to trade on Thursday: Volatility continues to remain very low on the 30-minute timeframe, and at this time there is no trend or horizontal channel. Therefore, the current movement is generally very difficult to describe in words: it is neither sideways nor trendy. The 30-minute TF is still not very convenient to trade, and we still do not recommend tracking signals from the MACD indicator. We advise you to wait for the formation of a trend line or trend channel. On the 5-minute timeframe, the key levels for November 4 are 1.1535, 1.1585, 1.1617 - 1.1622. Take Profit, as before, is set at a distance of 30-40 points. Stop Loss - to breakeven when the price passes in the right direction by 15 points. At the 5M TF, the target can be the nearest level if it is not too close or too far away. If it is, then you should act according to the situation or work according to Take Profit. On Thursday, we advise novice traders to pay attention to Lagarde's speech and the economic forecast from the European Commission. With a 70% probability, these events will not be noticed by the markets, which will continue to be impressed by the results of the Fed meeting, but nevertheless, at this time, changes in the movements of the pair should be expected. Basic rules of the trading system: 1) The signal strength is calculated by the time it took to form the signal (bounce or overcome the level). The less time it took, the stronger the signal. 2) If two or more deals were opened near a certain level based on false signals (which did not trigger Take Profit or the nearest target level), then all subsequent signals from this level should be ignored. 3) In a flat, any pair can form a lot of false signals or not form them at all. But in any case, at the first signs of a flat, it is better to stop trading. 4) Trade deals are opened in the time period between the beginning of the European session and until the middle of the American one, when all deals must be closed manually. 5) On the 30-minute TF, using signals from the MACD indicator, you can trade only if there is good volatility and a trend, which is confirmed by a trend line or a trend channel. 6) If two levels are located too close to each other (from 5 to 15 points), then they should be considered as an area of support or resistance. On the chart: Support and Resistance Levels are the Levels that serve as targets when buying or selling the pair. You can place Take Profit near these levels. Red lines are the channels or trend lines that display the current trend and show in which direction it is better to trade now. The MACD indicator (14,22,3) consists of a histogram and a signal line. When they cross, this is a signal to enter the market. It is recommended to use this indicator in combination with trend lines (channels and trend lines). Important speeches and reports (always contained in the news calendar) can greatly influence the movement of a currency pair. Therefore, during their exit, it is recommended to trade as carefully as possible or exit the market in order to avoid a sharp price reversal against the previous movement. Beginners on Forex should remember that not every single trade has to be profitable. The development of a clear strategy and money management are the key to success in trading over a long period of time. The material has been provided by InstaForex Company - www.instaforex.com |
| Posted: 03 Nov 2021 02:58 PM PDT
The Shiba Inu cryptocurrency (SHIB) has become a real discovery. The meme coin decisively and irrevocably broke into the top 10 cryptocurrencies by capitalization and overtook dogecoin. The cryptocurrency has a very good ecosystem based on the Ethereum network, and even has its own huge crypto community of fans called Shiba army. However, after a fabulous growth and a jump in prices up to its historical high, yesterday the price adjusted and began to fall. The reason for this was the lucky shiba whale, who made almost $5 billion with $8000. On Tuesday, this unknown whale withdrew more than $3 billion from his account, transferred them to four different wallets, which provoked the fall of the cryptocurrency due to such a colossal sale and liquidation of the token from the exchange. According to Etherscan, this holder has sent more than 10 trillion tokens, $700 million each to four wallets. Shiba inu is based on Ethereum. In recent months, the cryptocurrency has been full of headlines in various newspapers, appeared on radio and TV shows, and recently even appeared on a billboard in Times Square. The other day, a code was even leaked, which indicates that Tesla may accept payments for cars in bitcoins and shiba inu (SHIB). However, after the information leaked, Tesla quickly removed the shiba inu from its code. Yesterday, shiba inu fell by more than 8%, although its long-term indicators are still in an obvious bullish movement, because the crypto asset gained more than 600% over the past month. According to rumors, in the very near future, the cryptocurrency may appear in the listing of the world-famous Kraken exchange, and after that, in the near future, Robinhood may open its doors to a very popular cryptocurrency, because the crypto asset is on the 9th place in capitalization, and its daily trades amount to billions of dollars. The material has been provided by InstaForex Company - www.instaforex.com |
| Is the Bank of England ready for a rate hike? What will happen to the pound Posted: 03 Nov 2021 02:58 PM PDT
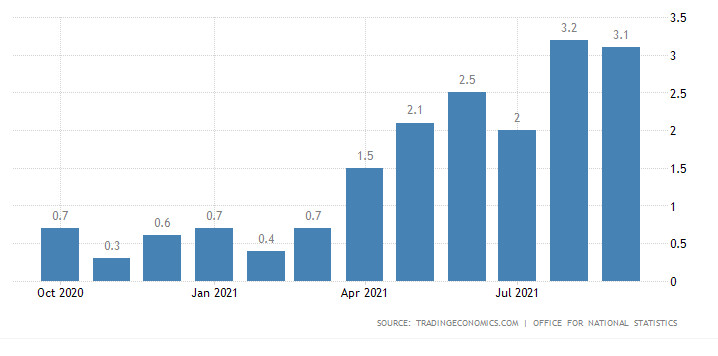
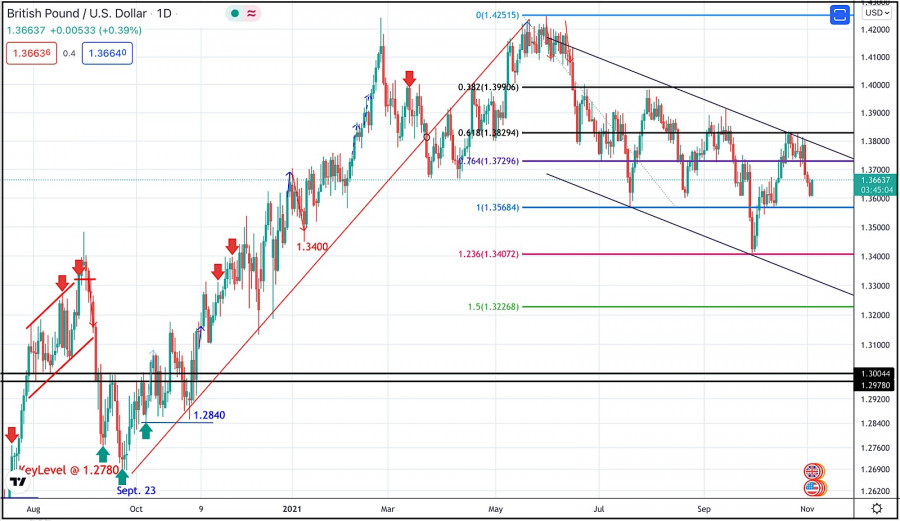
The central event of the week, which will determine the further movement of the dollar in pairs with other major currencies, not only in the short term, but also in the long term, is the Federal Reserve meeting. If we talk about GBP/USD, then another important catalyst for the movement is the Bank of England meeting. The central bank will announce its verdict on further monetary policy on Thursday. If the Fed initially said that the rate hike is still far away, then the British central bank is more determined here. There are suggestions that the BoE will become the first central bank from developed countries to tighten policy. Such forecasts are not taken out of thin air, but dictated by representatives of the central bank. So, how big are the chances of a rate hike by the BoE? The main reason for the abrupt change in the tone of the head of the Bank of England and the signals for tightening policy that have appeared is, of course, accelerating inflation. The indicator exceeded the target almost twice. The goal is 2%, the actual value is 3.1%. At the same time, all economists' forecasts agree that this is far from the final result, the indicator will exceed 4%, and by the end of the year it will reach 4.4%.
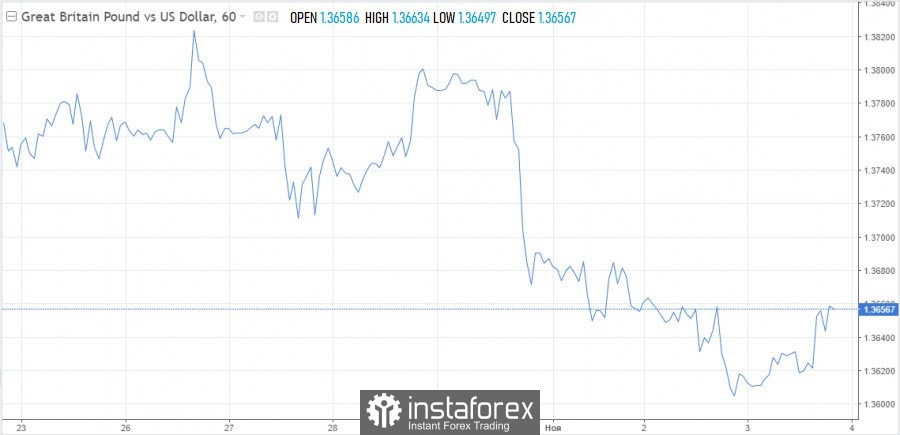
Customs regulations due to Brexit, an energy crisis, a shortage of truck drivers are just some of the reasons that are causing inflation to accelerate in the country. Local authorities are adding fuel to the fire. The country's chief treasurer, Rishi Sunak, last week announced tax cuts for pubs and restaurants and an additional £75bn for infrastructure, skills development and support for the poor. Meanwhile, previous statements were about tax increases. This step had to be taken due to the correction of the assessment of economic growth and damage from the pandemic. Pro-inflationary forces are looming over England and the government is increasing spending. This means that the likelihood of a rate hike by the end of this year increases significantly. Investors estimate this step at 85%. As soon as the BoE begins the process of tightening policy, the pound will receive an impetus for growth. It is possible that this will happen on November 4. If the tone of the minutes is soft, the pound will drop. Since BoE Governor Andrew Bailey has already signaled to the markets about a possible tightening of policy, this will not come as a surprise and a big surprise. For a more tangible growth of the pound, it is necessary for the central bank to act more harshly than market players now assume. Three high-ranking representatives of the central bank, apparently, are ready to vote for a rate hike. However, the volume of the quantitative easing program is likely to remain at the same level - 875 billion pounds. This means that there are no strong drivers for the growth of the British currency at the moment. Technical picture The growth of the GBP/USD pair has slowed down. As confirmation that bullish sentiment for the pound will prevail in Forex again, it will be possible to consider a breakdown of the mirror level of 1.3641. Further, the road to the levels of 1.3686, 1.3723 and 1.3758 will open for bulls. Otherwise, the bears will have the initiative and the level of severity, pulling the pound to 1.3594, 1.3568 and 1.3546.
Scotiabank believes that the central bank at its November meeting will nevertheless leave its policy unchanged. A rate hike this year may still occur, but the BoE, analysts say, will want to limit expectations for next year's rate. It is rather difficult to do this at the same time as the rate hike. A downward test of the GBP/USD pair at 1.3600 is possible, but it can act as a strong support, and the next one is located at 1.3585. The breakthrough will make it possible to retest the level of the end of September - 1.3450. The pound will be completely under the influence of the dollar until the BoE meeting. The material has been provided by InstaForex Company - www.instaforex.com |
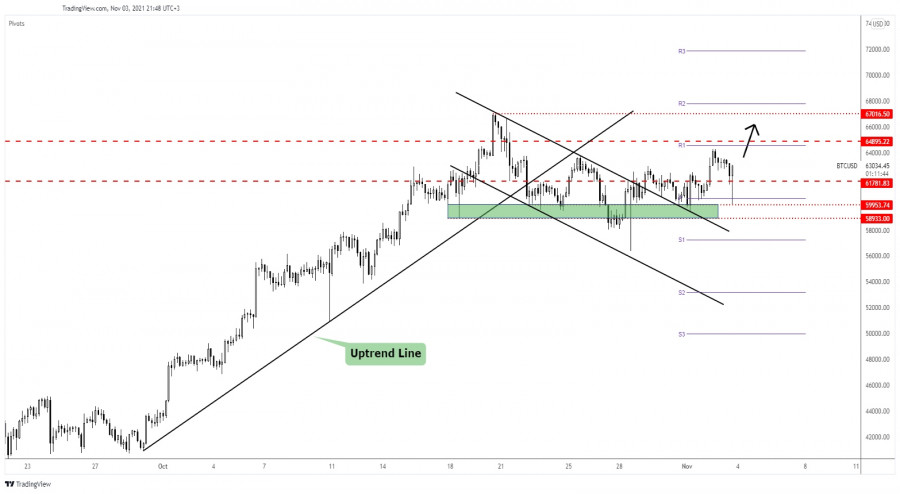
| Bitcoin under massive upside pressure Posted: 03 Nov 2021 01:09 PM PDT Bitcoin declined in the short term after reaching the 64,300 psychological level. The crypto dropped to as low as 60,018.46 level where it has found demand again. The upside scenario remains intact despite the most recent retreat. In the short term, BTC/USD dropped by 6.66% from 64,300 yesterday's high to 60,018 today's low. At the moment of writing, it was at 63,308.44 level and it seemed determined to climb higher. Technically, the rate fell only to test and retest the immediate support levels before jumping higher. Bitcoin false breakout with great separation
BTC/USD plunged but it could register only a false breakout with great separation below the weekly pivot of 60,487 which could signal strong bullish pressure. Its failure to reach the weekly R1 (64,584.23) signaled that the bulls are exhausted. Technically, as long as it stays above 59,953.74 - 58,933 support zone and above the 60,000 psychological level, BTC/USD could resume its upside journey. Bitcoin predictionAfter escaping from the Flag pattern, the price of Bitcoin was expected to grow. The minor retreat could be only a temporary one. BTC/USD retested the buyers before climbing higher. A false breakout with great separation below the pivot point (60,487.91) followed by a bullish candle could announce more gains ahead. An upside continuation could be invalidated only by a new lower low if the rate drops and closes below 60,018.46. The material has been provided by InstaForex Company - www.instaforex.com |
| Posted: 03 Nov 2021 01:07 PM PDT
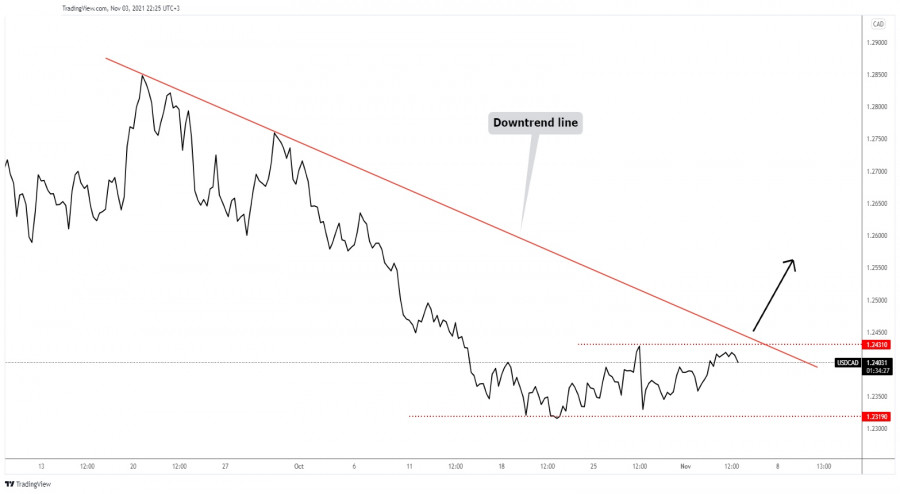
USD/CAD sideways movementThe USD/CAD pair moves somehow sideways between 1.2319 and 1.2431 levels. It's traded below the downtrend line, so the pressure is still high. Technically, we'll have to wait for the price to escape from the current range before buying or selling this pair. In the short term, USD/CAD could move sideways after failing to reach and retest the 1.2431 upside obstacle. Staying near the downtrend line could announce an imminent upside breakout. USD/CAD trading conclusionAt this moment, we don't have a good trading opportunity as the rate moves sideways. We may have an upside reversal only if the rate jumps and stabilizes above the downtrend line and above the 1.2431. This scenario could bring new buying opportunities. The material has been provided by InstaForex Company - www.instaforex.com |
| Posted: 03 Nov 2021 12:50 PM PDT Analysis of Wednesday's trades:GBP/USD 30M Chart
On Wednesday, November 3rd, GBP/USD rebounded from the long-standing support level of 1.3608 on the 30M time frame, thus giving a start to a new upwards run. However, the pound's rally was not directly connected with any macroeconomic statistics or fundamentals published during the day. Markets barely reacted to today's events, so we may conclude that GBP/USD bullish bias is contributed to traders' interest to buy the British currency and sell the American one ahead of the meetings of two central banks. Today, the Federal Reserve will sum up the results of its latest meeting, and tomorrow, the Bank of England will do the same. In connection with that, a surge in volatility is expected these days, so we will need to revise the technical picture no sooner than tomorrow afternoon. At the moment, it is quite difficult to foresee the dynamics of the pair amid the said events. Meanwhile, we should note that the 30M time frame shows no definite trend of the British pound. At the same time, the movement is not flat. So, the current situation in GBP/USD is rather complicated, just as with the Euro. GBP/USD 5M Chart
On the 5M time frame, the technical picture is clearer. At any rate, the pair was not stuck in absolute flat for the whole day. It even produced some trading signals, thus providing trading opportunities. At first, beginners should pay attention to the four ticks on the chart above. Each of these ticks reflects some key events in the United Kingdom or the United States scheduled for today. However, it is useless to analyze those events, as they caused almost no reaction from traders. In particular, the ADP report (represented by a second tick) came in stronger than expected, but the US dollar was unable to gain ground 40 minutes after its publication. On the contrary, the greenback declined by 15 pips which was unlikely connected with the ADP data. Similarly, the Services ISM Index also exceeded the forecast, but the US dollar fell after this publication instead of rising. Now let us consider the trading signals. The first BUY signal was formed near the level of 1.3612. Later on, the quote broke above 1.3638, retreated, and then rebounded, resuming its growth. Therefore, we had to close our buy trade manually with a profit of about 40 pips. Trading plan for Thursday, November 4At the moment of writing, there was no definite trend on the 30M time frame, and the volatility was low. Under such conditions, it is useless to track the MACD signals as they can prove to be effective only if there is any directional movement. The key levels on the 5M time frame are 1.3608 - 1.3612, 1.3688, 1.3708, and 1.3740. These are Thursday's targets that can serve as break or rebound levels. The Take Profit level should be set at the distance of 40-50 pips. On the 5M time frame, the nearest levels can be used as targets and the profits should be fixed considering the trend strength. After the price goes 20 pips in the right direction, it is better to set Stop Loss at a breakeven point. On November 4, beginning traders should pay attention to the most important events of the day which are the BOE post-meeting statement and Andrew Bailey's speech. The basic principles of the trading system1) The strength of the signal depends on the time period during which the signal was formed (a rebound or a break)/ The shorter this period, the stronger the signal. 2) If two or more trades were opened at some level following false signals, i.e. those signals that did not lead the price to Take Profit level or the nearest target levels, then any consequent signals near this level should be ignored. 3) During the flat trend, any currency pair may form a lot of false signals or do not produce any signals at all. In any case, the flat trend is not the best condition for trading. 4) Trades are opened in the time period between the beginning of the European session and until the middle of the American one when all deals should be closed manually. 5) We can pay attention to the MACD signals in the 30M time frame only if there is good volatility and a definite trend confirmed by a trend line or a trend channel. 6) If two key levels are too close to each other (about 5-15 pips), then this is a support or resistance area. How to read charts:Support and Resistance price levels can serve as targets when buying or selling. You can place Take Profit levels near them. Red lines are channels or trend lines that display the current trend and show which direction is better to trade. MACD indicator is a histogram and a signal line that signal to enter the market when they cross. This indicator is better to be used in combination with trend channels or trend lines. Important speeches and reports that are always reflected in the economic calendars can greatly influence the movement of a currency pair. Therefore, during such events, it is recommended to trade as carefully as possible or exit the market in order to avoid a sharp price reversal against the previous movement. Beginning traders should remember that every trade cannot be profitable. The development of a reliable strategy and money management are the keys to success in trading over a long period of time. The material has been provided by InstaForex Company - www.instaforex.com |
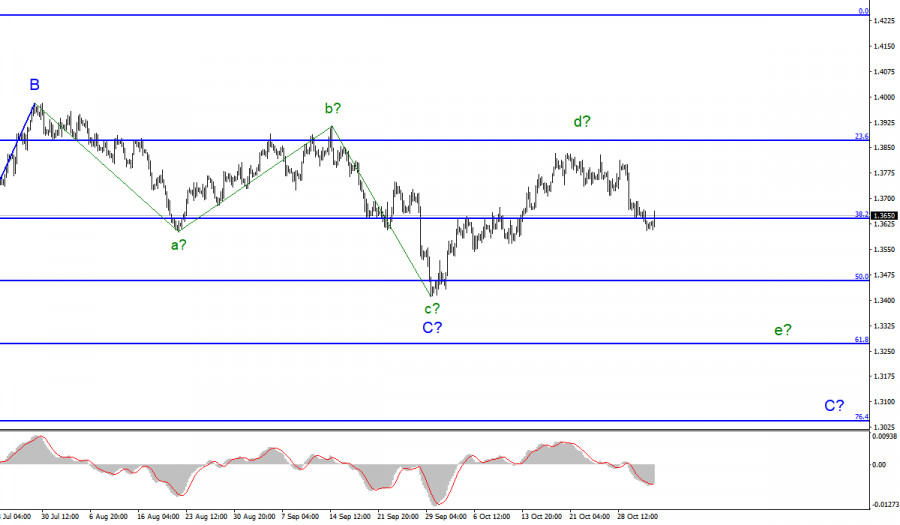
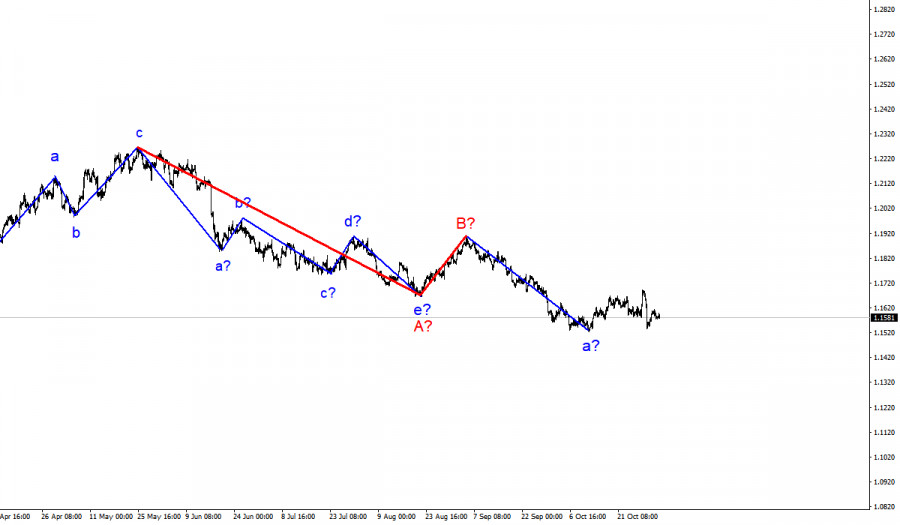
| Wave analysis of GBP/USD for November 3; UK's Business activity is growing so is the pound sterling Posted: 03 Nov 2021 10:46 AM PDT |
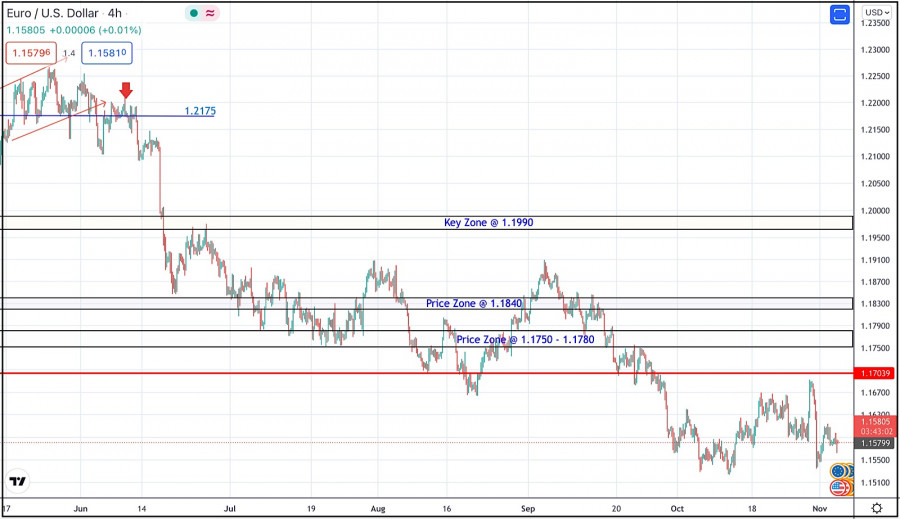
| November 3, 2021 : EUR/USD daily technical review and trading opportunities. Posted: 03 Nov 2021 10:28 AM PDT
Recently, Persistence below the depicted price zone of 1.1990 indicated further downside movement towards 1.1840 and 1.1780 where a sideway consolidation range was established. During last week, the EURUSD pair has been trapped within a narrow consolidation range between the price levels of 1.1780 and 1.1840. A bullish breakout was executed above 1.1840 shortly after. Temporary Upside pullback was expected towards 1.1990. However, re-closure below the price level of 1.1840 has initiated another downside movement towards 1.1780 which failed to hold prices for a short period of time before significant upside movement was presented into market. Intraday traders were advised to wait for candlestick closure above 1.1780 - 1.1840 for another ascending swing to be initiated. However, immediate downside selling pressure brought the pair down below 1.1700. More downside movement took place towards the price level of 1.1600 where significant buying pressure existed. Downside persistence below 1.1700 and 1.1600 has enhanced further decline towards 1.1500. Currently, the price zone around 1.1700 stands as a prominent supply-zone to be watched for SELLING pressure and a possible SELL Entry upon any upcoming ascending movement. The material has been provided by InstaForex Company - www.instaforex.com |
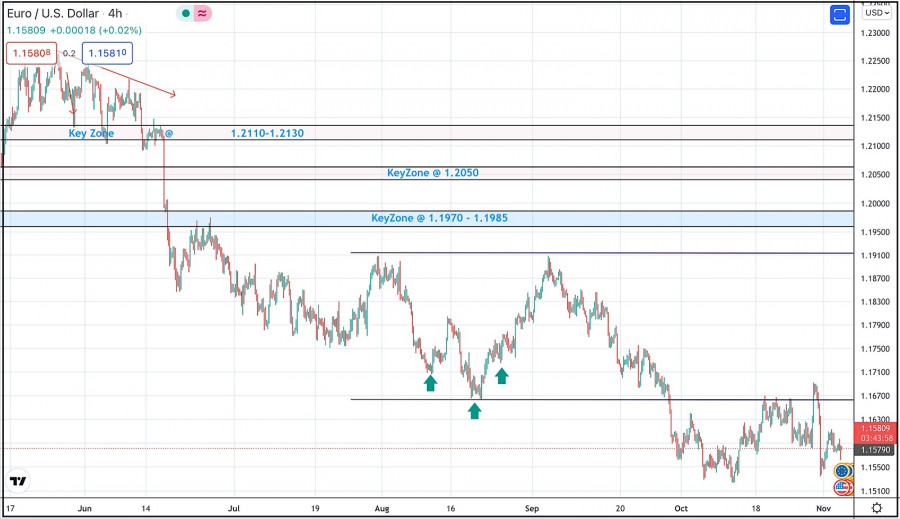
| November 3, 2021 : EUR/USD Intraday technical analysis and trading plan. Posted: 03 Nov 2021 10:26 AM PDT
Bearish persistence below the price zone of 1.2050-1.2000 allowed the recent downtrend to be established. So, the EURUSD pair has expressed significant bearish decline while the price level of 1.1650 stood as a prominent demand level that prevented further bearish decline. The bullish pressure that originated around 1.1650 failed to push higher than the price level of 1.1900. That's why, another bearish pullback towards 1.1650 was executed. Bullish signs were expected around the price levels of 1.1650-1.1700 as it corresponded to a recent previous bottom. However, extensive bearish decline has pushed the EURUSD pair towards 1.1600 and lower levels was about to be reached if sufficient bearish momentum was maintained. Moreover, significant bullish recovery has originated recently upon testing the price level of 1.1570. The recent bullish pullback towards 1.1650-1.1680 was expected to offer bearish rejection and a valid SELL Entry. Significant bearish decline brought the EURUSD pair again towards 1.1550 levels which still stands as an Intraday Support zone. Hence, sideway movement maybe expected in the nearest future. Please note that any Bullish movement above 1.1680 should be considered as an early exit signal to offset any SELL trades. The material has been provided by InstaForex Company - www.instaforex.com |
| November 3, 2021 : GBP/USD Intraday technical analysis and significant key-levels. Posted: 03 Nov 2021 10:25 AM PDT
The GBPUSD pair has been moving sideways with some bearish tendency while bearish breakout below 1.3600 was needed to enhance further bearish decline. On the other hand, the nearest SUPPLY level was located around 1.4000 where bearish rejection and a valid SELL Entry was anticipated. The recent bullish rejection witnessed around 1.3600 as well as the temporary bullish breakout above 1.3830 indicated a high probability that this bullish movement may pursue towards 1.4025 then 1.4100. However, the pair remained trapped within a fixed price range until significant bearish momentum emerged into the market. Bearish breakout below 1.3680 enabled further bearish decline towards 1.3400 which corresponded to 123% Fibonacci Level of the most recent bearish movement. This was a good entry level for a corrective bullish pullback towards 1.3650 and 1.3720 which was temporarily bypassed. Recently, the pair was testing the resistance zone around 1.3830 where bearish pressure originiated into the market. Currently, the short-term outlook is bearish as long as the pair maintains its movement below 1.3730. Another bearish visit is expected towards 1.3570 and 1.3400 as they correspond to significant Fibonacci Expansion Levels. The material has been provided by InstaForex Company - www.instaforex.com |
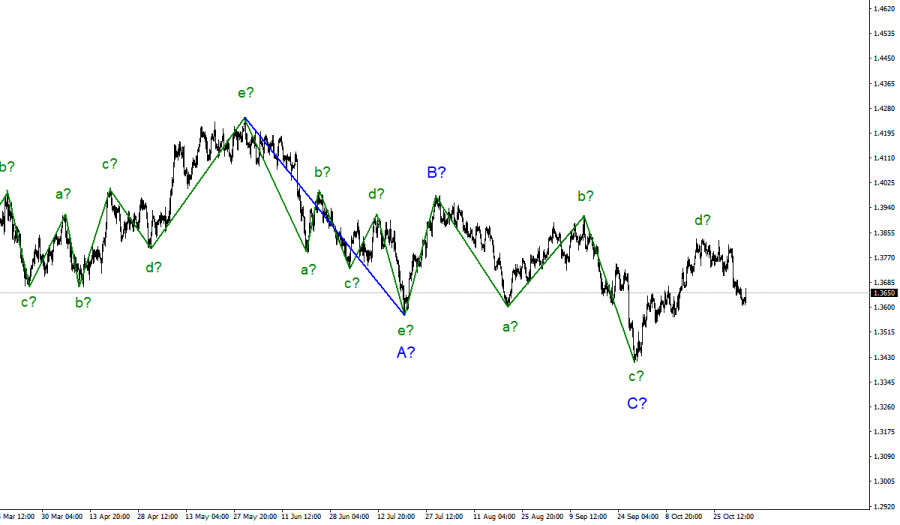
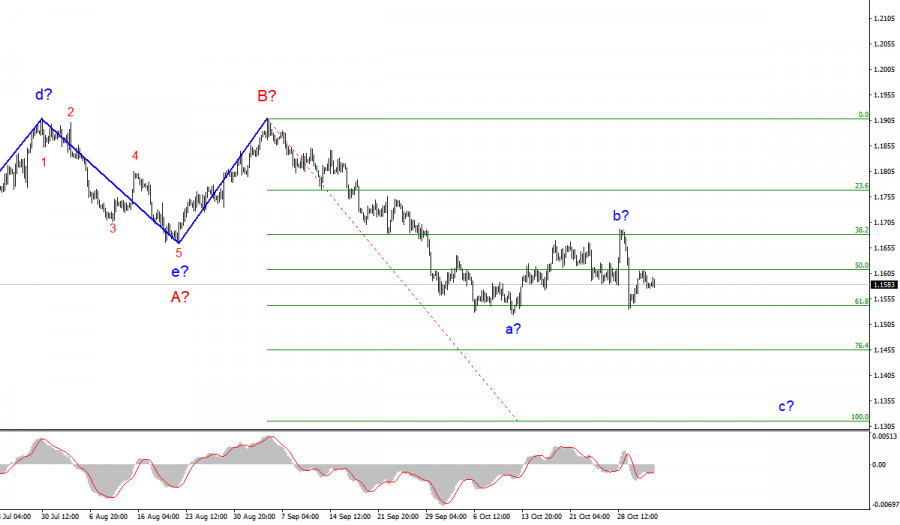
| Wave analysis of EUR/USD for November 3; ECB will not tighten monetary policy next year Posted: 03 Nov 2021 10:03 AM PDT |
| AUD/NZD. Neighborhood Confrontation: New Zealand dollar starts and wins Posted: 03 Nov 2021 09:26 AM PDT It is risky to trade dollar pairs today. At the end of the US trading session, the Fed will announce its "verdict," which will determine the future fate of the US currency – at least in the medium term. Most experts are confident that Federal Reserve Chair Jerome Powell will finally announce the start of tapering a large-scale quantitative easing program. This is a long-awaited, but predictable event. But the future prospects of monetary policy are very vague. Some representatives of the Fed are lobbying for the idea of raising the interest rate, pointing to a jump in inflation. However, not all members of the committee share such zeal. Representatives of the "dovish" wing of the Fed (including Jerome Powell) continue to insist that the inflation boom is a temporary phenomenon. And, therefore, it is not worth rushing to tighten the parameters of monetary policy. In which direction the pendulum will swing according to the results of the November meeting is an open question. In my opinion, the American regulator will disappoint dollar bulls, but the option of a "hawkish surprise" cannot be ruled out.
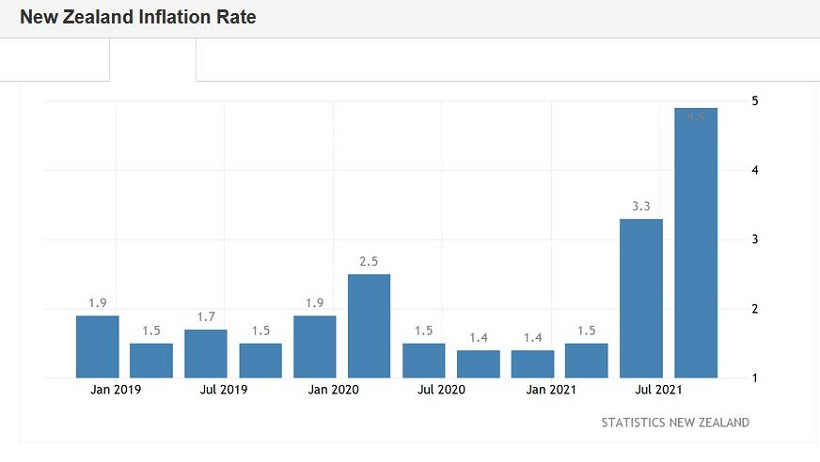
Therefore, today the risks of false price movements are especially high, and especially in the short period of time between the publication of the Fed's accompanying statement and Powell's speech at a press conference. During periods of such emotional volatility, it is best to stay out of the market: traders will not immediately crystallize their general opinion on the outcome of the November meeting, especially if the Federal Reserve voices contradictory and ambiguous signals. Thus, today we can take a closer look at the main cross-pairs, among which the AUD/NZD pair should be singled out. The Australian dollar is actively losing ground against its New Zealand namesake. Corrective pullbacks are of a short-term nature, and the "downward wave" is gradually increasing. For example, over the past three trading days, the pair has been steadily diving downwards, reflecting increased demand for the New Zealand dollar. Today's released data only increased the pressure on the cross: data on the growth of the labor market in New Zealand came out in the "green zone," demonstrating the stress resistance of the economy of the island state. The unemployment rate in New Zealand in the third quarter of this year fell to 3.4% - this is the best result in the last 13 years. Most experts expected to see this indicator at 3.9%. The number of employed increased immediately by 2% (on a quarterly basis), with a growth forecast of up to 0.4%. In annual terms, the component also came out in the "green zone," jumping to 4.2% (with a growth forecast to 2.7%). The share of the economically active population also increased to 71.2% (the previous value was 70.5%). Here it is necessary to recall the dynamics of New Zealand inflation, which was published in mid-October. The consumer price index in the third quarter of this year jumped to 2.2% (QoQ). The indicator has updated a 10-year record: the last time the CPI was at a similar height (in quarterly terms) was in early 2011. On an annualized basis, the index also came out in the "green zone," at 4.9%. Both components of the release have been showing upward dynamics for several consecutive quarters, reflecting an increase in price pressure. All this suggests that the Reserve Bank of New Zealand will maintain a "hawkish course." In early October, the RBNZ raised the interest rate by 25 basis points, that is, to 0.5%. Taking into account the rhetoric of the central bank representatives, as well as the dynamics of key macroeconomic reports, it can be assumed that at the last meeting of this year (November 24), the RBNZ will hold another round of rate hikes - up to 0.75%. The head of the New Zealand central bank also did not rule out such a scenario, however, without specifying the time frame. According to him, the central bank may tighten monetary policy again, "if the necessary conditions for this remain in the country." It should also be noted here that in New Zealand, 75% of residents have already received two doses of the coronavirus vaccine. This suggests that quarantine restrictions will be relaxed again in the near future, and the probability of a new lockdown is reduced to almost zero.
The Australian dollar cannot boast of the RBA's hawkish attitude. On the contrary, following the results of the last meeting, the head of the central bank, Philip Lowe, voiced a very "dovish" rhetoric, despite the general optimistic mood of the regulator. He categorically ruled out the option of tightening monetary policy parameters within the next year. At the same time, Lowe noted that the hawkish expectations of the market "are extremely unrealistic" (it was a question of a possible rate hike next year). He also said that optimistic estimates regarding the recovery processes "do not indicate that the rate will definitely be raised before 2024." According to him, there is a "high degree of uncertainty" in this issue, so it is quite likely that the rate will remain at the current level until the designated border date. Such a fundamental background suggests that the New Zealand dollar, together with the Aussie, will continue to be in high demand. The AUD/NZD pair has not exhausted its downside potential, so sales are still a priority. Technically, the pair on the D1 timeframe is between the middle and upper lines of the Bollinger Bands indicator, in the Kumo cloud, but below the Tenkan-sen Kijun-sen lines. The main support level is at 1.0350 - at this price point, the lower line of the Bollinger Bands indicator coincides with the lower border of the Kumo cloud on the same timeframe. This target is the target of the downside movement in the medium term. The material has been provided by InstaForex Company - www.instaforex.com |
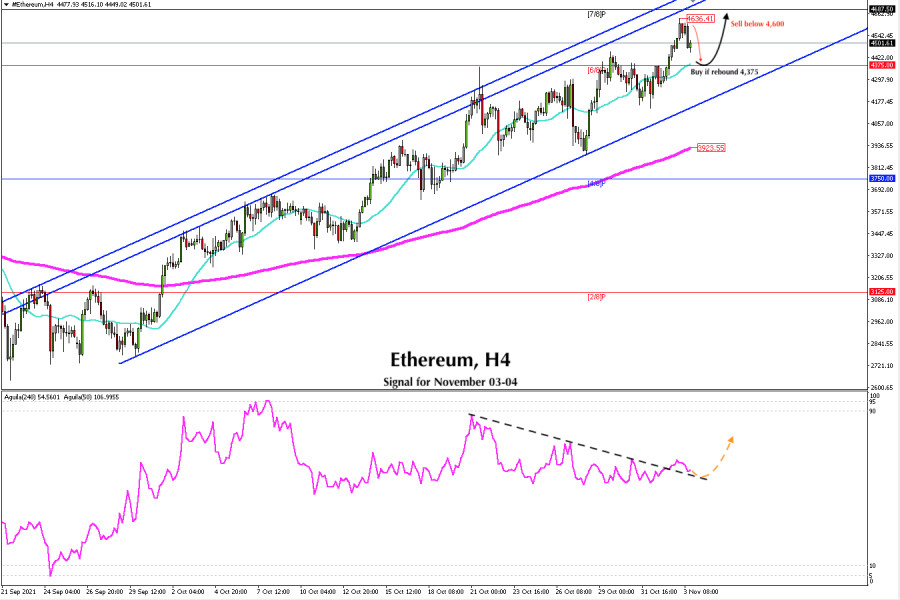
| Posted: 03 Nov 2021 08:48 AM PDT
Ethereum (ETH) is trading around 4,501, after having made an all-time high at 4,636. Now we are watching a correction and the price is likely to find support around the 21 SMA located at 4,375. The strong 6/8 support of murray is located at the same level. According to the 4-hour chart, Ether remains in a strongly bullish trend. When it made its all-time high, it touched the top of the uptrend channel. It is likely that we will see a correction in the coming days for a new bullish wave that may encourage ETH to rise to the psychological level of 5,000, around 8/8 of murray. We should expect a consolidation around the key level of 4,375. From October 18 to October 31, it was consolidating below this zone and is now this level likely to serve as strong support. A good opportunity will be to buy at these price levels with targets at 4,687 (7/7) and 5,000 (8/8). If the price falls below 4,375, we should expect the correction to continue until we find support at the bottom of the uptrend channel. This will be the last support for ETH and also a good opportunity to buy with medium-term targets around $5,000. If Ethereum breaks the uptrend channel formed since September 26, it could be the beginning of a bearish scenario and we could expect a drop to the 200 EMA level around 3,923. If the downward pressure prevails and if the panic increases the market could fall to the support of 4/8 murray at 3750. Support and Resistance Levels for November 03 - 04, 2021 Resistance (3) 4,859 Resistance (2) 4,694 Resistance (1) 4,610 ---------------------------- Support (1) 4,361 Support (2) 4,195 Support (3) 4,062 *********************************************************** A trading tip for ETH for November 03 - 04, 2021 Buy if ETH rebounds from 4,375 (SMA 21) with take profit at 4,500 and 4,687 (7/8), stop loss below 4,265. The material has been provided by InstaForex Company - www.instaforex.com |
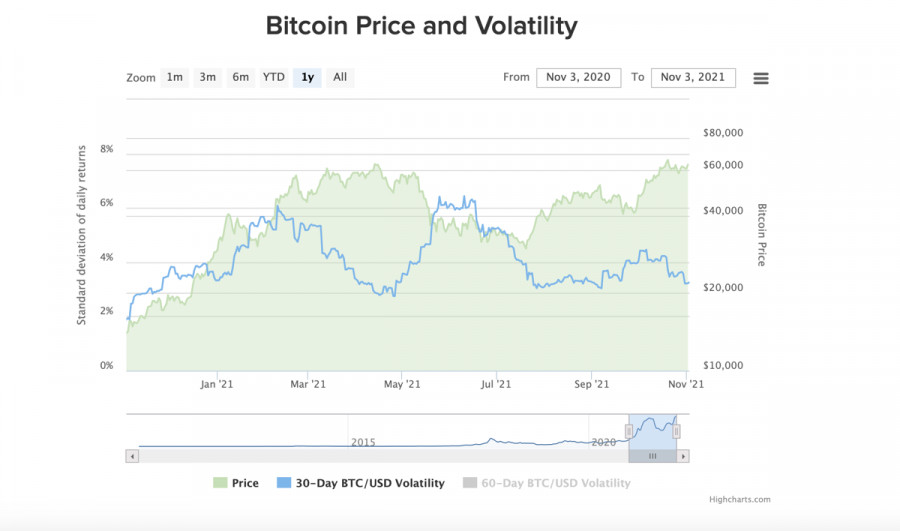
| JPMorgan experts compared gold and bitcoin volatility, says BTC price is twice overstated Posted: 03 Nov 2021 08:47 AM PDT Bitcoin has made a difficult journey from a speculative cryptocurrency with great potential to an institutionally attractive asset class in the last six months. As this process progressed, interest in the coin grew among large companies and gradually declined among retail traders. Thanks to this, Bitcoin has become a more stable and predictable tool, as well as an important mechanism in the fight against the protection of funds from inflation. All these factors caused the growth of quotes of the first cryptocurrency to $66k, where the last maximum was set. And even despite the fundamental nature of the growth, JPMorgan experts believe that the price of the currency is overestimated by two times. The analytical department of the investment bank conducted a study comparing the volatility levels of gold and Bitcoin. According to the data obtained, the level of volatility of Bitcoin is four times higher than that of gold. Given this, analysts concluded that the real value of the first digital asset should be at $35k. At the same time, it should be borne in mind that if volatility decreases by half, then the fair price for the cryptocurrency will rise to $73k. Despite a significant leap in development, the volatility of BTC still remains at too high a level as a class asset. According to JPMorgan representatives, the current value target of $100k is unlikely to be achieved at the current level of volatility. In conclusion, experts said that the entire digital asset sector is an extremely promising industry that is in a bullish trend. At the same time, considering cryptocurrencies as a key asset is too risky due to increased instability.
Volatility remains the only fundamental problem of Bitcoin and the main advantage of gold at the current stage of the development of financial instruments. It is unlikely that such conclusions can scare investors away from using Bitcoin, but the riskiness of a digital asset still affects the degree of its acceptance as a means of payment at different levels. Over the past six months, the main catalyst for the growth of BTC has been the fear of inflation, and not the versatility of the ecosystem or investment attractiveness. Moreover, experts believe that in order to maintain its current position in the market as a whole, Bitcoin needs to expand its interaction with the DeFi and NFT markets, which mostly belong to ETH. The first bell to aggravate the competition between the two assets is a study stating that the growth of ether has significantly outpaced the pace of Bitcoin. And the NFT and decentralized finance markets played an important role in this. In addition, it is worth noting that even the growth of institutionalization and the adoption of Bitcoin as a class asset are not able to quickly change the situation with volatility. At the same time, there is a positive dynamics of a decrease in the volatility of Bitcoin and an increase in the gold index. Taking into account this fact and other advantages of the first crypto asset, BTC is a more attractive means of hedging risks.
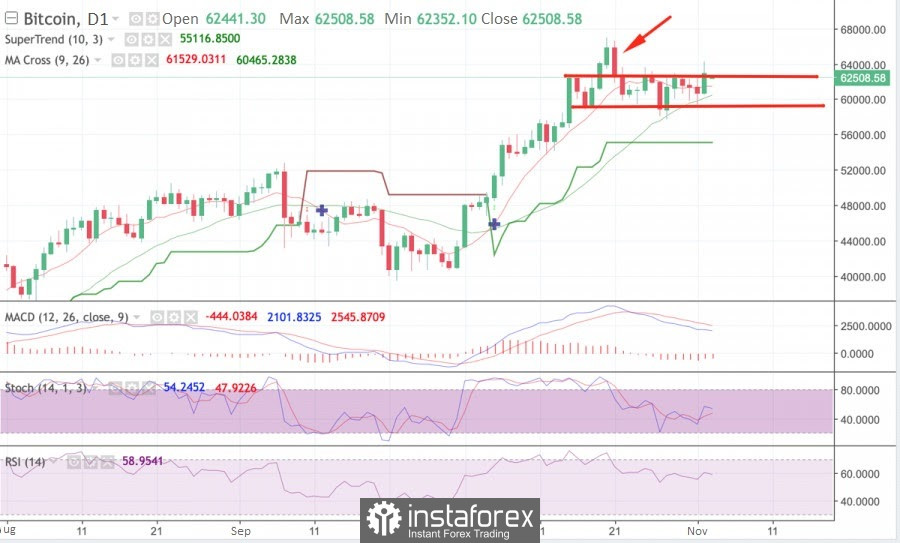
This is confirmed by the data of cryptocurrency exchanges, where there was another surge in the activity of major players confidently purchasing BTC. Over the past week, the balances of addresses where at least 1000 BTC is located have been replenished with another 142k bitcoin coins. This indicates the imminent start of a bullish rally, which will become the main dish within the current upward trend. As of 12:00 UTC, the asset is trading near $62.5k with daily trading volumes in the region of $34 billion. On the daily chart, Bitcoin formed a confident bullish candle but was pushed under the resistance zone at $63,060. At the same time, the asset is coming to the end of the consolidation phase, and it is likely that at the end of the current trading day it will try to break through the resistance line. This is indicated by the uncertainty of sellers during October 30, 31, and November 1, after which the bulls formed a powerful bullish candle, signaling the beginning of a new stage of growth. The last time the price broke through the resistance line was during the update of the historical maximum, and therefore, with its successful breakdown, the quotes will move to the $64.2k mark, after which the movement will follow to a new maximum. At the same time, BTC/USD technical indicators show signs of weakness: the MACD has leveled off but is moving in an uncertain flat, and stochastic has sharply started moving parallel to the price, which indicates a lack of support for the medium-term momentum. The relative strength index also began to decline, which indicates the weakness of buyers and the loss of bullish momentum.
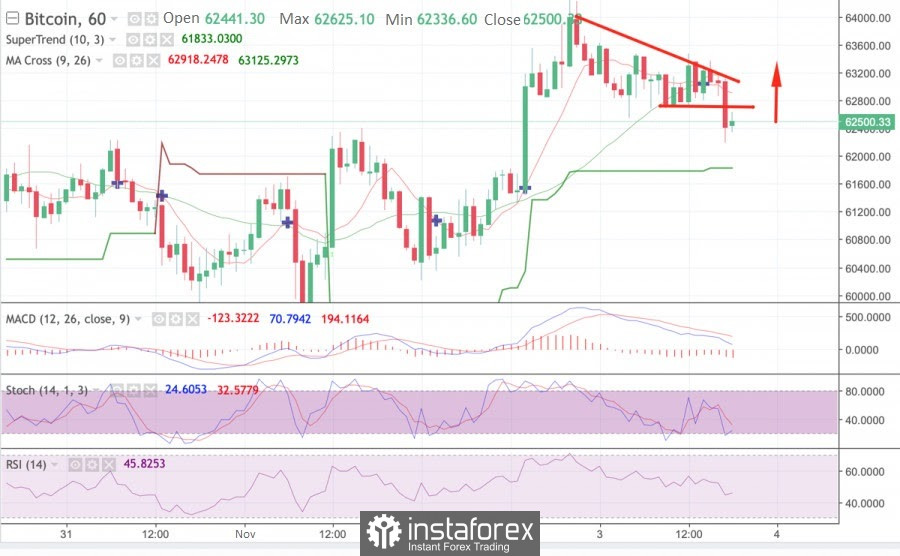
The hourly chart confirms the prerequisites for a local reversal and retest of the resistance zone, but for this, it is necessary to recover above the breakdown zone of the "bearish triangle" technical analysis figure at $62,770. The formation of a long red candle with a long lower wick indicates that the price is being pushed out of current positions, which confirms the activation of buyers and the greater strength of the short-term trend. This is also confirmed by technical indicators: the stochastic oscillator and the relative strength index began to recover after falling to local lows, but at the same time, the MACD continues to fluctuate, which indicates that the bears are still strong. The fate of the medium-term trend will be decided when the hourly chart is fixed above the bearish formation. So far, everything points to fluctuations within the local support and resistance zones.
|
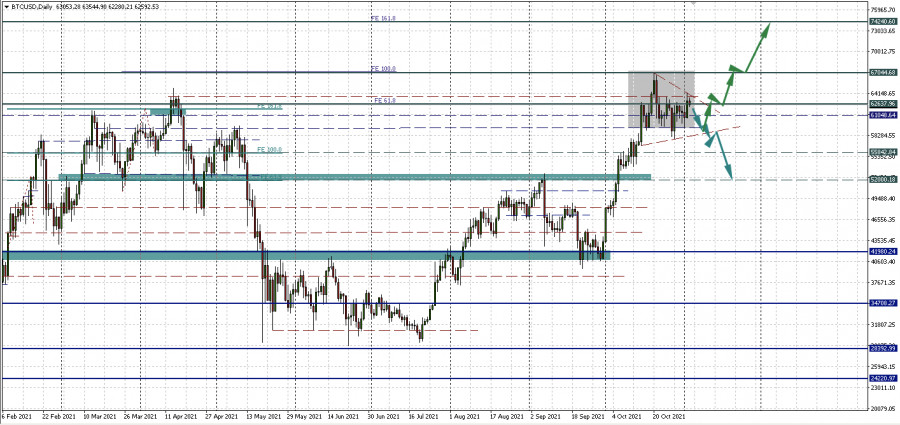
| Bitcoin hints new momentum: up or down? Posted: 03 Nov 2021 08:15 AM PDT Bitcoin failed to get out of the sideways trend 59,383.67 - 62,637.96 on Tuesday. The breakout turned out to be false, consolidation continues. In general, the situation looks a bit boring and requires patience to wait for at least some clarification. But this is not bad at all, especially for those who trade in the corridor and now may risk selling on a rebound. In the meantime, in search of clarity, I propose to consider the proposed scenario. There is a symmetrical triangle outlined on the daily chart. The emphasis here is on the word "outlined" - it is too early to make a final conclusion, it must be observed. But if the figure is justified, then the market is waiting for a new impulse soon. But where is not yet clear. An equilateral triangle is a pattern of uncertainty, which means that the price of BTCUSD can both fall and rise. Well, even with such a presumptive technical picture, a deeper correction is not ruled out. The potential for working out the downward pattern is at $52,000 per coin. And the potential of working upwards is on the achievement and update of the historical maximum. JP Morgan predicts moderate growth in BTCUSDWhile many analysts are predicting the next target for BTCUSD at $100,000 per coin, JP Morgan's forecasts are more modest. The bank's strategists have stated that the current fair value of the main cryptocurrency is around $35,000. According to Bloomberg, JP Morgan analysts noted that if "the relative volatility of BTC is halved next year," then the $73,000 price target "seems reasonable." But we remember well how back in October, JP Morgan experts said that Bitcoin would be the new gold for hedging against inflation. And that was what caused the cryptocurrency to skyrocket for most of the year. But now they are claiming that the current volatility of BTC is "four times" different from the yellow metal. Volatility decreases, as well as targetsThe argument for reducing volatility is noteworthy. We have already noted the other day that this is due to the natural maturation of the market and the institutional acceptance of the asset. Many experts speak about this, including the CEO and founder of Pantera Capital, Dan Morehead. Morehead believes that the extreme volatility of bitcoin may become a thing of the past, which means that the previous price cycles that investors are used to are over. Consequently, the market will experience less volatility both upward and downward. So will Bitcoin grow to $100,000?Many experts set this bar at the end of this year. But, in my opinion, the timing is something that is extremely difficult to predict in the financial markets. Catalysts such as rising inflation and widespread institutional adoption are likely to push the mainstream cryptocurrency towards the $100,000 mark. But looking at the chart and guided by the Fibo Expansion, the next target for BTCUSD is around $74,000 per coin (161.8 Fibo Expansion). Let the price reach it first, after which we will discuss the following ambitious targets.
|
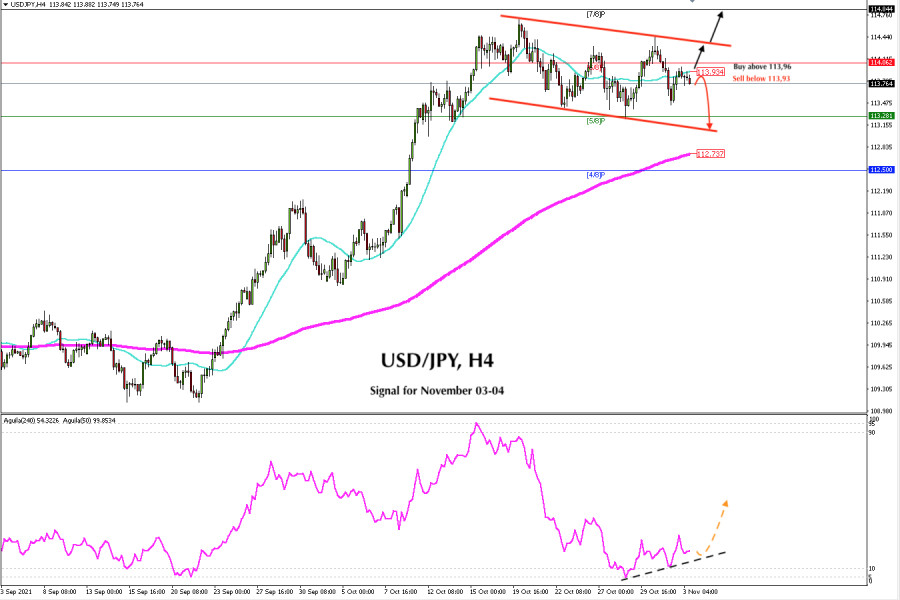
| Trading signal for USD/JPY on November 03-04, 2021: buy above 113.96 (SMA 21) Posted: 03 Nov 2021 08:04 AM PDT
In the early American session, the USD / JPY pair is trading below the SMA of 21. The pair is likely to fall to the support of 113.28. However, the eagle indicator is showing a bullish signal. If the price returns to 113.96, it will be a good opportunity to buy with targets at 114.30. The pair could break the bearish channel with targets at 7/8 of murray around 114.84. The US dollar index continues to show its strength at the beginning of the US session. It is rising, having bounced off the 21 SMA. In addition, the ADP pollster showed optimistic employment data that surpassed expectations. The US private sector created 571,000 jobs, much better than the consensus for a 400,000 increase. Undoubtedly, the Fed will be willing to reduce its bond purchase program. This decision that will be announced in the next few hours that could trigger strong volatility in the currency market. The protagonist will be the US dollar, and in turn USD / JPY may trade higher. On the chart, it could rise to the resistance of 7/8 murray at 114.84. On the other hand, if investors do not show much interest after the Fed announcement, the stock market could have a strong fall and investors will be willing to take safe haven in USD / JPY and we could see the yen advance towards the support level of 113.28 (5/8). Our trading plan is to buy USD / JPY in the next few hours only if it consolidates above 113.93. The targets could be set at 114.30 and 114.84. On the other hand, if the pair falls below moving average of 21 after the Fed's announcement, we will be able to sell with a target at 113.28. If the pair remains under downward pressure, it could fall to 112.73 that is where the EMA of 200 is located. Market sentiment shows that there are 68.85% of traders who are buying the USD / JPY pair which is a positive sign. The pair is likely to fall again as long as it remains below 114.84, with targets at 4/8 of a murray around 112.50. Support and Resistance Levels for November 03 - 04, 2021 Resistance (3) 114.52 Resistance (2) 114.22 Resistance (1) 113.88 ---------------------------- Support (1) 113.54 Support (2) 113.46 Support (3) 113.16 *********************************************************** A trading tip for USD/JPY for November 03 - 04, 2021 Buy above 113.96 (SMA 21) with take profit at 114.30 (top of bearish channel) and 114.84 (7/8), stop loss below 113.60. The material has been provided by InstaForex Company - www.instaforex.com |
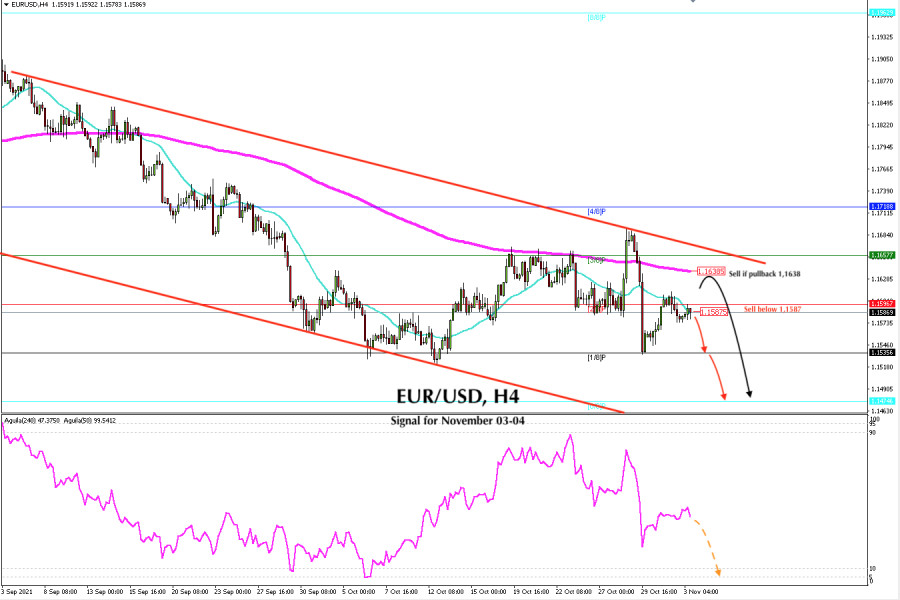
| Trading signal for EUR/USD on November 03-04, 2021: sell below 1.1587 (SMA 21) Posted: 03 Nov 2021 07:19 AM PDT
The day most awaited by speculators has arrived. In the next few hours, the important announcement will be made by Federal Reserve Chairman Jerome Powell. He will unveil monetary policy decisions which are expected to have a high impact on financial markets. The hawkish stance could strengthen the US dollar and we could see a fall of the euro to the level of 1.1474, the key support level of 0/8 of murray. According to the 4-hour chart, EUR/USD is trading below the 200 EMA and below the 21 SMA. We can also see that the pair is trading within a downtrend channel. As long as it remains below these levels, the price could drop to 1.1531 and down to 1.1474, the price level of July 2020. Given that investors are taking refuge in the dollar, EUR/USD is likely to extend its slide. The eagle indicator also shows a bearish signal. Therefore, our trading plan is to sell below 2/8 of Murray around 1.1596 with the target at 1.1535. If the Euro makes a pullback towards the EMA of 200 at 1.1638 and towards the top of the downtrend channel and fails to break it, then it will be an opportunity to sell with targets at 1.1680 and 1.1536. If this support is broken, it could fall up to 1.1474 (0/8). Market sentiment for today shows that there are 55.15% of traders who are selling EUR / USD. This is a neutral sign and we could expect a fall in the euro to the level of 1.1531. If this figure increases, it will be a positive signal and the euro could rise to 1.17. On the other hand, if in the next hours after the Fed's announcement this figure decreases, we might see weakness of the euro and a return to the price level of July 2020 around 1.1470. Support and Resistance Levels for November 03 - 04, 2021 Resistance (3) 1.1641 Resistance (2) 1.1627 Resistance (1) 1.1595 ---------------------------- Support (1) 1.1564 Support (2) 1.1535 Support (3) 1.1498 *********************************************************** A trading tip for EUR/USD for November 03 - 04, 2021 Sell below 1.1587 (SMA 21) with take profit at 1.1531 (1/8) and 1,.474 (0/8), stop loss above 1.1625. The material has been provided by InstaForex Company - www.instaforex.com |
| Video market update for November 03,2021 Posted: 03 Nov 2021 06:54 AM PDT Watch for continuation- al movement.... The material has been provided by InstaForex Company - www.instaforex.com |
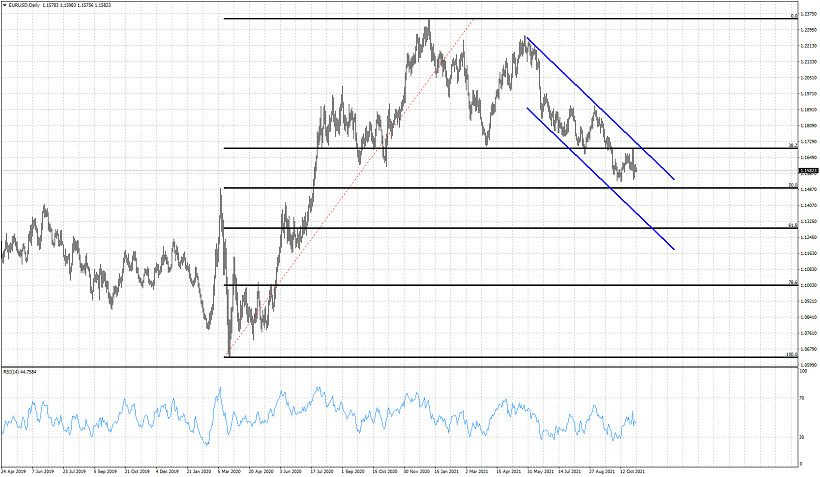
| Medium-term analysis on EURUSD. Posted: 03 Nov 2021 06:35 AM PDT EURUSD is in a bearish channel since the May top at 1.2265. Price as expected then has turned lower and is approaching the 1.15 price level. Trend remains bearish as long as price is below 1.17. Any bounce is considered a selling opportunity with 1.1490 and 1.13 as the next two targets.
Blue lines - bearish channel EURUSD continues making lower lows and lower highs. Resistance by the upper channel boundary is at 1.1715-1.17. Support by the 50% Fibonacci retracement level is at 1.1490. Breaking below 1.1490 will increase chances of pushing towards the 61.8% level at 1.13. So far the decline is a little bigger that the first decline from 1.2345 to 1.1699. Price has made a new low and yesterday's rejection at the back test of 1.17 suggests that was once support is now resistance. The material has been provided by InstaForex Company - www.instaforex.com |
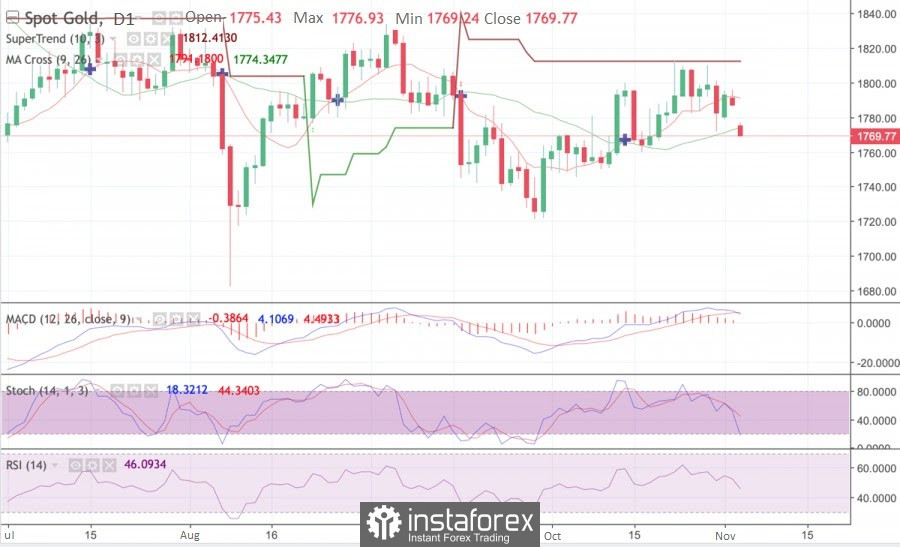
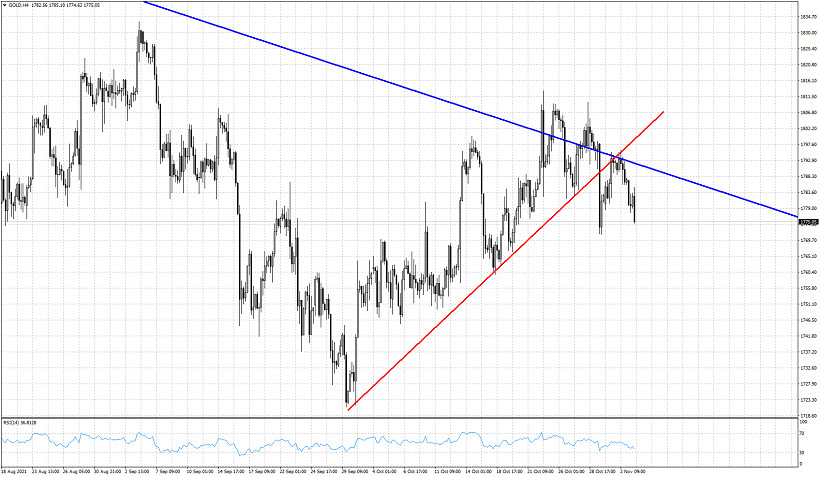
| Gold remains vulnerable to more downside. Posted: 03 Nov 2021 06:29 AM PDT Gold price moves lower today. As we mentioned in yesterday's analysis, we are bearish Gold as long as price is below $1,810. Gold price failed to stay above the major trend line resistance and produced a false breakout. Such a false signal is an even stronger counter signal. This means that the bearish repercussions are of bigger importance. Price fails to hold the short-term support levels and this could lead to a break lower towards $1,740 again.
Red line- support trend line (broken) Gold price broke and back tested the red support trend line. The support trend line was back tested from below and price got rejected. The blue trend line was initially broken but it soon appeared that the signal was a fake one. As we mentioned yesterday Gold price was forming lower highs. This price pattern is bearish and Gold is expected to move below $1,770 soon. Gold price first target is at $1,756 and next at $1,740. The material has been provided by InstaForex Company - www.instaforex.com |
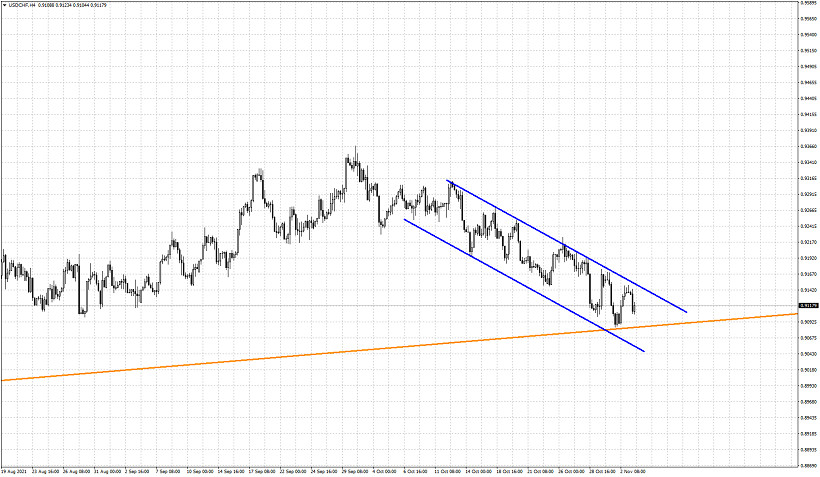
| USDCHF inside bearish channel, but price expected to make a trend reversal. Posted: 03 Nov 2021 06:20 AM PDT Yesterday USDCHF made a strong bounce but we warned traders that bulls need to push price above 0.9150 in order to change trend to bullish. Price continues to trade inside the short-term bearish channel since the end of September.
Orange line - major support trend line USDCHF got rejected at the upper channel boundary and is turning lower. Price could form a higher low and break the bearish channel, this scenario has increased chances of success as price is also very close to the major orange support trend line. As long as price is above 0.9080 we are bullish. Currently price is at 0.9127 and I prefer to be long, expecting a push above 0.9150. 0.9175 is my first target and 0.9220 is my second target. Our final and third target is at 0.9290. From a risk reward perspective, we are at a price level that favors such a strategy. The material has been provided by InstaForex Company - www.instaforex.com |
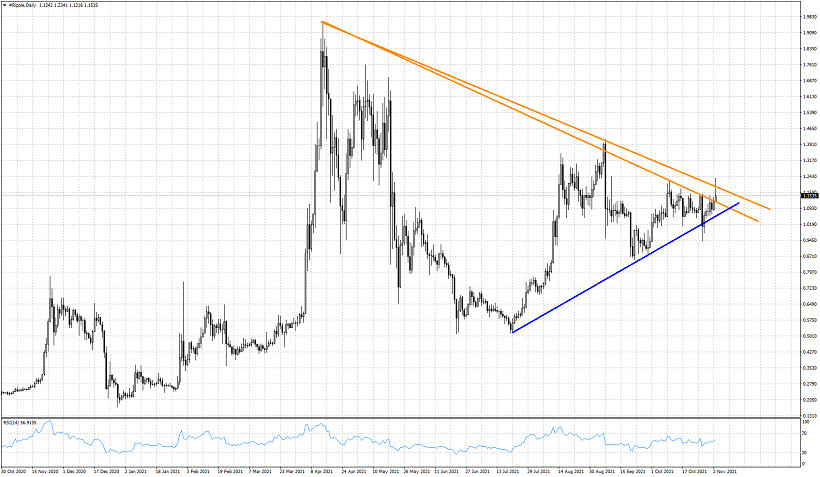
| XRPUSD challenges major short-term resistance. Posted: 03 Nov 2021 06:08 AM PDT XRPUSD has managed to break above $1.13 but price reached as high as $1.236 earlier today. In our previous posts we mentioned that important resistance is found between $1.13-$1.24. Bulls need to break above this area in order to call a break out and in order to get a bullish signal.
Blue line- support trend line XRPUSD is now trading around $1.16.Short-term trend remains support as long as price is above the blue upward sloping support trend line. This support is at $1.04. Bulls do not want to see price break below this level. If this happens we should expect XRPUSD to fall further, towards $0.90-$0.80. Price is now just above the first orange resistance trend line. It got rejected at the second resistance trend line. If bulls can recapture $1.25, we should then expect XRPUSD to rise towards $1.50 and higher. The material has been provided by InstaForex Company - www.instaforex.com |


| You are subscribed to email updates from Forex analysis review. To stop receiving these emails, you may unsubscribe now. | Email delivery powered by Google |
| Google, 1600 Amphitheatre Parkway, Mountain View, CA 94043, United States | |


Comments