Forex analysis review
Forex analysis review |
- Trading plan for the GBP/USD pair for the week of November 8-12. New COT (Commitments of Traders) report. The pound collapsed
- Trading plan for the EUR/USD pair for the week of November 8-12. New COT (Commitments of Traders) report. The crazy week
- How strong is US dollar
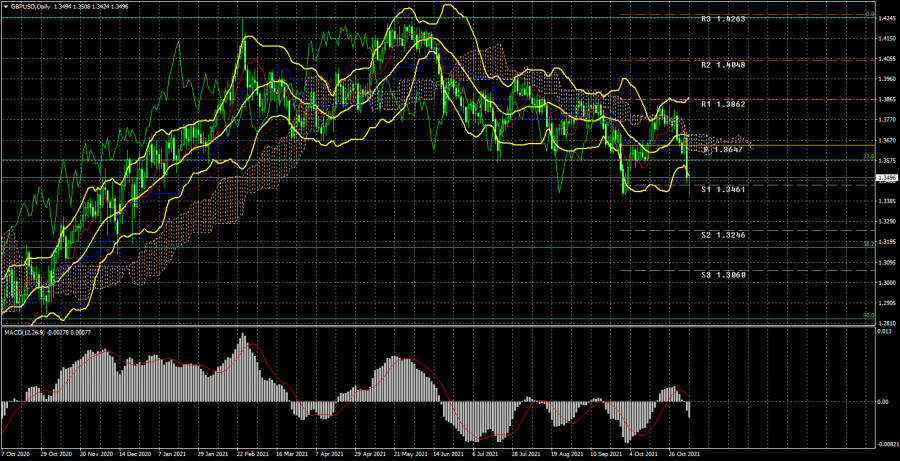
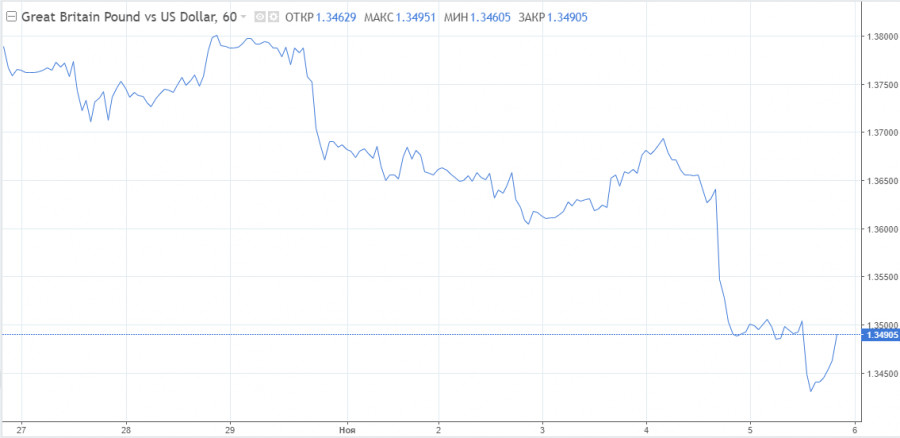
| Posted: 06 Nov 2021 05:29 AM PDT Analysis of GBP/USD 24-hour TF.
The GBP/USD currency pair continues to trade rather confusingly. Look at the illustration above. The current downward movement, which has been going on for 7 months, also does not look like a downward trend, as does the movement of the euro/dollar pair. Therefore, it can be assumed that both pairs continue to adjust. If so, the correction will end sooner or later. If so, then it may end in the near future, as it has been going on for quite a long time. It should also be noted that during all these 7 months, the pair has never managed to gain a foothold above the Ichimoku cloud, although the corrections against the correction are very strong and frequent, which once again confirms the correctional nature of the entire movement. There have been many important events for the British currency this week. In particular, the same Fed meeting, after which the pound began to fall. However, much more important was the meeting of the Bank of England, the results of which were supposed to provoke an increase in the pound by 200 points. But instead, we saw a drop of almost 300. The thing is that in just a few days, several global analytical and news agencies have stated that they believe in a rate hike already at this meeting. Based on what such conclusions were made, if BA has not even reached the curtailment of QE, it is unknown. However, on the day of the announcement of the results of the meeting, the markets did not wait for any rate increase, so a wave of sales of the British currency followed. As a result, the quotes dropped to the support level of 1.3641 and almost reached their previous low. If a rebound from these levels happens, it will be a very good reason to start forming a new upward trend. Moreover, the technical picture for the euro/dollar is also very similar to the end of the downward movement. Analysis of the COT report.
During the last reporting week (October 25-29), the mood of professional traders practically did not change. However, it should be noted that the two most important days of last week ( Wednesday and Thursday, when all the strongest movements occurred) were not included in the latest report. In a week, we will be able to see how much and in which direction the mood of professional traders has changed. In the meantime, we can only draw the same conclusions as a week ago. The green and red lines of the first indicator continue to constantly change the direction of movement, constantly intersect. This suggests that the big players themselves do not understand what to do with the pound. However, this can be seen from the very schedule of the pair's movement, starting from July. For all these 4 months, the pound/dollar pair has been between the levels of 1.3400 and 1.4000. It was during this period that commercial and non-commercial traders changed their mood almost every week. Thus, taking into account the previous changes, we would assume that new growth of the British currency will begin in the near future with the prospect of a 500-point rise. Moreover, the results of the Bank of England meeting were not "dovish". The British currency has fallen undeservedly, which means that the markets may soon recoup this injustice. It should also be noted that during the reporting week, professional traders opened 5.8 thousand contracts for purchase and 7.5 thousand contracts for sale. Thus, the net position has not changed much. Analysis of fundamental events. This week, in addition to the above events, there were also several important publications. However, they were all ignored. In particular, quite important indices of business activity in the US ISM services and manufacturing sectors. But this is not surprising, since the markets from the very beginning of the week were focused on two meetings of central banks, as well as on Friday Nonfarm. As we have already said, such a strong fall in the pound looks unfair, given that two members of the monetary committee voted to raise the key rate, and three voted to curtail the quantitative stimulus program. Consequently, the mood of the Central Bank has become much more "hawkish". Consequently, the pound should have shown growth. Friday's Nonfarm after all no longer had any meaning for traders. After the report was published, the US currency did not even continue to grow, as it had grown by almost 300 points before. Trading plan for the week of November 8-12: 1) The pound/dollar pair has not managed to overcome the upper boundary of the Ichimoku cloud. If it manages to gain a foothold above it once, then the trend may change to an upward one, and in this case, we recommend buying a pair, since the probability of forming a new upward trend will increase significantly. The first target will be the resistance level of 1.3862. Also, in the case of a second rebound from the level of 1.3461, you can buy with a target of 1.3770. 2) The bears managed to keep the pair below the Ichimoku cloud and can now try to build on their success. However, to do this, they need to overcome the support level of 1.3461. If the bears manage to do this, then the chances of further movement to the south will increase, and the target will be the support level of 1.3246. In this case, we recommend continuing to sell the pair. Explanations to the illustrations: Price levels of support and resistance (resistance /support), Fibonacci levels - target levels when opening purchases or sales. Take Profit levels can be placed near them. Ichimoku indicators(standard settings), Bollinger Bands(standard settings), MACD(5, 34, 5). Indicator 1 on the COT charts - the net position size of each category of traders. Indicator 2 on the COT charts - the net position size for the "Non-commercial" group. The material has been provided by InstaForex Company - www.instaforex.com |
| Posted: 06 Nov 2021 05:29 AM PDT EUR/USD 24-hour TF analysis.
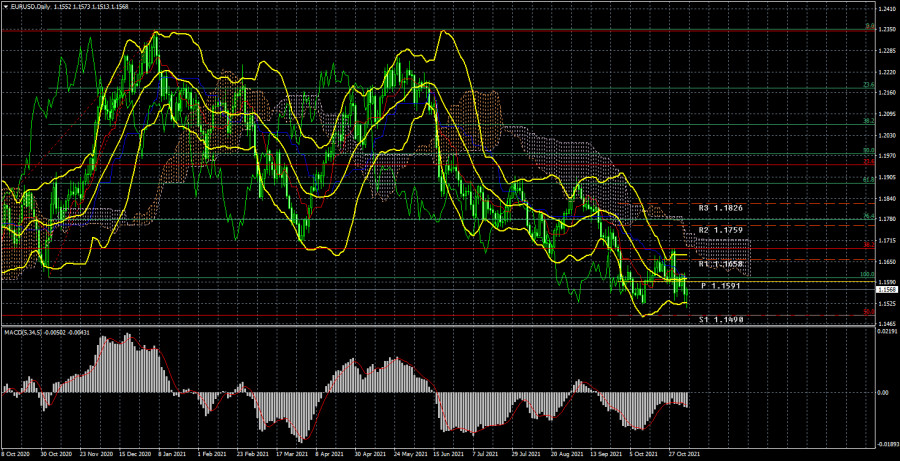
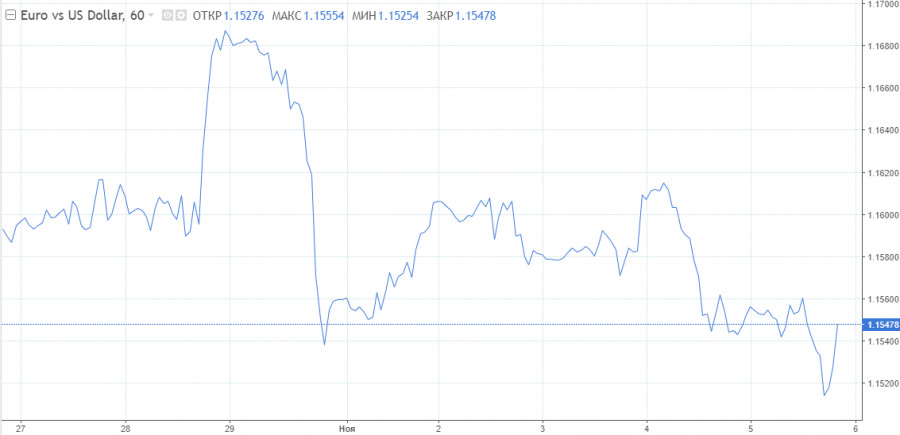
The EUR/USD currency pair during the current week as a whole did not show the volatility and the movement that was expected from it. If you look at the 24-hour timeframe, it becomes clear that the pair at the end of the week remained approximately where it started. And this is although this week the results of the Fed meeting were summed up. And this time concrete and important decisions were made, and the meeting cannot be called a "walk-through". In addition, Christine Lagarde made an important speech, and on Friday Nonfarms were published, which for the first time in three months were on top. But all this was not enough for the pair to start trading more actively. In principle, the illustration above clearly shows that the strongest movement in recent months happened last Thursday when the ECB summed up the results of its meeting. In general, the pair continues to trade near the 15th level, not far from the support level of 1.1490, which coincides with the 50.0% Fibonacci level. The downward trend continues, but the bears seem to have lost their momentum and are no longer able to move the pair further down. We remind you that all the movement in the last 10 months is still a correction against the upward trend, which is confirmed by the Fibonacci levels. Thus, since the price is still located below the Ichimoku cloud, it is not worth talking about a new upward trend now. Nevertheless, the US dollar received the support of the Fed that it was counting on, but this did not have a positive effect on its exchange rate. The markets may have long taken into account the curtailment of the quantitative stimulus program, so the prospects of the US currency remain vague. Analysis of the COT report.
During the last reporting week (October 25-29), the mood of non-commercial traders changed. During the reporting week, a group of "Non-commercial" traders closed 4,000 contracts for purchase and 10.5 thousand contracts for sale. Consequently, the net position of professional players has grown by 6.5 thousand, which is not so much. However, the changes in the mood of non-commercial traders are best seen by the first indicator in the illustration above. The red and green lines have been moving towards each other for a long time, and in the last couple of months, they have been almost at the same level. This suggests that the previous trend is ending, and the mood of the major players at this time is as neutral as possible. This is confirmed by the data on the total number of contracts. The "Non-commercial" group has 195 thousand buy contracts and 199 thousand sell contracts. The Commercial group has 418 thousand contracts for purchase and 442 thousand contracts for sale. As we can see, the numbers are almost the same. Therefore, there are theoretical chances for the continuation of the downward movement in the pair. The trend began to end (an upward trend) when the red and green lines (net positions of the "Commercial" and "Non-commercial" groups) began to narrow. And now, logically, the downward trend continues. However, this "trend" is still not too similar to the trend. Rather, a banal three-wave correction. Analysis of fundamental events. There were plenty of macroeconomic and fundamental events this week. We have already covered the most important ones several times. Nevertheless, it is worth noting once again that the Fed has finally announced the curtailment of the QE program, and NonFarm Payrolls has finally exceeded experts' forecasts. After such positive news, traders could count on further strengthening the US currency. But that didn't happen. Therefore, there are more doubts that the euro/dollar pair can continue the downward movement at all. Recall that a few months ago we expected the end of the downward movement, as global fundamental factors continue to be not on the side of the dollar. However, all this time the pair continues to crawl down. Don't be confused by the scale of movements on a 24-hour timeframe. When volatility remains low for a long time, the scale of the chart increases automatically. The volatility of the pair remains low, and all the recent downward movements are only 600 points. 600 points in 10 months. Perhaps the markets have already worked out all the positives from the States and are no longer ready to continue buying the dollar. Trading plan for the week of November 8-12: 1) On the 24-hour timeframe, the upward trend has not changed, since the bulls were saved near the first serious 38.2% Fibonacci level of 1.1691 a week earlier. At the moment, the quotes remain below the Kijun-sen line, and the markets have shown that they are not ready to buy the pair. Thus, the downward movement may continue with the target of 1.1490, to which there is very little left. But an even greater downward movement is already under great question. 2) As for purchases of the euro/dollar pair, in the current conditions, they should be considered no earlier than fixing the price above the critical line. And ideally, above the Ichimoku cloud, because the price has already overcome the Kijun-sen several times, but then could not continue to move up. There are few prerequisites for a new upward trend to begin in the near future, although the general fundamental background still indicates a very likely fall in the dollar. Explanations to the illustrations: Price levels of support and resistance (resistance /support), Fibonacci levels - target levels when opening purchases or sales. Take Profit levels can be placed near them. Ichimoku indicators(standard settings), Bollinger Bands(standard settings), MACD(5, 34, 5). Indicator 1 on the COT charts - the net position size of each category of traders. Indicator 2 on the COT charts - the net position size for the "Non-commercial" group. The material has been provided by InstaForex Company - www.instaforex.com |
| Posted: 05 Nov 2021 12:25 PM PDT
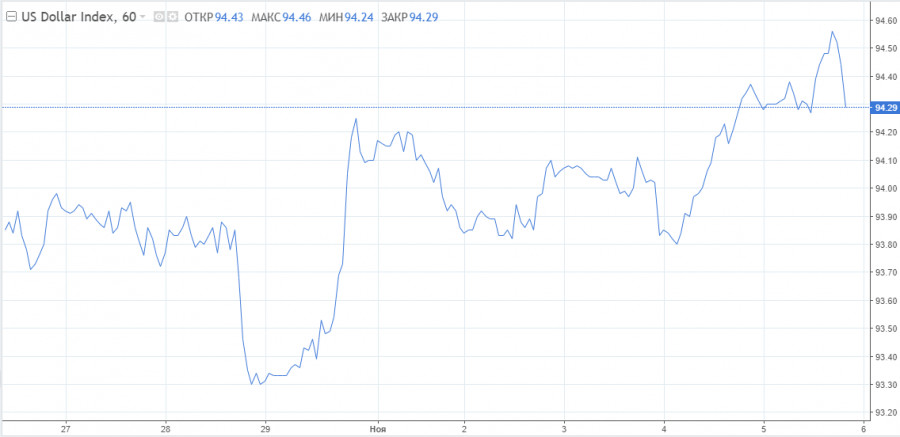
Winding down US stimulus programs has started. Besides, the dollar continues to push back its rivals, moving into the area of 95.00 on the index at the end of the week. There are mixed views concerning further positioning of the US currency.There are mixed views on the further positioning of the US currency globally. Some analysts are excitedly awaiting a further rise of the dollar against the euro to 1.1300-1.1400 and the US currency index above 95.00 points. Others do not believe that the current QE tapering with no minimal signals of an impending rate hike will stimulate the dollar so much that it will soar to new highs. The dollar is rising. However, it does not require to intensify its efforts as its rivals are weak. Besides, the euro has no stimuli for growth. The pound started increasing, but failed. On Thursday, the Bank of England made the pound drop, taking the decision to keep the rate for an indefinite period of time. GBP/USD lost 1.4% in one session. If buyers will not be able to keep the level of 1.3400, the fall will intensify.
On Friday, the markets are focused on October payrolls. A strong figure could be a significant fundamental for further buying. The unemployment rate fell to 4.6% from 4.8% in September and the number of nonfarm payrolls increased by 531,000. Both values came out better than forecast. These are not just strong readings, in this case optimistic Nonfarm Payrolls will return the US to its status of the economic giant among developed countries. It will fulfil favourable conditions for further dollar strengthening. Besides, its bullish trend has been noticeable since the beginning of the year. Overall, this week's news block has enough potential to allow the US index to hit next highs, i.e. to update the highs from September of the previous year. If buyers overcome the 94.80 level, the dollar will reach its all-time highs since July 2020. With this scenario, it is possible to notice a sharp increase in buying the dollar, coupled with a wider upward trend. Resistance is at 94.74 and 95.00. Support is at 93.42, 93.27 and 92.98. The EUR/USD pair fell the day before as euro bulls could not find any reasons to continue buying amid the obvious divergence of the Fed and ECB monetary policy. On Friday, the bearish pressure intensified after the release of strong US labor market data. The last euro recovery was considered a technical correction. Until the EUR/USD pair manages to close the weekly trading above 1.1620, the probability of further declines will remain. If the greenback's bullish momentum starts to intensify with a gradual retracement of the latest US jobs report, EUR/USD may fall to 1.1500, the high of March 9, 2020, just below it. Support is at 1.1525, 1.1500 and 1.1440. Resistance is 1.1620 and 1.1670.
Analysts are mainly pessimistic about the euro. Scotiabank executives expect the EUR/USD exchange rate to fall to 1.1000 next year. First, the euro will miss the level of 1.1500 due to the dovish ECB view. Then there will be a test of 1.1400, which economists expect it will perform quite easily. During 2022 the pair will continue to fall as far as the 10 figure. Besides monetary policy, short-term risks associated with the spread of the COVID-19 pandemic are also an obstacle for the euro's growth. The material has been provided by InstaForex Company - www.instaforex.com |

| You are subscribed to email updates from Forex analysis review. To stop receiving these emails, you may unsubscribe now. | Email delivery powered by Google |
| Google, 1600 Amphitheatre Parkway, Mountain View, CA 94043, United States | |


Comments