Forex analysis review
Forex analysis review |
- Trading plan for the GBP/USD pair for the week of November 15-19. COT (Commitments of Traders) report. Spontaneous and unexpected
- EUR/USD trading plan for the week of November 15-19. COT (Commitments of Traders) report. The inflation report allowed the
- Trading signal for GOLD (XAU/USD) on November 12 - 15, 2021: sell below $1,860 (symmetrical triangle)
- Trading signal for GBP/USD on November 12 - 13, 2021: buy above 1.3370 (SMA 21)
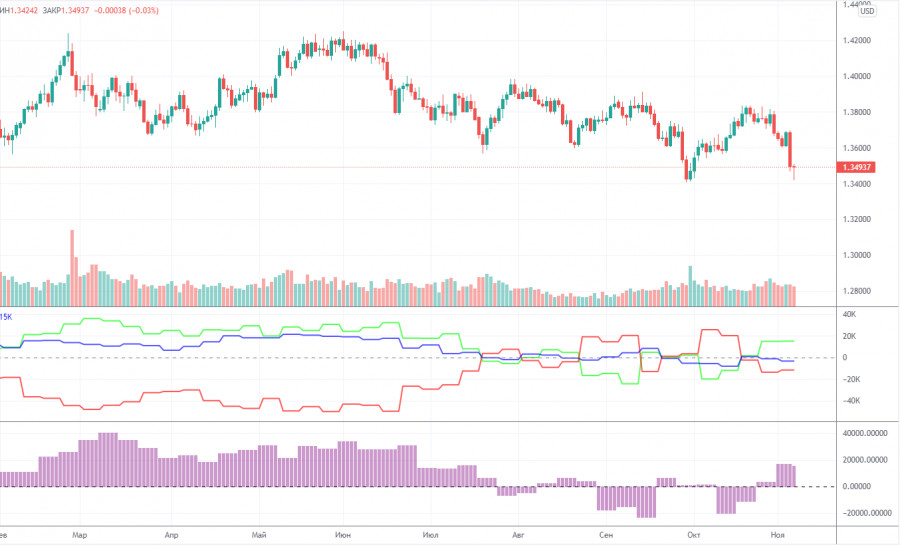
| Posted: 13 Nov 2021 05:06 AM PST th at on the basis of GBP/USD 24-hour TF. The GBP/USD currency pair continued its downward movement during the current week and overcame the first support level at the 24-hour TF 1.3461. In general, the downward trend persists and is visible to the naked eye, however, we once again draw the attention of traders to the fact that corrections within this trend are very deep and quite frequent. Despite the fact that the correction has lasted for about 8 months, during this time the pound sterling has managed to adjust by only 30% against the global uptrend. For example, the euro currency has adjusted by more than 50% over the same period. Thus, the British currency, as before, is very reluctant to give its positions to the dollar. Although just the pound sterling should become cheaper much stronger than the euro currency, given the number of problems and potential problems that exist now in the Foggy Albion. However, the pound shows its resilience and fights for every cent of its own rate. This week, the pair's fall was provided by the same single report on inflation in the United States, which rose to record values over the past 30 years. All the other data (and there were few of them) practically did not interest the markets. Thus, a new round of upward movement had already begun this Monday (as we expected last weekend), but strong macroeconomic statistics spoiled everything. It was impossible to predict such a strong increase in inflation in the United States. However, little has changed for the pound/dollar pair now. We are still waiting for a new round of upward movement, as there are no special reasons for further growth in the dollar after it has already risen by 450 points in two weeks. Analysis of the COT report.
During the last reporting week (October 26 – October 1), the mood of professional traders practically did not change. However, it should be noted that the two most important days of last week – Wednesday and Thursday - when all the strongest movements occurred, were not included in the latest report. That is, in the next report we will be able to see how much and in which direction the mood of professional traders has changed. In the meantime, we can only draw the same conclusions as a week ago. The green and red lines of the first indicator continue to constantly change the direction of movement, constantly intersect. This suggests that the big players themselves do not understand what to do with the pound sterling. However, this can be clearly seen from the very schedule of the pair's movement, starting from July. All these 4 months, the pound/dollar pair has been between the levels of 1.3400 and 1.4000, that is, in the side channel. It was during this period of time that commercial and non-commercial traders changed their mood almost every week. Thus, taking into account the previous changes, we would assume that a new growth of the British currency will begin in the near future with the prospect of a 500-point rise. Moreover, the results of the Bank of England meeting were not "dovish". The British currency has fallen undeservedly, which means that the markets may soon recoup this injustice. It should also be noted that during the reporting week, professional traders opened 5.8 thousand contracts for purchase and 7.5 thousand contracts for sale. Thus, the net position has not changed much. The new COT report was not released on Friday, so we are waiting for it on Monday. Analysis of fundamental events. This week, in addition to the above-mentioned report on inflation in the United States, a fairly important report on British GDP was also released. As in the US two weeks earlier, GDP turned out to be weaker than forecast, which hit the British currency even harder. It should be noted that in the UK, as they say, "not a day without bad news." At the moment, there is an open question of a trade war between the EU and the Kingdom, since the parties cannot come to a common denominator on the issue of the "Northern Ireland protocol". Britain threatens to invoke article 16 and cease to comply with the protocol. In this case, the European Union threatens to cancel the entire Brexit agreement and at the same time the trade agreement, as well as restrict Britain's access to the EU energy market and impose duties on imports from the Kingdom. At the same time, Boris Johnson and his fellow party member got into a corruption scandal. And these are just a couple of recent news from the Foggy Albion. In general, the fundamental background remains weak for the British pound, but previously the same background was simply ignored by the markets. Therefore, it is very difficult to predict whether it will have any significance now. Trading plan for the week of November 15th - 19th: 1) The pound/dollar pair failed to overcome the upper boundary of the Ichimoku cloud. If it manages to gain a foothold above it once, then the trend may change to an upward one, and in this case we recommend buying a pair, since the probability of forming a new upward trend will increase significantly. However, the pair is still very far away from this, since it needs to overcome a distance of at least 300 points up. Thus, purchases are not relevant yet. 2) The bears managed to keep the pair below the Ichimoku cloud and now continue to develop their success. The support level of 1.3461 has been overcome, so the chances of further movement to the South have increased, and the target is the support level of 1.3246. However, you should be careful. The fall this week was spontaneous and unplanned. Next week, traders may try to start forming a new round of upward correction. Explanations to the illustrations: Price levels of support and resistance (resistance /support), Fibonacci levels – levels that are targets when opening purchases or sales. Take Profit levels can be placed near them. Ichimoku indicators(standard settings), Bollinger Bands(standard settings), MACD(5, 34, 5). Indicator 1 on the COT charts is the net position size of each category of traders. Indicator 2 on the COT charts is the net position size for the "Non-commercial" group. The material has been provided by InstaForex Company - www.instaforex.com |
| Posted: 13 Nov 2021 05:06 AM PST EUR/USD 24-hour TF analysis.
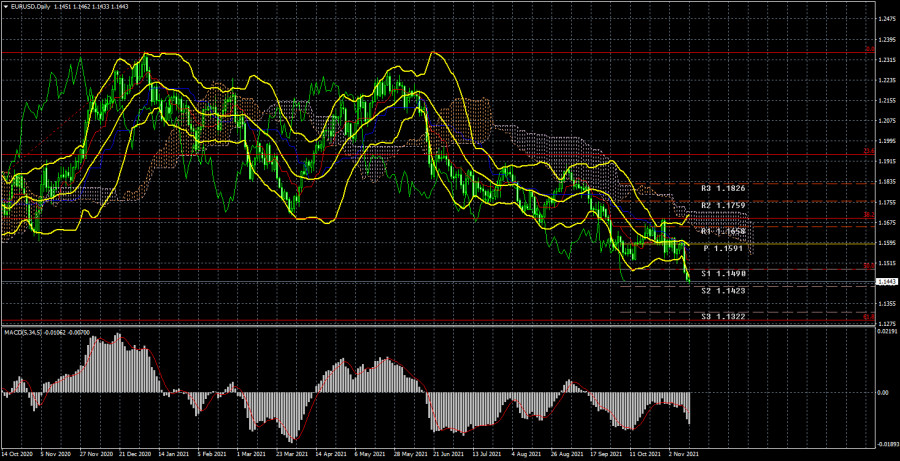
The EUR/USD currency pair has collapsed by 125 points during the current week, which is quite a lot for it. Thus, in the last few months, the strengthening of the US currency has increased quite unexpectedly, and the pair managed to overcome the important Fibonacci level of 50.0% (1.1490) this week. Thus, now the fall of the euro/dollar pair quotes can continue with the targets of 1.1423, 1.1322, and 1.1289. We still consider the current movement to the south as a correction against the global upward trend. However, this correction is very much delayed, as it has been lasting for 10.5 months. The fact remains that the markets have not yet found a reason to buy the euro or sell the US dollar. Thus, the downward trend is now clearly visible on the 24-hour timeframe. The volatility of the pair remains low in most cases, but we have already talked about this hundreds of times. Nothing can be done about it and, from this point of view, a 24-hour TF is now even more appropriate to consider in trading than a 4-hour one. It should also be noted that the growth of dollar quotes this week happened only because of one event. Inflation in the US rose to 6.2% y/y, which exceeded the wildest expectations of the markets. Thus, the US dollar showed strong growth, but this is in some way a paradox. Since, in theory, high inflation is bad for the economy and the national currency. Nevertheless, the markets still regard these macroeconomic statistics differently. In any case, we remind you that any fundamental theory must be confirmed by specific technical signals. Since there are no buy signals now and there are no signals about the end of the downward trend, it is still not recommended to consider purchases. Analysis of the COT report.
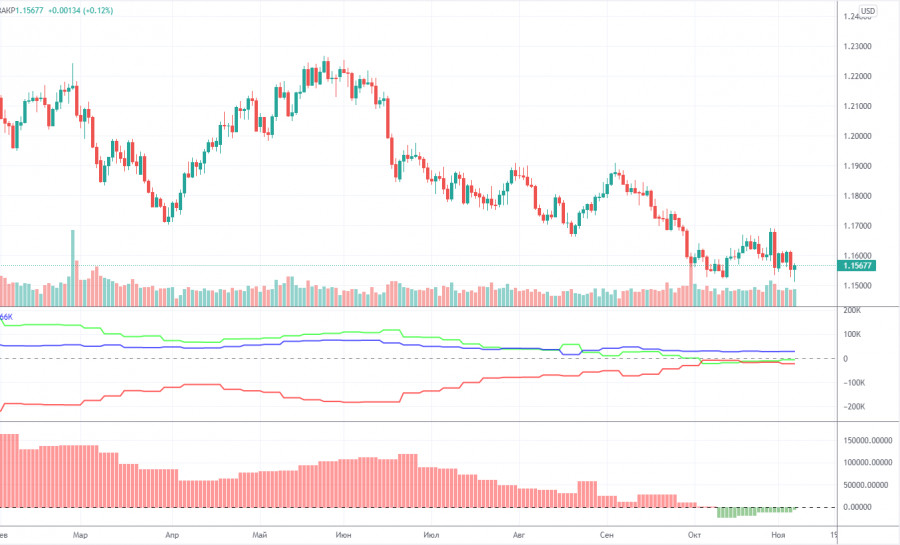
During the last reporting week (November 8-12), the mood of non-commercial traders changed, but not much. A group of traders "Non-commercial" closed 4 thousand contracts for purchase and 10,500 contracts for sale. Consequently, the net position of professional players has grown by 6,500, which is not so much. However, the changes in the mood of non-commercial traders are best seen by the first indicator in the illustration above. The red and green lines have been moving towards each other for a long time, and in the last couple of months, they have been almost at the same level. This indicates that the previous trend is ending, and the mood of the major players at this time is as neutral as possible. This is confirmed by the data on the total number of contracts. The "Non-commercial" group has 195 thousand buy contracts, and 199 thousand sell contracts. The Commercial group has 418 thousand contracts for purchase and 442 thousand contracts for sale. As we can see, the numbers are almost the same. Therefore, there are theoretical chances for the continuation of the downward movement in the pair. The trend began to end (an uptrend) when the red and green lines (net positions of the "Commercial" and "Non-commercial" groups) began to narrow. That is, for quite a long time. And now, logically, the downward trend continues. However, this "trend" is still not too similar to the trend. Rather, a banal three-wave correction. The new COT report was not released on Friday, although it should have been. Thus, it should be expected in the next working days. Analysis of fundamental events. The current week has been as boring as possible in terms of macroeconomic and fundamental events. As mentioned above, there was only one important report on Wednesday - American inflation. This provoked the strong strengthening of the US dollar, which continued on Thursday and Friday. Moreover, on Friday, the dollar had very few reasons to continue growing, as the consumer sentiment index from the University of Michigan dropped from 71.7 points to 66.8. Usually, this indicator does not provoke serious movements. However, if its value changes unexpectedly for the markets and very much does not correspond to the forecast, it can provoke a reaction. And on Friday, there was just such a case. However, traders very quickly digested the weak report for the dollar, and at the end of the day, the US currency still strengthened slightly. Several speeches by Christine Lagarde and Jerome Powell this week did not give any new information to traders. Trading plan for the week of November 15-19: 1) In the 24-hour timeframe, the upward trend has not changed. At the moment, the quotes remain below the Kijun-sen line, and the markets have shown that they are not ready to buy the pair. Thus, the downward movement may continue with targets of 1.1322 and 1.1289. Whatever the fundamental and macroeconomic background, the markets are now favorably looking towards the US currency. Therefore, the pair's sales remain more preferable. 2) As for purchases of the euro/dollar pair, in the current conditions, they should be considered no earlier than fixing the price above the critical line. And ideally - above the Ichimoku cloud, because the price has already overcome the Kijun-sen several times, but then could not continue moving up. There are few prerequisites for a new upward trend to begin in the near future, macroeconomics supports the dollar, and the general fundamental background still indicates a very likely fall in the exchange rate of the US currency. Explanations to the illustrations: Price levels of support and resistance (resistance /support), Fibonacci levels - target levels when opening purchases or sales. Take Profit levels can be placed near them. Ichimoku indicators(standard settings), Bollinger Bands(standard settings), MACD(5, 34, 5). Indicator 1 on the COT charts - the net position size of each category of traders. Indicator 2 on the COT charts - the net position size for the "Non-commercial" group. The material has been provided by InstaForex Company - www.instaforex.com |
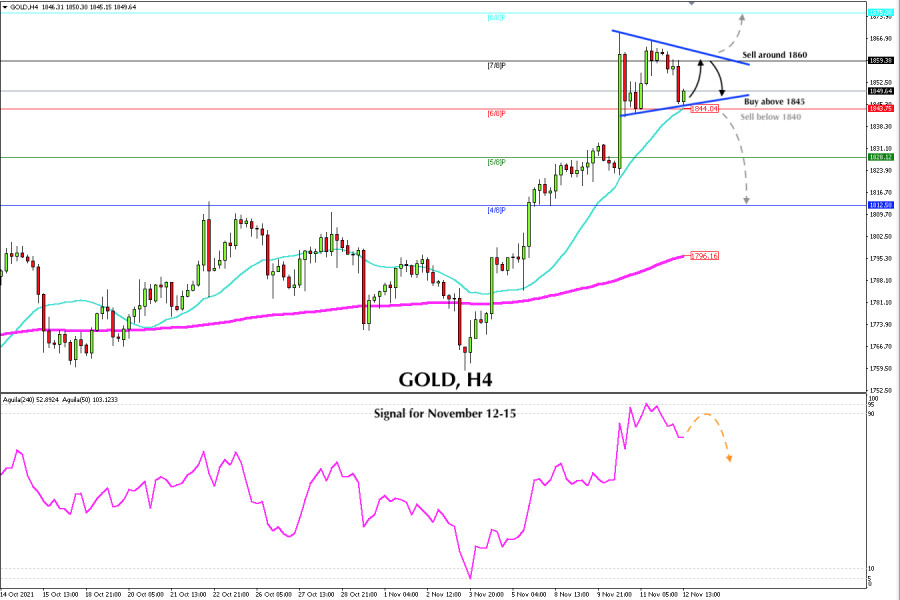
| Posted: 12 Nov 2021 06:59 AM PST On November 10, Gold (XAU / USD) broke sharply the strong resistance of 1,830-1,833 upwards. Above this level, it quickly accelerated its upward movement until reaching the high of 1,868.62. Gold is forming a symmetrical triangle pattern. In the next few hours, it is expected to continue oscillating between the levels of 1,860-1,845. Besides, the support and resistance levels will be shortened.
A decisive break above the symmetrical triangle could accelerate its bullish move to 8/8 of murray located at 1,875. On the contrary, a break below the symmetrical triangle, the SMA of 21 and below 6/8 of murray could accelerate its downward movement and gold could fall to the level of 1,812 there is located 4/8 of murray which represents a strong daily support. We must remember that 1,830 on previous occasions has acted as strong resistance. Now it has become the key support. A pullback towards this zone is expected to give gold a strong bounce, hence we will have an opportunity to buy again. A confirmation of this bearish movement will only occur when the symmetrical triangle pattern breaks below 1,844. This decline could enable a bearish signal and it will be time to sell. On the contrary, a bullish confirmation will occur when gold consolidates above 1,860 and breaks the symmetrical triangle pattern. According to the 4-hour chart, the eagle indicator on November 11 reached the extremely overbought level around 95 points. Every time it reaches this level, the price makes an imminent correction. This is what happened with gold and we saw a fall to the level of 1,846. The strategy would be to monitor the support of 1,845 as the decline to the 1,830 level could accelerate. Support and Resistance Levels for November 12 - 15, 2021 Resistance (3) 1,875 Resistance (2) 1,870 Resistance (1) 1,857 ---------------------------- Support (1) 1,847 Support (2) 1,843 Support (3) 1,837 *********************************************************** A trading tip for GOLD for November 12 - 15, 2021 Sell below 1,860 (7/8) with take profit at 1,845 (6/8) and stop loss above 1,867. The material has been provided by InstaForex Company - www.instaforex.com |
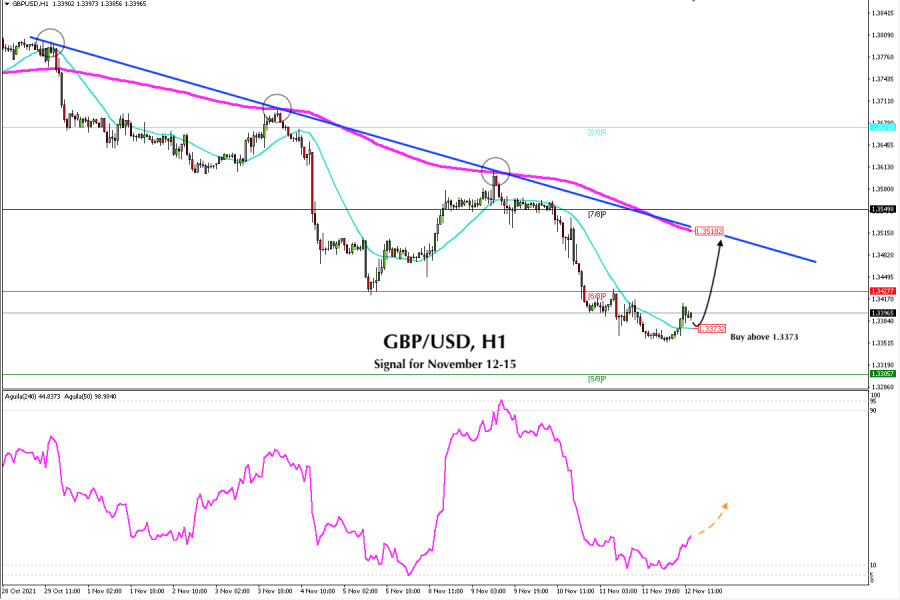
| Trading signal for GBP/USD on November 12 - 13, 2021: buy above 1.3370 (SMA 21) Posted: 12 Nov 2021 06:13 AM PST The British pound reached price levels of November 23, 2020 around 1.3352. At the beginning of the American session, it is trading at 1.3396. GBP/USD is expected to consolidate above the SMA of 21 located at 1.3373. This technical rebound is likely to give it a push to the resistance level of 1.3518. There is the 200 EMA and the top of the bearish channel formed on the 1-hour chart.
The 1-hour chart shows that GBP / USD has been moving below the descending channel that was formed since October 29. The top of the channel located at 1.3520 will offer strong resistance to the pair. Only a daily close above 1.3520 and above the 200 EMA could open the stage for a more decisive bounce towards the key level of 8/8 murray around 1.3671. The eagle indicator has reached the key level of 10 and is showing an imminent sign of a technical bounce. As long as it remains above 1.3370, there is a possibility that GBP could regain some of its losses and could recover in the next few hours. The market sentiment report shows that there are 77.08% of traders who are buying GBP / USD. This is a negative sign for the British pound. A recovery is expected in the next few hours as it is at oversold levels and then it could resume its main downward movement. The key level to sell is at the resistance of the EMA 200 around 1.3520. Our trading plan for the next few hours is to buy the British pound as long as it is above 1.3370. Our targets will be at 6/8 murray around 1.3420. If GBP/USD surpasses this barrier, it could reach 1.3518. A daily close below 1.3370 could resume its bearish move and GBP/USD could fall to support of 1.3305 (5/8). Below we leave the support and resistance levels for the next two days. Support and Resistance Levels for November 12 - 15, 2021 Resistance (3) 1.3487 Resistance (2) 1.3459 Resistance (1) 1.3413 ---------------------------- Support (1) 1.3338 Support (2) 1.3310 Support (3) 1.3262 *********************************************************** A trading tip for GBP/USD for November 12 - 15, 2021 Buy above 1.3373 (SMA 21) with take profit at 1.3427 (6/5) and 1.3520 (EMA 200), stop loss below 1.3328. The material has been provided by InstaForex Company - www.instaforex.com |
| You are subscribed to email updates from Forex analysis review. To stop receiving these emails, you may unsubscribe now. | Email delivery powered by Google |
| Google, 1600 Amphitheatre Parkway, Mountain View, CA 94043, United States | |


Comments