Forex analysis review
Forex analysis review |
- Trading plan for the GBP/USD pair for the week of November 22-26. New COT (Commitments of Traders) report. The British currency
- Trading plan for the EUR/USD pair for the week of November 22-26. COT (Commitments of Traders) report. The euro continues
- GBP/USD: plan for US session on November 19 (analysis of morning trade). British pound falls amid risk of another lockdown
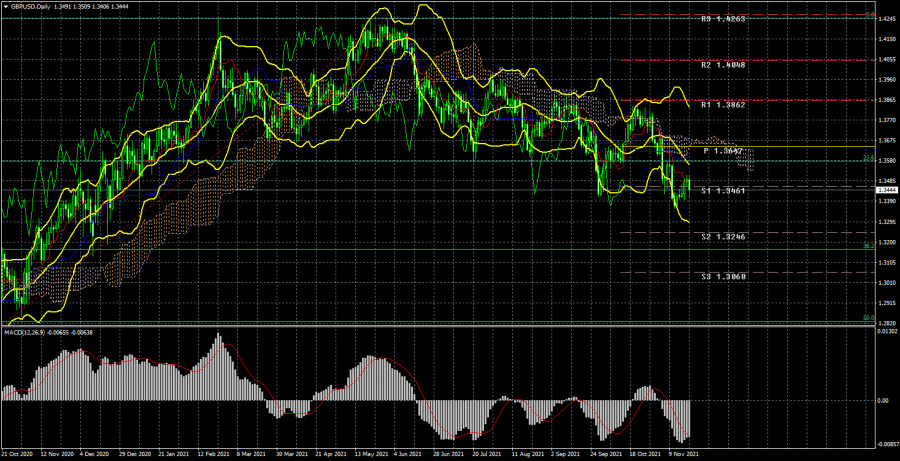
| Posted: 20 Nov 2021 12:22 AM PST Analysis of GBP/USD 24-hour TF.
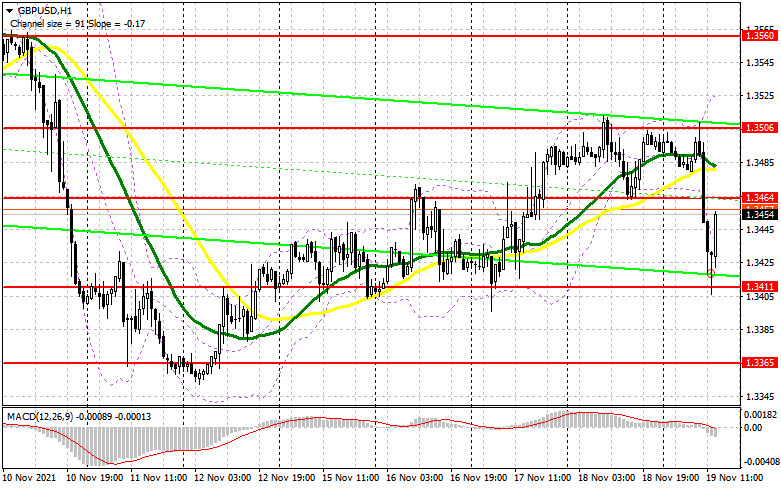
The GBP/USD currency pair has started a new round of correction during the current week. At least, I tried to start it. On Friday, the simultaneous fall of the euro and the pound followed, which is quite difficult to explain, since there were no important publications and speeches in America that day. And in any case, the fall of European currencies began in the morning, when America was still asleep. However, for the rest of the week, the British currency showed an uncertain growth, unlike the euro. Recall that the entire segment, starting from February of this year, when the fall of the pair began, looks like a corrective one. If for the euro/dollar pair the chances of a corrective movement status in 2021 are decreasing, then for the pound/dollar pair they are growing. Frequent and deep corrections do not allow us to conclude that the current movement is a trend. Nevertheless, there is still a downward trend, so short positions remain more preferable. At the same time, we have already said in previous weekly reviews that it would be very logical to see a new round of upward movement of 400-500 points now. A week earlier, it also started, but everything was spoiled by the US inflation report, which provoked a strong dollar growth. There was nothing to spoil the bullish mood of the markets this week, so we still saw a slight increase, which may continue next week. Recall that the pound is still getting cheaper against the dollar much less willingly than the euro currency. And at the same time, it is growing more confidently than the euro. At the moment, the pound has not even managed to adjust by 38.2% against the entire upward trend of 2020. Meanwhile, the euro adjusted by 61.8%. Analysis of the COT report.
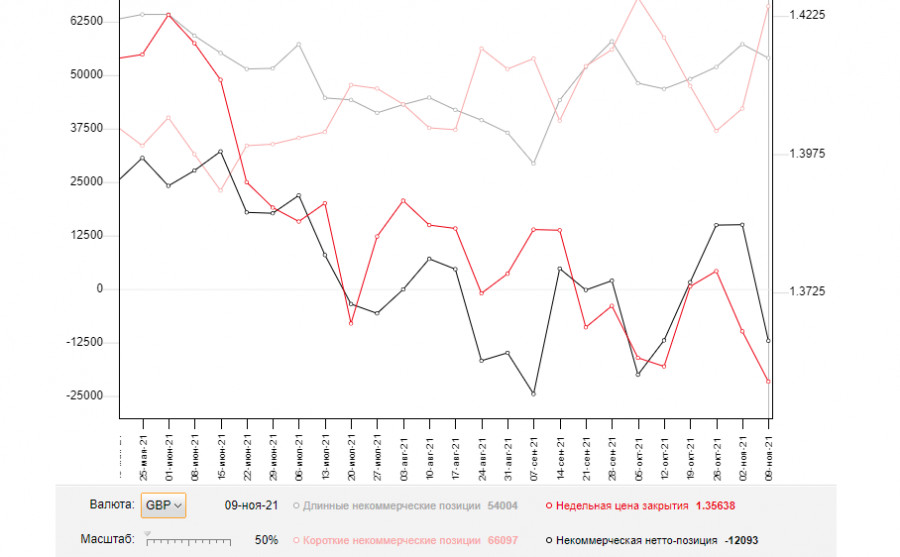
During the last reporting week (November 15-19), the mood of professional traders became much more "bearish". However, this should not be surprising, since the mood of major players has been constantly changing over the past few months, which perfectly reflects the first indicator in the illustration above. The green and red lines, which indicate the net positions (in other words, the mood) of non-commercial and commercial traders, constantly change the direction of movement and constantly change their position relative to the zero level. The last reporting week only confirmed these conclusions. The green line has dropped significantly again, and the red line has increased significantly, although a couple of weeks ago, it was the opposite. Thus, formally, the mood of professional traders has become more "bearish", but in reality, it changes every couple of weeks, so it is impossible to make a long-term conclusion. During the reporting week, the Non-commercial group closed 4,000 buy contracts and opened 17,000 sell contracts. Thus, the net position decreased by 21 thousand contracts at once, which is a lot for the pound. However, this does not matter much, since the net position of non-commercial traders also constantly jumps up and down, which is eloquently signaled by the second indicator in the illustration above. It should also be noted that in the long term, the pound/dollar exchange rate itself also constantly jumps up and down. Thus, it is not possible to make a long-term forecast based on COT reports. Analysis of fundamental events. In principle, the current week for the British currency was quite successful in fundamental and macroeconomic terms. Andrew Bailey did not say anything "dovish" in his speeches. Reports on unemployment in the UK and on inflation were stronger than forecasts. We were also pleased with the retail trade data. But, unfortunately, there is also a general fundamental background for the pound, of a non-economic nature. The geopolitical problems of the pound are not going anywhere. They are only growing. At the moment, the UK and the EU cannot agree on the revision of the "Northern Ireland Protocol", so all economists can stock up on popcorn to watch the new months-long saga of negotiations between Brussels and London. Unfortunately, the new saga may well end in a trade war or sanctions, because London insists on a complete revision of the protocol, and the European Union refuses such a "generous" and "profitable" offer. And by and large, it is not obliged to meet Britain halfway at all, since the Brexit agreement has already been signed and cannot be changed if only one party to the deal wishes. However, the pound may be supported by the Bank of England next month if it starts to wind down its stimulus program or raises the key rate. Trading plan for the week of November 22-26: 1) The pound/dollar pair failed to overcome the upper boundary of the Ichimoku cloud. If it manages to gain a foothold above it once, then the trend may change to an upward one, and in this case, we recommend buying a pair, since the probability of forming a new upward trend will increase significantly. However, the pair is still very far away from this, since it needs to overcome a distance of at least 200 points up. Thus, purchases are not relevant yet. 2) The bears managed to keep the pair below the Ichimoku cloud and now continue to develop their success. The support level of 1.3461 has been overcome, so the chances of further movement to the south are high, and the target is the support level of 1.3246. However, we should be careful: we still expect the formation of a new round of upward correction, based on the general nature of the pair's movement for the whole of 2021. Explanations to the illustrations: Price levels of support and resistance (resistance /support), Fibonacci levels - target levels when opening purchases or sales. Take Profit levels can be placed near them. Ichimoku indicators(standard settings), Bollinger Bands(standard settings), MACD(5, 34, 5). Indicator 1 on the COT charts - the net position size of each category of traders. Indicator 2 on the COT charts - the net position size for the "Non-commercial" group. The material has been provided by InstaForex Company - www.instaforex.com |
| Posted: 20 Nov 2021 12:22 AM PST EUR/USD 24-hour TF analysis.
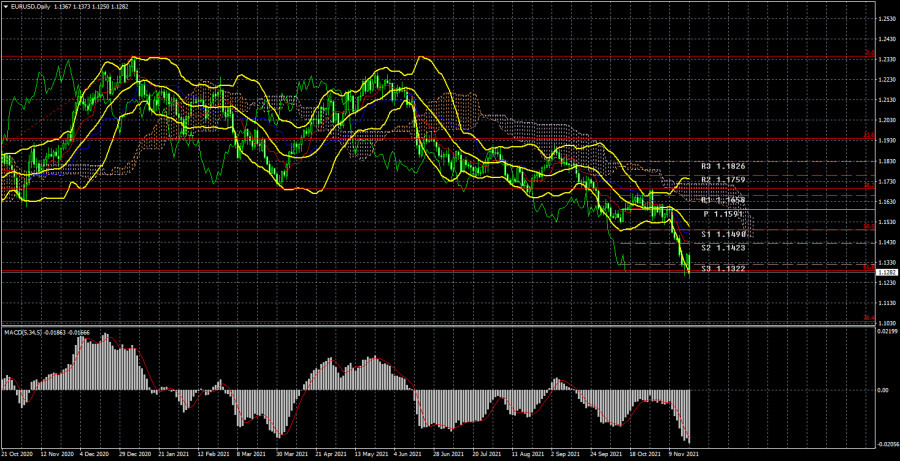
The EUR/USD currency pair has fallen by another 160 points during the current week. Thus, the downward movement continues and it continues as a whole throughout 2021 - for almost 11 months. During this time, the pair's quotes have managed to fall to the Fibonacci level of 61.8%, and, from our point of view, now is the last chance for the pair to keep the global upward trend in force. We remind traders that the euro has been growing for almost the whole of 2020, and the 61.8% Fibonacci level is 61.8% of the total growth for 2020. Thus, formally, the entire movement of 2021 is a correction. However, it should be recognized that over the past few weeks, this correction has become less and less like a correction. Near the 38.2% Fibonacci level, we expected that the strengthening of the US currency would end. However, the markets considered that the high probability of tightening monetary policy in the United States is a good reason to continue buying the dollar. They are partly right since the ECB has been making it clear for several months in a row that it will not raise the rate next year. Christine Lagarde has stated this several times just this week. Therefore, an imbalance has formed between the expected monetary policies of the ECB and the Fed in 2022. And this imbalance is clearly in favor of the American currency. In addition, the European Union is being covered by a new wave of "coronavirus". A month ago, we wrote that several European countries are introducing a new quarantine, and yesterday it became known that from next Monday a lockdown will be introduced in Austria. Moreover, all unvaccinated citizens will be prohibited from leaving the house, and from February 1 next year vaccination will be mandatory for everyone. Thus, the US dollar may also grow against the background of growing fears for the epidemiological situation in the European Union, as well as for the future state of its economy. If other EU countries also begin to close for quarantine, then a new economic decline cannot be avoided. Analysis of the COT report.
During the last reporting week (November 15-19), the mood of non-commercial traders has changed quite a lot. A group of "Non-commercial" traders opened 7 thousand contracts for purchase and 20.5 thousand contracts for sale during the week. Thus, the net position for professional traders decreased by 13.5 thousand, and the mood became more "bearish". It should be noted that the European currency has fallen quite seriously in the last few weeks. But the net position for the "Non-commercial" group, starting from October, practically does not change. This is indicated by the green line of the first indicator in the illustration above. Almost all this time it has been near the zero level, indicating the absence of serious changes in the mood of major players. Thus, if the general trend remains the same – over the past 10 months, major players have seriously reduced the number of longs and increased the number of shorts, then nothing like this has been observed in the last few weeks, and the European currency has been falling anyway. This suggests that what is happening on the market now does not quite correspond to the actions of major players. The second indicator (a net position for professional traders in the form of a histogram) shows at all that in the last 6 weeks the mood of traders has become less "bearish". In theory, at this time, the euro currency should have been growing, not falling. Thus, if we conclude only from COT reports, then the further fall of the euro currency is completely unobvious. Analysis of fundamental events. The current week has been as boring as possible in terms of macroeconomic and fundamental events. It can be safely called the "Christine Lagarde week", as she managed to speak 6 times. And in most cases, she repeated the same thing: there are no plans to raise rates in 2022, and high inflation is temporary. Naturally, the euro did not receive market support on such rhetoric of the ECB chairman. There is nothing to highlight from the reports at all. During the week, data on GDP and inflation in the European Union were published. At first glance, these are very important reports, but at second glance, these are not the first estimates of indicators for the reporting period. Thus, the markets have long known what the values would be and did not react to this data in any way. And it turns out that the whole current week was not so important in terms of the "foundation" and "macroeconomics". Nevertheless, the euro currency showed a strong drop, which again raises some questions. Trading plan for the week of November 22-26: 1) On the 24-hour timeframe, the trend remains downward. At the moment, the quotes remain below the Kijun-sen line, and the markets have shown that they are not ready to buy the pair. Thus, the downward movement may continue with the target of 1.1038. This option will be appropriate if the pair overcomes the 61.8% Fibonacci level. The fundamental background currently supports the further fall of the euro and the growth of the dollar. 2) As for purchases of the euro/dollar pair, in the current conditions, they should be considered no earlier than fixing the price above the critical line. And ideally - above the Ichimoku cloud, because the price has already overcome the Kijun-sen several times, but then could not continue moving up. There are a few prerequisites for a new uptrend to begin in the near future. First of all, technical. Explanations to the illustrations: Price levels of support and resistance (resistance /support), Fibonacci levels - target levels when opening purchases or sales. Take Profit levels can be placed near them. Ichimoku indicators(standard settings), Bollinger Bands(standard settings), MACD(5, 34, 5). Indicator 1 on the COT charts - the net position size of each category of traders. Indicator 2 on the COT charts - the net position size for the "Non-commercial" group. The material has been provided by InstaForex Company - www.instaforex.com |
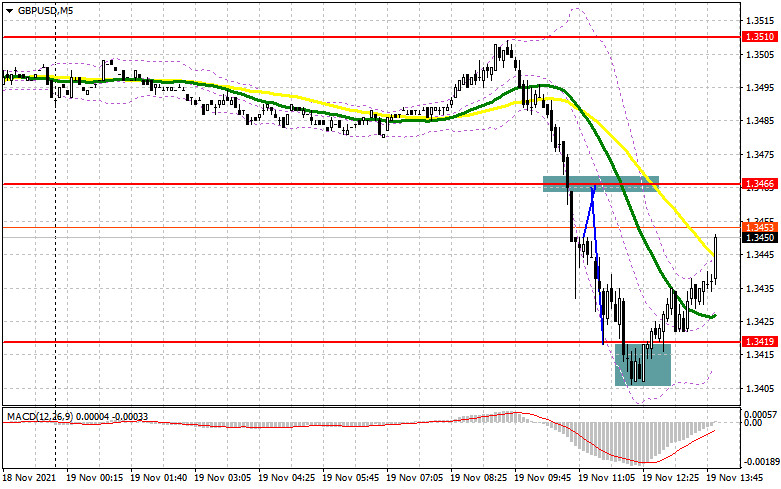
| Posted: 19 Nov 2021 11:44 PM PST To open long positions on GBP/USD you need:The British pound fell dramatically against the US dollar on Friday morning trading. However, it failed to get a favourable entry point for short positions. Let's observe the 5-minute chart and analyze it. The eurozone news that Austria announced a lockdown and Germany is about to do the same is not optimistic for pound buyers. The break of 1.3466 occurred without the reversed test of that level from the bottom to the top, so I missed the entry point. Besides, the formation of a false break at 1.3419 resulted in a good entry point to long positions. At the time of writing the article the growth totaled more than 30 points. The technical picture has changed a little.
In the second half of the day only the representatives of the Federal Reserve System are speaking and there are no significant fundamental statistics. Therefore, traders will continue to follow the results of the Irish protocol negotiations. Bad news will exert more pressure on the pound. However, buyers have a chance to overcome it. A break and a consolidation above the resistance at 1.3464, above which the moving averages pass, would be a powerful impetus for the pound to advance by the end of the day. A test of that level from the top down will provide a profitable entry point to long positions, with the target to return to 1.3506, where I recommend taking profits. Exit above this range will occur only if the parties manage to reach agreement. The test of 1.3506 will form an additional buying signal with the prospect of renewal high of 1.3560, where I recommend taking profit. With a downside scenario in the second half of the day the best entry point to long positions will be the formation of a false break around 1.3411. In case of lack of bulls' activity at this level, pressure on the pound may seriously increase. Besides, the statements of the Fed representatives may also contribute to it. In this case I advise traders to open new long positions only after a false break around 1.3365. It is possible to consider buying GBP/USD on the rebound from the new low at 1.3308, or even lower, from the support 1.3254, counting on the correction of 25-30 pips within a day. To open short positions on GBP/USD you need:Bears got a great chance and they took advantage of it. Their target now is to protect resistance at 1.3464. Only the formation of a false break there will lead to the formation of a good entry point to short positions with the subsequent decline of GBP/USD to the area of the intermediate support 1.3411. Its break will quickly push the pair to the weekly low 1.3365, where I recommend taking profit. A break of this range will be rather significant for sellers. However, it will occur in case the sides declare to end the meetings. A test of 1.3365 from the bottom to the top will be an additional signal to open new short positions with the target to decline to the lows of 1.3308 and 1.3254, where I recommend taking profit. In case the pair is rising during the US trading and there are no sellers at 1.3464, it is better to postpone selling until larger resistance at 1.3506. I advise traders to open short positions on the rebound from 1.3560 or even higher, from the new high at 1.3605, counting on a 20-25 pips rebound within a day.
The COT reports (Commitment of Traders) for November 9 recorded an increase in short positions and a sharp decline in long positions, which led to a negative delta. Weak data on GDP growth in the UK in the third quarter this year, as well as the risk of a more serious slowdown in retail sales in the fourth quarter due to high inflation caused the pund's decline and the continued pressure on it. A significant point was the deterioration in the situation concerning the protocol on Northern Ireland, which the British authorities plan to suspend in the near future. In response to it, the European Union is preparing to introduce certain countermeasures. Moreover, this aspect is not favourable for buyers of the British pound. At the same time, rising inflation and further talks about the need to raise interest rates earlier next year is observed in the United States. This fact provides considerable support to the US dollar. However, I recommend buying the pair at rapid declines, which will occur amid the uncertainty in the Central Bank's policy. The COT report indicates that long non-commercial positions decreased from 57,255 to 54,004, while short non-commercial positions strengthened from 42,208 to 66,097. This resulted in a negative change in the nonprofit net position. The delta totaled -12,093 versus 15,047 a week earlier. The weekly closing price of GBP/USD plunged from 1.3654 to 1.3563 due to the Bank of England's policy.
Indicator signals: Moving averages. Trading is conducted below the 30 and 50 day moving averages, indicating that the market bears are back in control. Note. The period and prices of moving averages are considered by the author on hourly chart H1 and differ from the common definition of classic daily moving averages on daily chart D1. Bollinger Bands. A break of the bottom boundary of the indicator at 1.3411 will increase the pressure on the pair. In the case of growth the resistance will be the upper boundary of the indicator at 1.3525. Description of indicators
|
| You are subscribed to email updates from Forex analysis review. To stop receiving these emails, you may unsubscribe now. | Email delivery powered by Google |
| Google, 1600 Amphitheatre Parkway, Mountain View, CA 94043, United States | |


Comments