Forex analysis review
Forex analysis review |
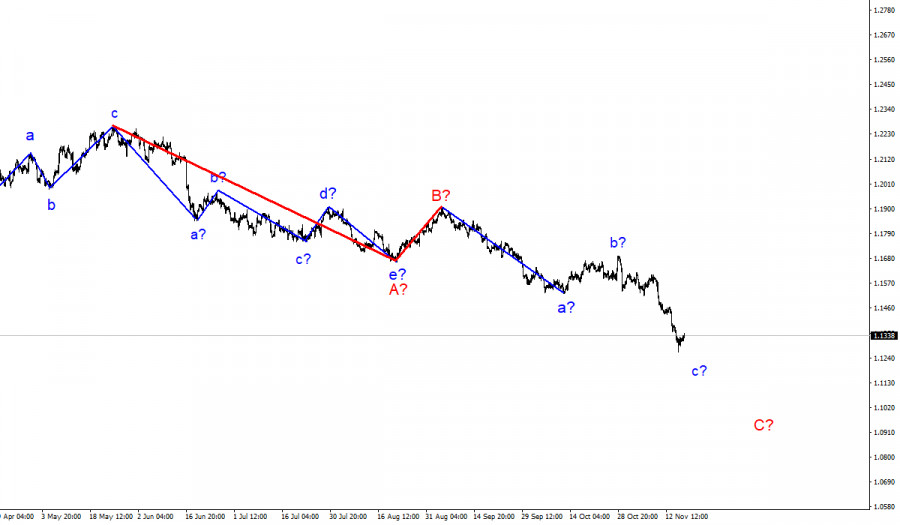
- Overview of the GBP/USD pair. November 19. Northern Ireland is calling for the protocol on its border to be dealt with as
- Overview of the EUR/USD pair. November 19. Jerome Powell or Lael Brainard? That's the question.
- Bitcoin continues to slide into the abyss to the sounds of frightening predictions by crypto experts
- How to trade GBP/USD on November 19? Simple tips for beginners. The pound is struggling to recoup losses
- The real folk blockchain: Binance Smart Chain (BSC) sets new records for the number of transactions on the network
- EUR/USD. Dollar took a break but didn't quit the game
- Although EUR/USD is bouncing, most of the roads are still leading to a stronger dollar
- Bitcoin stops behaving like a stock
- Oil prices depend on how much China can provide from reserves
- Ripple sees Falling Wedge pattern
- Gold strong upside pressure
- USD/CAD buyers look exhausted
- NZD/USD upside reversal
- How to trade EUR/USD on November 19. Simple trading tips for beginners. EUR moves slowly up, overcoming resistance
- Analysis of EUR/USD for November 18; Dollar to advance towards 1.1150
- November 18, 2021 : EUR/USD daily technical review and trading opportunities.
- November 18, 2021 : EUR/USD Intraday technical analysis and trading plan.
- November 18, 2021 : GBP/USD Intraday technical analysis and significant key-levels.
- Bitcoin: what does its correlation with the Nasdaq show?
- Gold: Time to Buy?
- Trading signal for ETH/USD on November 18 - 20, 2021: sell below $4,200 (6/8)
- Trading signal for GOLD (XAU/USD) on November 18 - 19, 2021: sell below $1,850 (symmetrical triangle)
- Bitcoin could drop to $53k: under what circumstances will this negatively affect the global bullish trend?
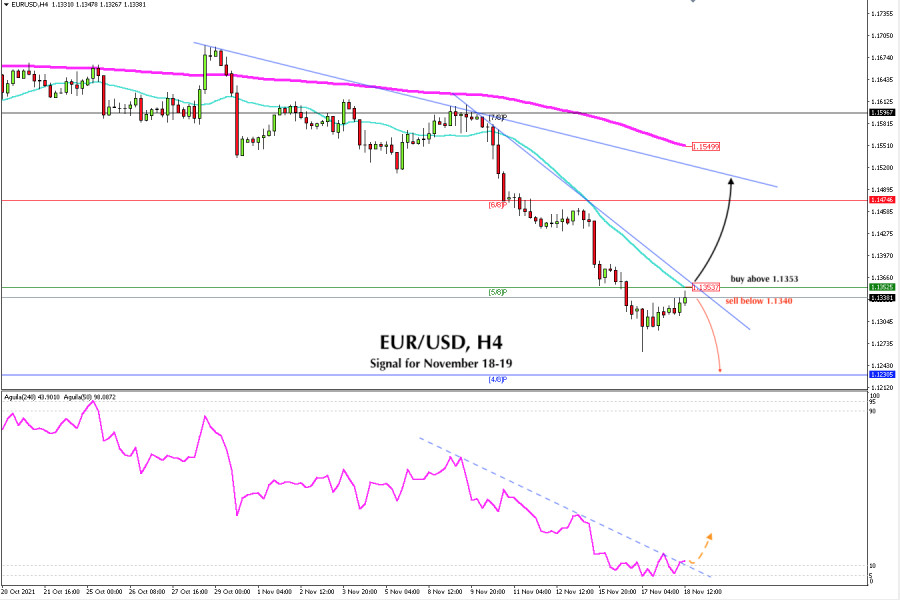
- Trading signal for EUR/USD on November 18 - 19, 2021: buy above 1.1353 (SMA 21 - 5/8)
- XRPUSD vulnerable to more downside if price breaks below $1.
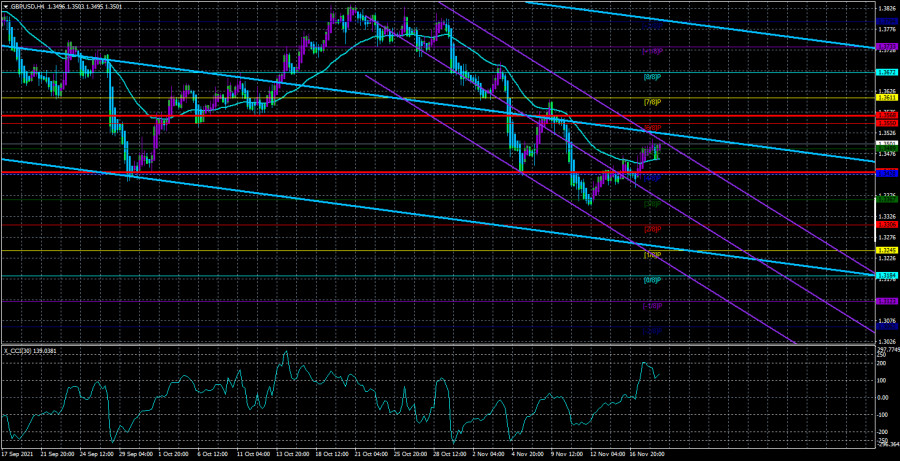
| Posted: 18 Nov 2021 04:35 PM PST 4-hour timeframe
Technical details: Higher linear regression channel: direction - downward. Lower linear regression channel: direction - downward. Moving average (20; smoothed) - sideways. The GBP/USD currency pair tried to continue moving north on Thursday after it consolidated above the moving average line. Thus, formally, the trend has already changed to an upward one. Now everything will depend on the bulls and whether they will be able to find grounds for further purchases of the British currency. We have already said earlier that the fundamental background for the pound/dollar pair is extremely confusing at the moment. There are a huge number of factors that hypothetically can influence the movement of the pair, and it is also quite difficult to clearly understand which of them are taken into account by the market and which are not. Moreover, in recent weeks, the euro and the pound have been moving differently, although quite similar. However, the British currency is still much less willing to fall against the dollar and more willing to grow. Thus, we believe that the fact that the Bank of England made it clear at the last meeting that the key rate could be raised in the coming months is currently playing into the hands of the pound. And in this matter, it turns out that BA will overtake the Fed, which plans the first increase no earlier than April 2022. But the ECB, represented by Christine Lagarde, openly declares that the rate will not be increased next year, and who does not remember, we recall that in the European Union the rate is now -0.4%, that is, negative. And in the USA - 0.25%, in the UK - 0.1%. Thus, those who have reduced the rate less, in the end, will be the first to raise it. The US economy is larger than the UK economy. Therefore, the dollar feels better than the pound, and the pound is better than the euro. The political forces of Northern Ireland have different opinions on Article 16 and the "Northern Ireland Protocol". In the last few days, we have been doing nothing but discussing problems related to the protocol on the customs regime at the border of Northern Ireland. Over the same few days, David Frost, the Brexit minister, managed to make several statements that can be considered quite contradictory. Representatives of the British government regularly talk about Article 16 and they do it for a reason. They make it clear that London will be ready to take this step in a conflict with the European Union. But at the same time, Frost says that no one sets a goal to put this article into effect at all costs. Britain wants to negotiate amicably with the European Union, according to Frost. However, the two-day trip of the Brexit Minister to Northern Ireland itself showed that this issue is very difficult because even the political forces of Northern Ireland cannot agree on what they need: the application of Article 16 or a peaceful solution to the conflict? For example, the Democratic Unionist Party believes that decisive action is needed if the European Union does not want to revise the entire protocol and will not do so in the near future. The party believes that Northern Ireland needs to fully restore its status in the UK market and the British government will have to take unilateral actions to protect Northern Ireland and its residents. But the Sinn Fein party believes that it is time to stop threatening the use of Article 16 since it is important that the conflict does not grow but on the contrary decreases. The Social Democratic Party believes that Article 16 could cause serious economic damage to Northern Ireland if London applies it. And the Alliance party said that it was necessary to sit down at the negotiating table and find a solution that would suit everyone. Thus, it was probably difficult for even David Frost himself to understand what they wanted from the protocol in Northern Ireland. Nevertheless, this question remains open, and how it will be solved is still very difficult to say. The British currency may experience problems if it feels a possible deterioration in relations between the Kingdom and the Alliance.
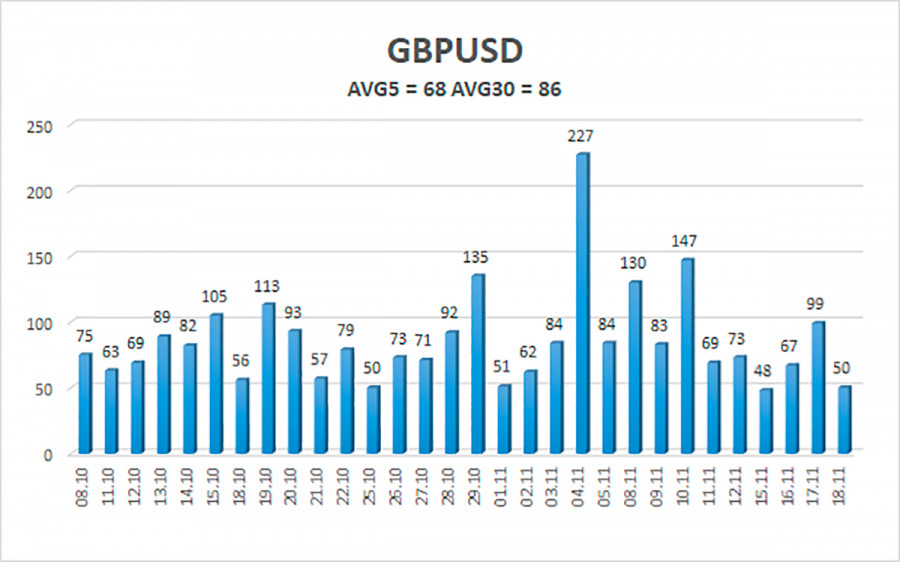
The average volatility of the GBP/USD pair is currently 68 points per day. For the pound/dollar pair, this value is "average". On Friday, November 19, we expect movement inside the channel, limited by the levels of 1.3430 and 1.3568. The reversal of the Heiken Ashi indicator downwards signals a possible resumption of the downward movement. Nearest support levels: S1 – 1.3489 S2 – 1.3428 S3 – 1.3367 Nearest resistance levels: R1 – 1.3550 R2 – 1.3611 R3 – 1.3672 Trading recommendations: The GBP/USD pair overcame the moving on the 4-hour timeframe. Thus, at this time, it is necessary to stay in long positions with the targets of 1.3550 and 1.3568 levels if the price remains above the moving average. Sell orders can be considered if the price is firmly fixed below the moving average line with targets of 1.3428 and 1.3367 and keep them open until the Heiken Ashi turns up. Explanations to the illustrations: Linear regression channels - help determine the current trend. If both are directed in the same direction, then the trend is strong now. Moving average line (settings 20.0, smoothed) - determines the short-term trend and the direction in which to trade now. Murray levels - target levels for movements and corrections. Volatility levels (red lines) - the likely price channel in which the pair will spend the next day, based on current volatility indicators. CCI indicator - its entry into the oversold area (below -250) or into the overbought area (above +250) means that a trend reversal in the opposite direction is approaching. The material has been provided by InstaForex Company - www.instaforex.com |
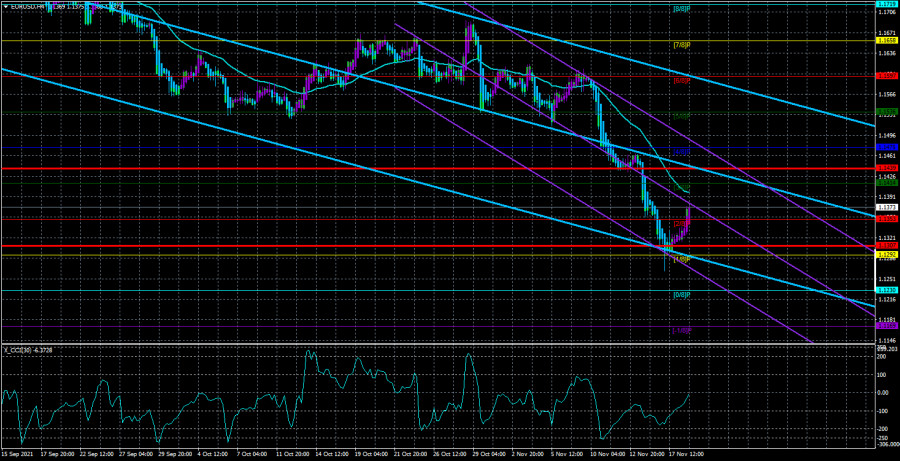
| Overview of the EUR/USD pair. November 19. Jerome Powell or Lael Brainard? That's the question. Posted: 18 Nov 2021 04:35 PM PST 4-hour timeframe
Technical details: Higher linear regression channel: direction - downward. Lower linear regression channel: direction - downward. Moving average (20; smoothed) - downward. The EUR/USD currency pair continued to adjust to the moving average line on Thursday. We have already said in recent reviews that the fundamental background is now quite confusing for the euro/dollar pair since we have to take into account such a factor as market sentiment more than usual. In other words, market sentiment is one of the strongest factors. However, it does not always correlate with the fundamental or macroeconomic background. Thus, participants in the foreign exchange market can actively buy the dollar when there are no visible reasons and grounds for this. A simple example: a large multinational corporation enters the market with a request to buy a huge amount of dollars for trading operations. And this company does not pay attention to what the fundamental background is now and whether it is advisable to buy at this time. The same applies to the operations of central banks, which, through currency interventions, can influence the exchange rate of the national currency for their purposes. Thus, in the foreign exchange market, you can never be 100% sure of anything. Returning to the situation that has developed at this time, it should be said that over the past week the US dollar has strengthened strongly against the euro. However, it is difficult to say even now what caused such a sharp surge of emotions. The very fact that the dollar is getting more expensive for most of 2021 may have both technical and fundamental reasons. The first is the need for correction against the global upward trend of 2020. The second is the belief of the markets that the Fed, as one of the largest central banks in the world, will continue to tighten monetary policy, which will affect the world's largest economy. Nothing else can explain the growth of the US currency. However, we note that the markets have been waiting for the QE program to be curtailed since the summer, and now they are waiting for a rate hike. If this continues, the dollar will rise in price until next summer simply based on market expectations alone. Joe Biden can't make up his mind. Meanwhile, the Fed is now involved in another very important process. President Joe Biden is now choosing one of two candidates to head the Fed for the next 4 years. Jerome Powell's term of office will expire in February next year, and since he is a Republican, there is a high probability that he will leave office. In America, it is customary to choose presidents and heads of the Fed for two terms. But since Donald Trump did not hold on to his post, and it was he who proposed Jerome Powell for this position, the current head of the Fed may resign after Trump. Most interestingly, Powell is not a bad chairman. Of course, there are claims against him too. In particular, Democrats believe that the current head of the Federal Reserve has failed to resolve all issues of corporate ethics, and also pays little attention to global climate change. However, do not forget that Powell led the Fed during the most severe financial crisis and did not let the economy collapse. In general, if you close your eyes to the little things, Powell deserves to have his contract extended. The second candidate is Lael Brainard, a member of the Fed board and the only Democrat on the board. Therefore, it is not necessary to guess for a long time why Brainard was honored to be the main candidate for the position of head of the Fed. It should also be noted that Biden has been unable to decide on the name he will propose to Congress and the Senate for quite a long time, but promised that he would announce it by the end of this week. From our point of view, this person will still be Lael Brainard. At the same time, many experts, including us, believe that with the change of the head of the Fed board, nothing will change in its monetary policy. Brainard also holds "dovish" views, and this is what the White House needs now. The rate will rise next year not because some "hawks" have gathered at the Fed, but because otherwise the US economy will overheat, and inflation will generate stagflation and get out of control. Thus, it does not matter at all who exactly the rates will increase.
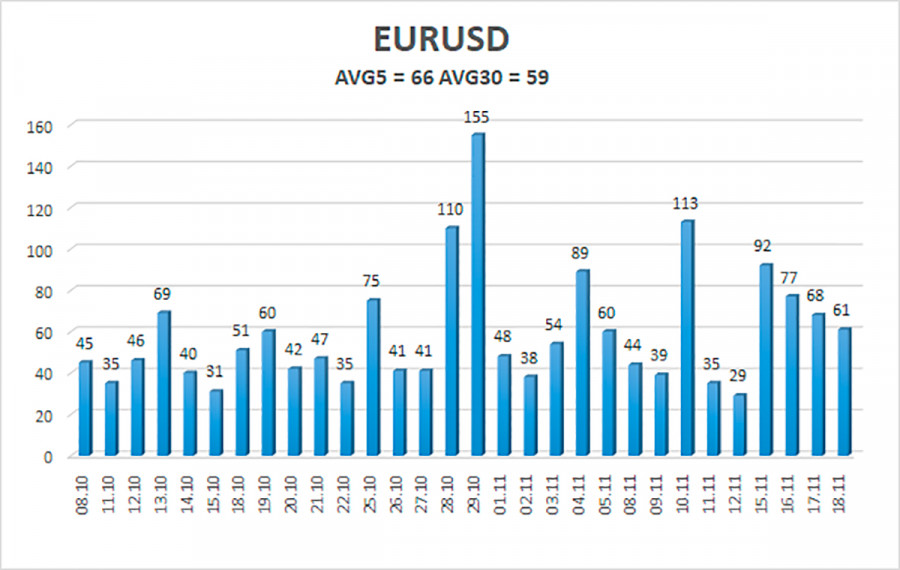
The volatility of the euro/dollar currency pair as of November 19 is 66 points and is characterized as "average". Thus, we expect the pair to move today between the levels of 1.1307 and 1.1439. The reversal of the Heiken Ashi indicator downwards signals the resumption of the downward movement. Nearest support levels: S1 – 1.1353 S2 – 1.1292 S3 – 1.1230 Nearest resistance levels: R1 – 1.1414 R2 – 1.1475 R3 – 1.1536 Trading recommendations: The EUR/USD pair has started to adjust. Thus, today, we should consider new short positions with targets of 1.1307 and 1.1292 after the reversal of the Heiken Ashi indicator downwards or in the case of a price rebound from the moving average. Purchases of the pair should be considered if the price is fixed above the moving average, with targets of 1.1439 and 1.1475. Explanations to the illustrations: Linear regression channels - help determine the current trend. If both are directed in the same direction, then the trend is strong now. Moving average line (settings 20.0, smoothed) - determines the short-term trend and the direction in which to trade now. Murray levels - target levels for movements and corrections. Volatility levels (red lines) - the likely price channel in which the pair will spend the next day, based on current volatility indicators. CCI indicator - its entry into the oversold area (below -250) or into the overbought area (above +250) means that a trend reversal in the opposite direction is approaching. The material has been provided by InstaForex Company - www.instaforex.com |
| Bitcoin continues to slide into the abyss to the sounds of frightening predictions by crypto experts Posted: 18 Nov 2021 01:15 PM PST The rate of the first cryptocurrency updated a three-week low during the trading session on Thursday. So, the value of BTC fell below the $57,600 mark for the first time since October 28. At the time of writing, the price of the digital coin balances at $58,200. Thus, bitcoin lost more than 2% during the day, and its capitalization level sank to $1.1 trillion.
Recall that just over a week ago, on November 10, bitcoin broke the historical record at $69,000 after the previous April high of $65,000. Since then, bitcoin has fallen in price by 15%. By the way, the capitalization indicator of the global cryptocurrency market, which sank below $2.7 trillion and lost more than 3% in a day, also reported a similar loud anti-record (a three-week low). Experts attribute the negative dynamics of the capitalization of the global virtual asset market to a sharp drop in the value of BTC and leading altcoins. So, during the week, Ethereum and Binance Coin sank by 12% to $4,000 and $557, respectively, while Solana and Cardano declined by 14% to $200 and $1.8, respectively. Experts fear that such a frightening decline in bitcoin could provoke an active capitulation of crypto market investors. In addition, many participants in the digital asset market may rush to take profits after the spectacular October growth. On the eve of the popular cryptanalyst and founder of Fairlead Strategies, Kathy Stockton, said that if bitcoin cannot settle above the key mark of $58,000, then it will have another collapse of another 12% ahead of it. At the same time, if a drop below $58,000 still happens, then BTC simply will not find tangible support earlier than at $52,900. In addition, a decrease to $52,900 will make it possible for bitcoin to collapse by 12% from current levels and the transition of digital gold to a bear market. The material has been provided by InstaForex Company - www.instaforex.com |
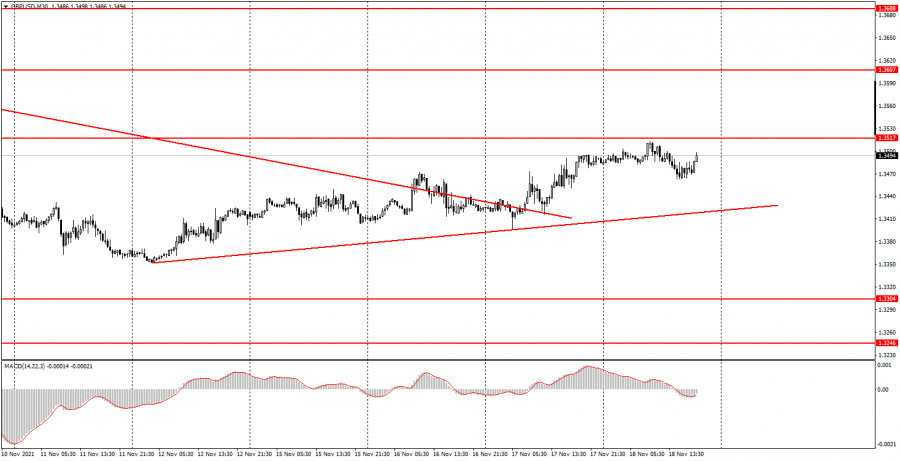
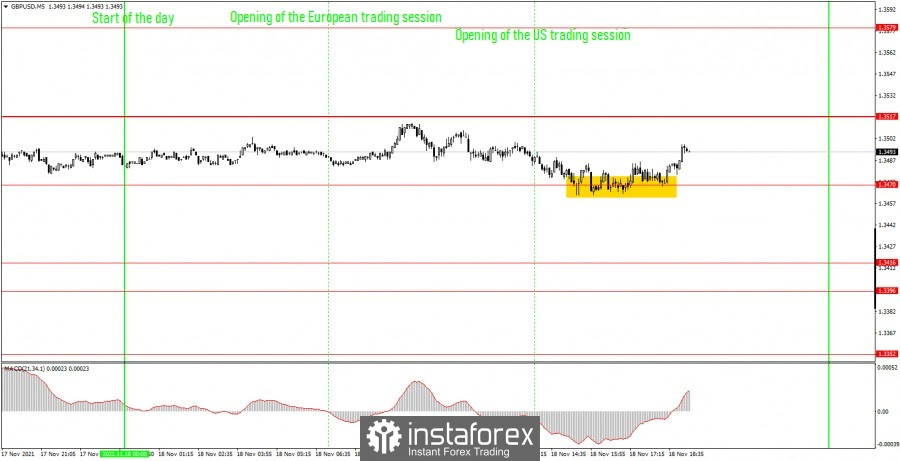
| Posted: 18 Nov 2021 01:15 PM PST Analysis of previous deals: 30M chart of the GBP/USD pair
The GBP/USD pair on the 30 minute timeframe on Thursday, November 18, continued to move up after breaking the downtrend two days earlier. So now an upward trend has formed for the pound/dollar pair, which has its own trend line. This trend is very weak, which is clearly seen from the slope of the trend line. Nevertheless, it is there, and the price is approaching the level of 1.3517, overcoming which will allow the pound to continue to rise. Note that during this day, neither the UK nor America has had a single important macroeconomic report. Thus, newcomers had nothing to pay attention to during the day. And the markets had nothing to react to during the day. Therefore, we would call the current growth of the pair exclusively corrective, since the pair had been falling for a long time before it began. 5M chart of the GBP/USD pair
On the 5-minute timeframe, the movement of the pound/dollar pair looks even more boring on Thursday. It seems that the price did not blatantly stand in one place, but it is clearly visible that it moved mainly sideways. A single signal was formed in the US session when the price bounced off the level of 1.3470. Moreover, "bounced" is a big word, since the signal to buy was formed for several hours. But nevertheless, it formed and even allowed novice traders to earn a bit, since the price still went up and passed around 15-20 points in the late afternoon. And the long position should be manually closed in the late afternoon, since it was not possible to reach the nearest target level of 1.3517, and Take Profit was placed at a distance of 40 points and did not work. How to trade on Friday: At this time, an upward trend has formed on the 30-minute timeframe, which will persist as long as the price is above the trend line. Thus, long positions are now preferred. A rebound from a trend line can be viewed as a buy signal, a breakdown - as a sell signal. The important levels on the 5-minute timeframe are 1.3416, 1.3470, 1.3517, 1.3579. We recommend trading on them on Friday. The price can bounce off them or overcome them. As before, we set Take Profit at a distance of 40-50 points. At the 5M TF, you can use all the nearest levels as targets, but then you need to take profit, taking into account the strength of the movement. When passing 20 points in the right direction, we recommend setting Stop Loss to breakeven. UK retail sales report for October will be released on November 19. Not the most significant report, but if its actual value differs greatly from the predicted one, then a 20-30 points reaction from the markets can be seen. Otherwise, tomorrow will not be more interesting than today. Basic rules of the trading system: 1) The signal strength is calculated by the time it took to form the signal (bounce or overcome the level). The less time it took, the stronger the signal. 2) If two or more deals were opened near a certain level based on false signals (which did not trigger Take Profit or the nearest target level), then all subsequent signals from this level should be ignored. 3) In a flat, any pair can form a lot of false signals or not form them at all. But in any case, at the first signs of a flat, it is better to stop trading. 4) Trade deals are opened in the time period between the beginning of the European session and until the middle of the US one, when all deals must be closed manually. 5) On the 30-minute TF, using signals from the MACD indicator, you can trade only if there is good volatility and a trend, which is confirmed by a trend line or a trend channel. 6) If two levels are located too close to each other (from 5 to 15 points), then they should be considered as an area of support or resistance. On the chart: Support and Resistance Levels are the Levels that serve as targets when buying or selling the pair. You can place Take Profit near these levels. Red lines are the channels or trend lines that display the current trend and show in which direction it is better to trade now. The MACD indicator consists of a histogram and a signal line. When they cross, this is a signal to enter the market. It is recommended to use this indicator in combination with trend lines (channels and trend lines). Important speeches and reports (always contained in the news calendar) can greatly influence the movement of a currency pair. Therefore, during their exit, it is recommended to trade as carefully as possible or exit the market in order to avoid a sharp price reversal against the previous movement. Beginners on Forex should remember that not every single trade has to be profitable. The development of a clear strategy and money management are the key to success in trading over a long period of time. The material has been provided by InstaForex Company - www.instaforex.com |
| Posted: 18 Nov 2021 01:15 PM PST
The proprietary blockchain from Binance Smart Chain sets new records for the number of transactions within the network. Binance Smart Chain recorded more than 14.5 million transactions on Tuesday, an all-time record of any blockchain. This record was 12% more than the previous record, which was also set by Binance Smart Chain. According to Sami Karim, coordinator of the Binance Smart Chain ecosystem, daily transactions through the BSC network have exceeded more than 10 million transactions per day over the past 14 days. Binance Smart Chain can rest on its laurels, as the blockchain has the largest number of transactions with the lowest possible fees. Also, the blockchain prevails over the Ethereum blockchain, since its in-network fees are tens or even hundreds of times less. The record volume of transactions in the Binance Smart Chain network is more than 12 times greater than the daily volume of transactions through the Ethereum network, where about a million transactions per day have been collected over the past week. At the moment, the total commission for transactions through the Binance Smart Chain network is about $800 million, while the total amount of commissions for transactions through the Ethereum network is more than $12 billion. Many holders and traders choose the BSC network, as it is much more profitable and cheaper. Binance Smart Chain has become a really popular ecosystem for many traders, as well as a real godsend for decentralized applications. At the moment, more than 800 applications are running on this network, such as PancakeSwap and Alpha Finance. Binance Smart Chain is indeed a very strong competitor to Ethereum, at the moment the demand for this blockchain far exceeds the demand for ERC20. Binance has created a prize fund of more than $1 billion for developers who will create tokens developed on their blockchain. People choose this blockchain because of its low fees, and if ethereum does not release its ethereum 2.0 update with a reduction in fees, then BEP20 will dominate for many years. However, do not forget about other blockchains, which are also popular, since their commissions are also quite low, such as TRC20, Cardano, and Solana. The material has been provided by InstaForex Company - www.instaforex.com |
| EUR/USD. Dollar took a break but didn't quit the game Posted: 18 Nov 2021 01:15 PM PST The greenback suspended its offensive after almost a week-long march. The US dollar index approached the borders of the 96th figure (high since July 2020) and froze in place waiting for the next information impulse. Paired with the euro, the dollar also took a break. EUR/USD bulls were able to take advantage of the moment by organizing a small correction to the middle of the 13th figure. This price behavior looks quite logical, especially after updating the 16-month low. The pair plunged for several days – rapidly and almost recoilless, accumulating the potential for a corrective rebound. Yesterday, the fuse of bearish sentiment dried up: after reaching the 1.1264 mark, traders recorded profits and retreated from the conquered frontiers. However, it is impossible to talk about a trend reversal in any case: the dollar's positions are too strong and the euro's positions are too weak. Therefore, when the corrective impulse fades, it is advisable for traders to go into sales again, focusing on the target levels of 1.1300 and 1.1264.
It is noteworthy that the US currency ignored several macroeconomic reports today, which turned out to be quite good. In particular, the Fed-Philadelphia manufacturing index jumped immediately to 39 points in November (with a forecast growth of up to 24 points). This is the best result since April of this year. We were also pleased with the weekly data on the labor market. The number of initial applications for unemployment benefits increased by 268,000 over the past week. This indicator has been consistently decreasing for the past seven weeks. And although the downward trend has been smoother in the last three weeks, the trend itself cannot help but please. And here it is necessary to recall that in recent weeks, US reports have been exceptionally positive. Nonfarm, data on retail sales, industrial production and, of course, inflation were released in the green zone. Strong releases spurred interest in the dollar, which rose in price due to increased hawkish expectations. Comments by some current and former members of the Federal Reserve only fueled these expectations. James Bullard, Loretta Mester, Charles Evans, in particular, spoke in favor of raising the interest rate. According to the Fed's point forecast, which was published in September, 9 members of the Committee admit a tightening of monetary policy as early as 2022. Former representatives of the US central bank, including William Dudley and Jeffrey Lacker, joined the hawk wing of the Fed. In particular, Dudley expressed confidence that the Fed will have to raise the interest rate next year - "and even at a higher rate than the market currently assumes." However, the market is already slowly revising its forecasts, shifting the focus to the implementation of a more hawkish scenario. For example, the currency strategists of the international financial conglomerate Citigroup said that the Fed will start raising the rate "earlier than the previously designated deadline and at a faster pace." According to their calculations, the central bank will hold 9 rounds of rate increases in the period 2022-2025. JPMorgan economists, in turn, also expressed confidence that the Fed will begin to tighten its policy in the middle of next year. In their opinion, the first round of rate hikes will take place in September, the second in December. A similar position was voiced by representatives of the conglomerate Goldman Sachs. They are also confident that the central bank will raise the rate twice in 2022. In general, according to 29 out of 37 economists polled by Reuters, the risk that the Fed may raise interest rates "earlier than the declared deadline" (that is, earlier than 2023) has "increased significantly recently." Even representatives of the centrist wing of the Fed were concerned about the jump in inflation. In particular, today the corresponding rhetoric was voiced by the head of the Federal Reserve Bank of New York, John Williams. He said that the central bank notes a strong increase in inflation, "even taking into account the effect of the low base of last year." He also noted that long-term inflation expectations "have risen again." In the wake of hawkish expectations, the dollar paired with the euro strengthened by almost 300 points in less than five trading days. There are no grounds for a reversal of the downward trend: the issue of raising the Fed rate next summer is still on the agenda. The European currency still does not have counter arguments to strengthen its position in the market. ECB representatives continue to insist on maintaining a soft monetary policy - both this year and next. In particular, today the chief economist of the central bank, Philip Lane, said that he does not expect inflation expectations to rise above the ECB's target level. In other words, the dollar only took a pause, allowing the EUR/USD bulls to organize a correction. The ceiling of the upward pullback, in my opinion, is the 1.1410 mark - this is the upper line of the Bollinger Bands indicator on the four-hour chart. As soon as the corrective impulse begins to fade (most likely, this will happen after buyers fail to settle above the specified resistance level), it is advisable to consider short positions for the pair. The first goal of the downward movement is the psychologically important mark of 1.1300. The main target is located just below - 1.1264 (the price low of the year). The material has been provided by InstaForex Company - www.instaforex.com |
| Although EUR/USD is bouncing, most of the roads are still leading to a stronger dollar Posted: 18 Nov 2021 01:15 PM PST
The greenback staged such an impressive rally that even the former bears began to wait for its outperformance against other currencies. At the same time, the euro's weakness was the most notable phenomenon among colleagues on the shop floor. However, having reached a peak since July 2020 above the 96.00 mark, the USD index plunged on Wednesday following the yield of treasuries. This made it possible for the EUR/USD pair to bounce back from the 16-month low previously noted in the area of 1.1260. On Thursday, the US currency suffered losses for the second consecutive day, trading with a decline of more than 0.2%, about 95.60. Traders are now wondering whether the upward momentum in USD is starting to fade, or whether it is worth waiting for its continued growth. Disputes over the timing of the possible completion of the Federal Reserve's stimulus program and subsequent rate hikes are likely to continue as early as 2022, increasingly unnerving participants in the US debt market. In addition, the issue of the US national debt limit for next year reappears on the agenda, the deadline for which comes in December, requiring politicians in Washington to reach compromises or make sole decisions of the Democrats. US Treasury Secretary Janet Yellen has already warned Congress that her department may be left without money after December 15 if lawmakers do not raise the debt ceiling. She clearly indicated that this deadline is directly related to the new obligations that the Ministry of Finance has incurred after the adoption of the bill on infrastructure spending in the United States. Investors believe that such an impressive package of government spending will become another driver of consumer price growth and will further increase inflation by 0.3-0.5% in less than a year. If these expectations are met, the US central bank will have another reason to normalize monetary policy. Ironically, a surge in inflation may play into the hands of Fed Chairman Jerome Powell, who is waiting for US President Joe Biden's decision on reassignment. No matter how mistaken the current head of the Fed is about inflation, Lael Brainard is considered an even bigger dove. However, inflationary records may require the US central bank to become hawkish faster. In addition, galloping inflation does not add points to Biden, whose rating leaves much to be desired.
If consumer prices in the US continue to grow at a high pace, then we will hear a lot of speeches in favor of the dollar's growth already at the December FOMC meeting. In recent weeks, the greenback has benefited from the market's bet that the Fed will counteract rising inflation faster than many of its counterparts in developed countries. This opinion was reinforced last month by strong data on the US labor market. "The Washington Post recently published an article stating that incorrect accounting of data from the Bureau of Labor Statistics and other factors mean that more than 625,000 jobs in the United States were not taken into account for the period from June to September. If this is the case, and these changes will appear in the next reports along with strong new data for November, it may be a harbinger of a much sharper tightening of Fed policy than previously expected. At the December FOMC meeting, it is possible that it will announce a twofold increase in the QE reduction coefficients, despite the fact that the market is approaching the timing and pace of the key rate increase," Saxo Bank analysts noted. The Fed's curtailment of the bond purchase program will be completed by the middle of next year, although the central bank is still waiting for signals of a slowdown in inflation, Chicago Fed Governor Charles Evans said on Wednesday. "We realized back in 2013 that the gradual curtailment of such asset purchases is the preferred measure for the functioning of the financial market, and that if we abruptly stop purchases, it will be poorly received," he said. "It will take until the middle of next year to complete this folding. We will pay attention to inflation and try to understand how much additional stimulus contributes to higher inflation. If this is the case, we will think about when it is best to start raising rates," Evans said. The US central bank began reducing the volume of monthly bond purchases in November and plans to completely curtail the quantitative easing program by June 2022. JPMorgan strategists predict that the Fed will raise interest rates next September with a further hike in December and another in the following quarter.
"The stability of the dollar's growth in the next few months looks far from unambiguous. Market expectations regarding the Federal Reserve are becoming particularly hawkish, which indicates the limited nature of support for the USD in the future from this factor," analysts at Pictet Wealth Management believe. ING analysts are more optimistic about the greenback. "Most roads lead to the strengthening of the dollar. The Fed may raise rates as early as next summer. A good growth momentum in 2022 (we forecast US GDP at 5%), backed by strong corporate and consumer balance sheets, should mean that price pressures will persist and inflation remains above 3% throughout the year," they said. "The main risk for this scenario is stagflation, when an early increase in rates to eliminate a temporary price shock provokes a recession. However, even if this happens, stagflation will be a negative moment for risky assets and will support the counter-cyclical dollar," ING believes. "Perhaps the only scenario for a much stronger EUR/USD pair in 2022 would be a strong global recovery, the revival of the eurozone and the transformation of the Fed into a dove. Given that disruptions in the supply chain are expected to have an impact on economic growth in Europe with a high level of production next year, such a scenario seems unlikely," the bank's analysts noted. The main currency pair continued its recovery on Thursday, rebounding from the lowest levels since July 2020 by more than 100 points. However, bears are unlikely to retreat easily, given that the factors that recently led the pair to 16-month lows will not disappear soon. "There are two weeks left until the next ECB meeting and the update of its forecasts. Meanwhile, ECB President Christine Lagarde expressed concern about the increase in the number of COVID-19 infections in the EU, while confirming the patient position of the regulator and the fact that the current inflationary pressure in the region remains temporary, despite the fact that it is more persistent," Westpac strategists said. "The November reports on consumer confidence and business activity in the eurozone, which will be released next week, will be of increased interest. If there are any signs that COVID-19 cases will affect the reports, the euro will be under increasing pressure. The rebound of the EUR/USD pair is likely to be limited to the 1.1400 mark, unless the data turns out to be particularly strong. A break below 1.1250-1.1275 may trigger another decline by two figures," they added. The material has been provided by InstaForex Company - www.instaforex.com |
| Bitcoin stops behaving like a stock Posted: 18 Nov 2021 01:14 PM PST This week, bitcoin fell by 7% and at some point approached $58,000, while the Nasdaq 100 shows a slight increase. For some, the fact that the pullback did not have wider ramifications shows that bitcoin remains far from the mainstream. Bitcoin ceases to behave like a stock The pandemic-era correlation between bitcoin and Nasdaq 100 futures is disappearing. This, coupled with the recent correction, provokes debate about what role the token can play in investment portfolios. The 30-day correlation between virtual currency and futures has dropped to almost zero in recent days, from a 2021 peak by the end of September of 0.56 - a value that suggests tech stocks and bitcoin often move in tandem. The correlation has generally been positive since February 2020. Bitcoin is up about 40% since the end of September, surpassing the Nasdaq 100's 11% rise. The stated role of the token as a means of protection against inflation with a sharp increase in prices in the global economy is one of the factors that led to the growth of the digital asset to a peak of almost $69,000 on November 10. Carsten Menke, head of the new generation research department at Julius Baer in Zurich, believes that the evolution of the relationship between stocks and bitcoin does not harm the arguments that it is a reliable modern means of saving for portfolios. "The lack of consistent and negative correlation between bitcoin and stocks clearly indicates that bitcoin is not yet a safe haven," he said, stressing that in times of stress in the financial market, it tends to suffer like other riskier assets. Bitcoin hovered near a key inflection point of $60,000 on Wednesday as traders seemed to restrain the excessive speculation that last week led to a record price for the world's largest cryptocurrency. The digital currency fell 3.4% before offsetting losses and remaining unchanged. Some observers attribute the recent drop from a record high of $68,991 to profit-taking before the end of the year. But the decline in the number of meme coins such as Dogecoin and Shiba Inu also suggests that cryptocurrencies may "wash away some speculation" by retail traders, analyst Mike McGlone said. The material has been provided by InstaForex Company - www.instaforex.com |
| Oil prices depend on how much China can provide from reserves Posted: 18 Nov 2021 01:14 PM PST Oil fluctuated between small gains and losses as China said it was working to release oil from strategic reserves. Futures in New York on Thursday were trading around $78 per barrel. Oil prices depend on how much China will be able to provide from reserves This was the result of the long-awaited cooperation between China and the United States in order to curb electricity prices. China's actions follow a virtual summit between U.S. President Joe Biden and Chinese President Xi Jinping earlier this week, at which energy supplies were discussed. With rising inflation in the global economy, key oil consumers are trying to influence prices. The International Energy Agency said this week that current market tensions are starting to ease as global production increases and volumes of oil transported by sea have increased sharply in recent weeks. "It looks like the release of the SPR will happen soon," said Giovanni Staunovo, a spokesman for UBS Group AG. "The only question is when it will happen and how much oil they will release." Earlier this year, China tapped its national crude oil reserves to lower domestic prices and also made a private sale from the reserves. On Thursday, a spokeswoman for the reserve bureau said that more detailed information about the volume and date of the sale will appear on its website in due course. In the physical market, there is growing concern about the demand for oil in the country, as spot premiums for a key Russian grade preferred by Chinese independent refiners have fallen by more than $1 per barrel due to the likelihood of a new tax investigation, according to traders. Earlier this week, the variety was trading at its highest premium since January 2020. The material has been provided by InstaForex Company - www.instaforex.com |
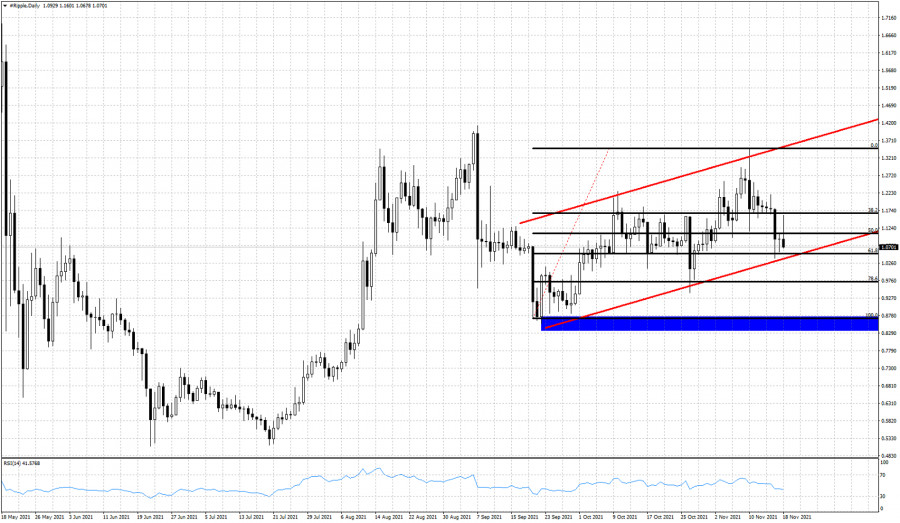
| Ripple sees Falling Wedge pattern Posted: 18 Nov 2021 12:25 PM PST Ripple plunged in the short term after failing to stabilize above 1.3 psychological level. At the time of writing, it was traded at 1.0522 level above 1.0156 today's low. Technically, the price action developed a potential Falling Wedge pattern, but this reversal formation is far from being confirmed. XRP/USD dropped as the price of Bitcoin extended its sell-off. XRP/USD registered a 24.73% drop from 1.3494 higher-high registered on November 10th to 1.0115 today's low. In the last 24 hours, the volume increased by 38.05%. XRP/USD at support
As you can see on the H4 chart, XRP/USD registered a false breakdown with great separation below the uptrend line and now is struggling to rebound. The pressure remains high as the rate stands below the downtrend line. 1.0 psychological level stands as a major support level. Staying above the uptrend line and making an upside breakout from the Falling Wedge formation could signal that the downside movement is over and that the XRP/USD could turn to the upside. Ripple forecastValidating the bullish reversal pattern could signal a new leg higher. On the other hand, closing and stabilizing under the uptrend line may signal a deeper drop. The material has been provided by InstaForex Company - www.instaforex.com |
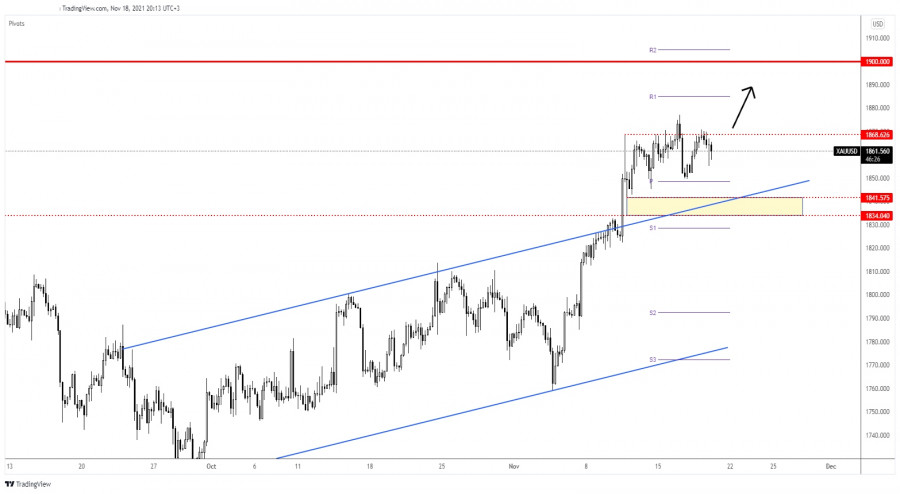
| Posted: 18 Nov 2021 10:58 AM PST Gold may move somehow sideways in the short term. The bias remains bullish, so further growth is still in cards. The yellow metal dropped a little today as the dollar Index tried to rebound. Still, XAU/USD could jump higher as DXY plunged in the last hours. The US Unemployment Claims was reported at 268K above 260K expected in the previous week. The greenback depreciated after the US Jobless Claims indicator come in worse than expected. XAU/USD imminent breakout
XAU/USD continues to stay near the 1,868.62 static resistance. Jumping, closing, and stabilizing above this obstacle may signal an upside continuation. As you can see on the H4 chart, the price of gold failed to reach the 1,848.66 weekly pivot point signaling strong buyers. Technically, the up channel's upside line and the area of 1,841.57 - 1,834.04 are seen as major downside obstacles. XAU/USD could resume its growth as long as it stays above these levels. In the short term, a temporary decline could only help us to catch a new swing higher. Gold predictionStaying near 1,868.62 indicates an imminent upside breakout. Making a valid breakout through this level, registering a new higher high, a bullish closure above 1,870.94, could activate an upside continuation. Also, a temporary drop towards 1,850 could bring a new long opportunity from the lows. The material has been provided by InstaForex Company - www.instaforex.com |
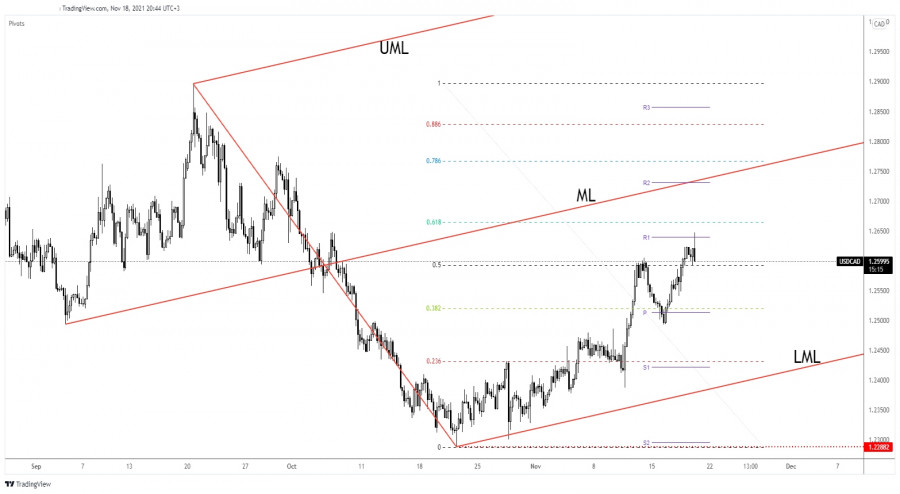
| Posted: 18 Nov 2021 10:56 AM PST The USD/CAD pair was trading in the red at 1.2597 at the time of writing. DXY's sell-off forced USD to depreciate versus all its rivals and not only against CAD. It remains to see what will really happen as the bias is bullish in the short term. Fundamentally, USD was punished by the US Unemployment Claims indicator which was reported at 268K above 260K expected. On the other hand, the Canadian ADP Non-Farm Employment Change was reported at 65.8K versus 41.0K in the previous reporting period. Technically, after its amazing rally, the Dollar Index was somehow expected to retreat. The DXY is in a corrective phase, so USD's depreciation is natural. USD/CAD upside could be over
USD/CAD is about to register a false breakout with great separation through the weekly R1 (1.2639). It's valid breakout above the 50% retracement level signaled potential upside continuation. As long as it stays above the 50% (1.2592) retracement level, USD/CAD could still extend its growth. In the short term, minor accumulation, consolidation above this level could bring new long opportunities and could validate more gains ahead. USD/CAD outlookStaying above the 50% retracement level could still indicate potential further growth. A minor consolidation here could bring new long opportunities. The Ascending Pitchfork's median line (ML) stands as a major upside target and obstacle. On the other hand, dropping and stabilizing below the 50% retracement level could indicate a potential drop towards the 38.2% retracement level and down to the weekly pivot point of 1.2599. The material has been provided by InstaForex Company - www.instaforex.com |
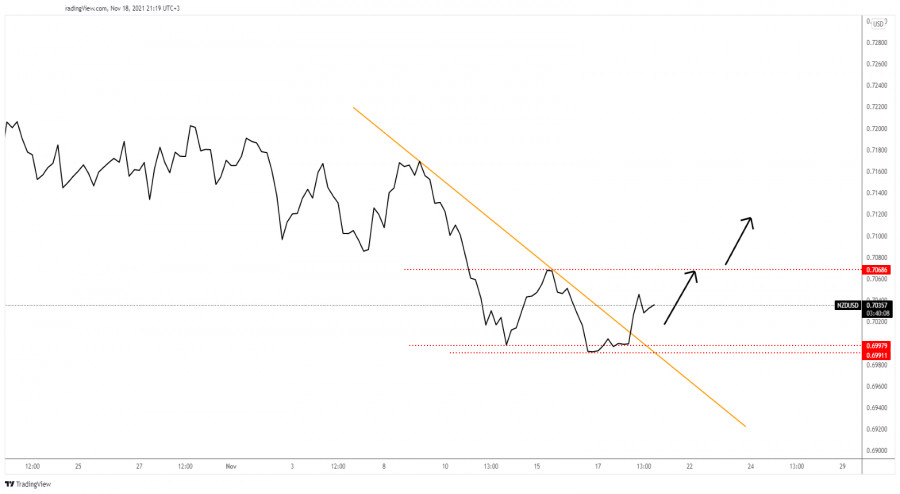
| Posted: 18 Nov 2021 10:55 AM PST
NZD/USD trendline breakoutThe NZD/USD pair jumped above the immediate downtrend line signaling that the downside movement could be over and that the buyers could push it higher. The 0.6997 - 0.6991 zone stands as a downside obstacle. The price has found demand around these levels, so as long as it stays above these support levels, NZD/USD could try to develop a new upward movement. In the short term, NZD/USD is likely to be moving sideways beween 0.6991 and 0.7068 levels. A larger upward movement could be confirmed by a breakout above 0.7068 level, a former high. NZD/USD trading conclusionAs long as NZD/USD is trapped between 0.7068 and 0.6991 levels, we don't have a good trading opportunity as the currency pair could move sideways. Jumping and staying above 0.7068 could announce an upside continuation and could bring new buying opportunities. The material has been provided by InstaForex Company - www.instaforex.com |
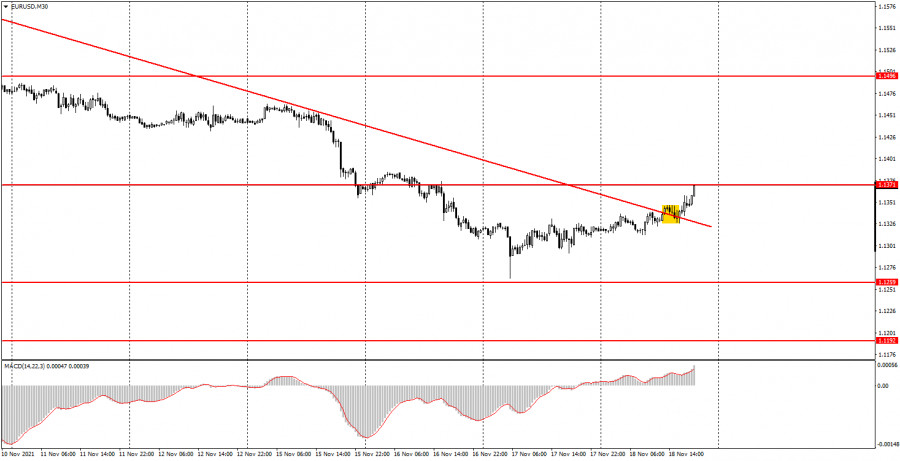
| Posted: 18 Nov 2021 10:06 AM PST Analyzing Thursday trades EUR/USD on M30 chart
The EUR/USD currency pair was going through a correction for most of the day on Thursday. Later in the day, the correction turned into a fully developed uptrend as the pair had crossed the trend line. Although there is no guarantee that the upward movement will continue, the chances for a steady uptrend for the euro have greatly increased. For this, the price needs to overcome the level of 1.1371 which has been hit recently. However, the interesting part for today ends here. On Thursday, neither the EU nor the US has published any important macroeconomic data. The report on jobless claims in the United States has not been considered so important lately. Anyway, the actual reading met the forecasts. Therefore, this report could not have caused any strong reaction from the market even in theory. In the coming days, the euro will try to affirm its confidence and move as high as possible. By the way, breaking through the trendline could be regarded as a buy signal. After the formation of this signal, the pair went up by 30 pips, which was enough for the Take Profit to trigger. EUR/USD on M5 chart
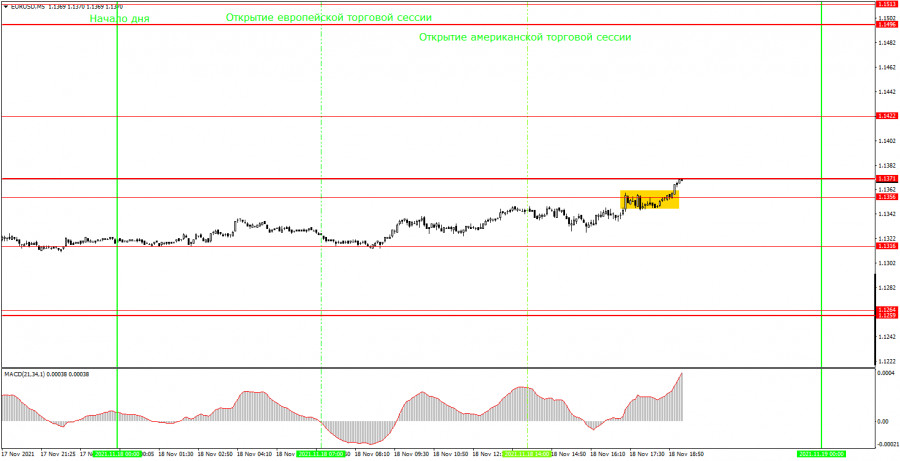
On a 5-minute time frame, the technical picture looks rather boring. Not a single trading signal was generated during the day. The level of 1.1316, which was tested at the beginning of the European session, was the daily low and it was formed later. At the same time, the signal to overcome the level of 1.1356 was formed too late to be followed. Just above this level, the mark of 1.1371 is located, so both of these levels should be considered as an area of resistance. The pair broke through this area even later, so you shouldn't have opened long positons on this signal. Interestingly, the pair eventually showed some upward movement today, but we couldn't make use of it. In general, the whole weekly session turns out to be rather sluggish. The number of trading signals and open trades is minimal. Trading tips on Friday On the 30-minute time frame, the downtrend has reversed. So, buying the euro is more preferable now, especially if the price overcomes the level of 1.1371. However, we would like to remind novice traders that the fundamental background is quite mixed at the moment, while the macroeconomic background is absent. On the 5-minute time frame, the key levels for November 19 are found at 1.1259 - 1.1264, 1.1356, 1.1371, and 1.1422. The Take Profit should be set at a distance of 30-40 points. The Stop Loss should be placed to a breakeven point as soon as the price passes 15 pips in the right direction. On the M5 chart, the nearest level could serve as a target unless it is located too close or too far away. If it is, then you should act according to the situation or trade with a Take Profit. On Friday, there will be nothing to pay attention to. In the EU, markets will focus on the speech by ECB President Christine Lagarde. However, this week, she has already made four statements, according to the calendar. And every time, there was nothing new in her rhetoric. Accordingly, it may remain the same tomorrow: the rates will not be raised next year, and the European economy is still too weak. Basic rules of trading 1) The signal strength is determined by the time the signal took to form (a bounce or a breakout of the level). The quicker it is formed, the stronger the signal is. 2) If two or more positions were opened near a certain level based on false signals (which did not trigger a Take Profit or test the nearest target level), then all subsequent signals at this level should be ignored. 3) When trading flat, a pair can form multiple false signals or not form them at all. In any case, it is better to stop trading at the first sign of a flat movement. 4) Trades should be opened in the period between the start of the European session and the middle of the US trading hours when all positions must be closed manually. 5) You can trade using signals from the MACD indicator on the 30-minute time frame only given that volatility is strong and there is a clear trend that should be confirmed by a trend line or a trend channel. 6) If two levels are located too close to each other (from 5 to 15 pips), they should be considered support and resistance levels. On the chart Support and Resistance Levels are the levels that serve as targets when buying or selling the pair. You can place Take Profit near these levels. Red lines are channels or trend lines that display the current trend and show in which direction it is better to trade now. The MACD indicator (14, 22, and 3) consists of a histogram and a signal line. When they cross, this is a signal to enter the market. It is recommended to use this indicator in combination with trend patterns (channels and trend lines). Important announcements and economic reports that you can always find on the economic calendar can seriously influence the trajectory of a currency pair. Therefore, at the time of their release, we recommend trading as carefully as possible or exiting the market in order to avoid sharp price fluctuations. Beginners on Forex should remember that not every single trade has to be profitable. The development of a clear strategy and money management is the key to success in trading over a long period of time. The material has been provided by InstaForex Company - www.instaforex.com |
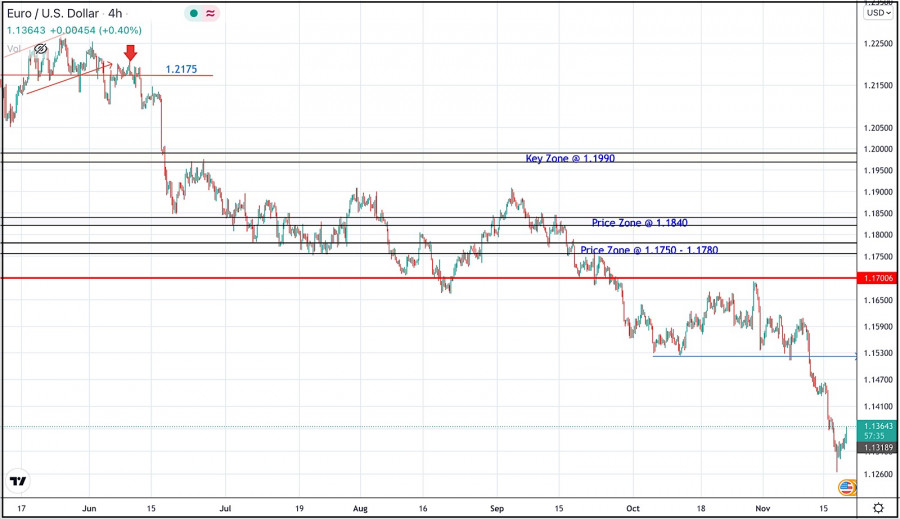
| Analysis of EUR/USD for November 18; Dollar to advance towards 1.1150 Posted: 18 Nov 2021 10:04 AM PST |
| November 18, 2021 : EUR/USD daily technical review and trading opportunities. Posted: 18 Nov 2021 09:21 AM PST
Recently, Persistence below the depicted price zone of 1.1990 indicated further downside movement towards 1.1840 and 1.1780 where a sideway consolidation range was established. During last week, the EURUSD pair has been trapped within a narrow consolidation range between the price levels of 1.1780 and 1.1840. A bullish breakout was executed above 1.1840 shortly after. Temporary Upside pullback was expected towards 1.1990. However, re-closure below the price level of 1.1840 has initiated another downside movement towards 1.1780 which failed to hold prices for a short period of time before significant upside movement was presented into market. Intraday traders were advised to wait for candlestick closure above 1.1780 - 1.1840 for another ascending swing to be initiated. However, immediate downside selling pressure brought the pair down below 1.1700. More downside movement took place towards the price level of 1.1600 where temporary bullish rejection has been maintained for some time. Shortly after, Market price slided below 1.1700 and 1.1600. This has enhanced further decline towards 1.1500. Currently, the price zone around 1.1500 stands as a prominent supply-zone to be watched for SELLING pressure and a possible SELL Entry upon any upcoming ascending movement. Moreover, it is not advised to add new SELL Entries as the pair already looks oversold. The material has been provided by InstaForex Company - www.instaforex.com |
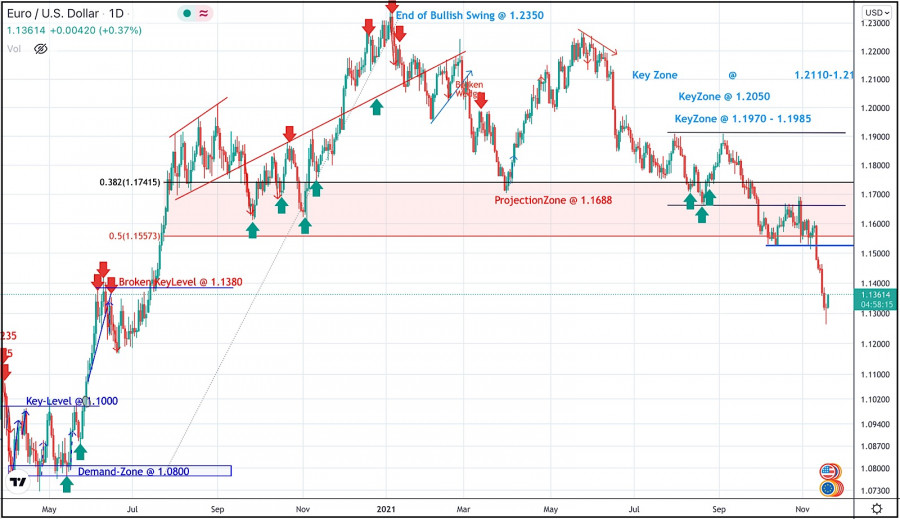
| November 18, 2021 : EUR/USD Intraday technical analysis and trading plan. Posted: 18 Nov 2021 09:20 AM PST
The bullish swing that originated around 1.1650 in August, failed to push higher than the price level of 1.1900. That's why, another bearish pullback towards 1.1650 was executed. Bullish signs were expected around the price levels of 1.1650-1.1700 for sometime as it corresponded to a recent previous bottom. However, extensive bearish decline has pushed the EURUSD pair towards 1.1600 and lower levels was reached. Shortly after, significant bullish recovery has originated upon testing the price level of 1.1570. The recent bullish pullback towards 1.1650-1.1680 was expected to offer bearish rejection and a valid SELL Entry. Significant bearish decline brought the EURUSD pair again towards 1.1550 levels which stood as an Intraday Support zone. Hence, sideway movement was demonstrated until bearish decline occurred towards 1.1325. Please note that any Bullish movement above 1.1500 should be considered as an early exit signal to offset any SELL trades. The price levels around 1.1520 remain a reference zone that needs to be re-visited when the current bearish momentum ceases to exist. The material has been provided by InstaForex Company - www.instaforex.com |
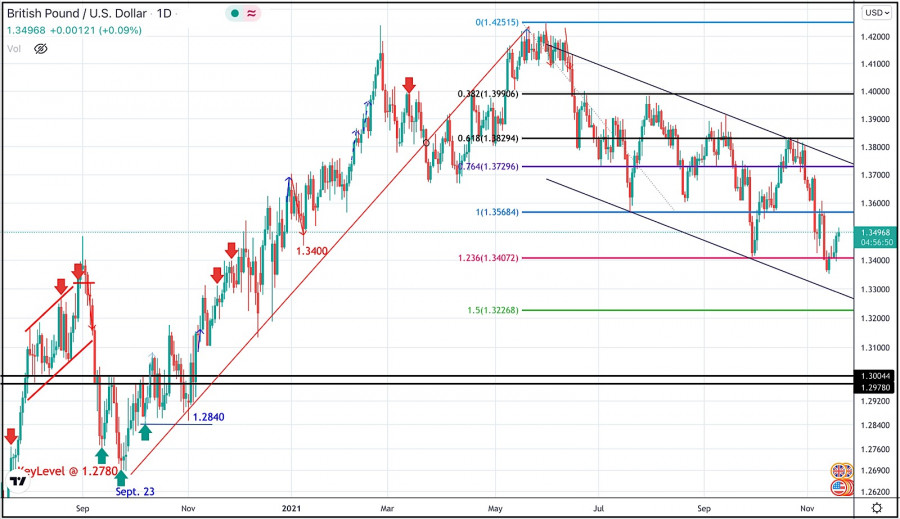
| November 18, 2021 : GBP/USD Intraday technical analysis and significant key-levels. Posted: 18 Nov 2021 09:19 AM PST
The GBPUSD pair has been moving sideways with some bearish tendency while bearish breakout below 1.3600 was needed to enhance further bearish decline. On the other hand, the nearest SUPPLY level was located around 1.4000 where bearish rejection and a valid SELL Entry was anticipated. Bearish breakout below 1.3680 enabled further bearish decline towards 1.3400 which corresponded to 123% Fibonacci Level of the most recent bearish movement. This was a good entry level for a corrective bullish pullback towards 1.3650 and 1.3720 which was temporarily bypassed. Shortly after, the pair was testing the resistance zone around 1.3830 where bearish pressure originiated into the market. Currently, the short-term outlook is bearish as long as the pair maintains its movement below 1.3730 and 1.3570. Another bearish visit was expected towards 1.3400 where significant bullish rejection was expressed as it corresponded to significant Fibonacci Expansion Level. Any bearish decline below it will probably enable more bearish extension towards 1.3250. On the other hand, the price level of 1.3570 stands as an intraday resistance level to be watched either for bearish reversal or a continuation pattern upon any upcoming visit. The material has been provided by InstaForex Company - www.instaforex.com |
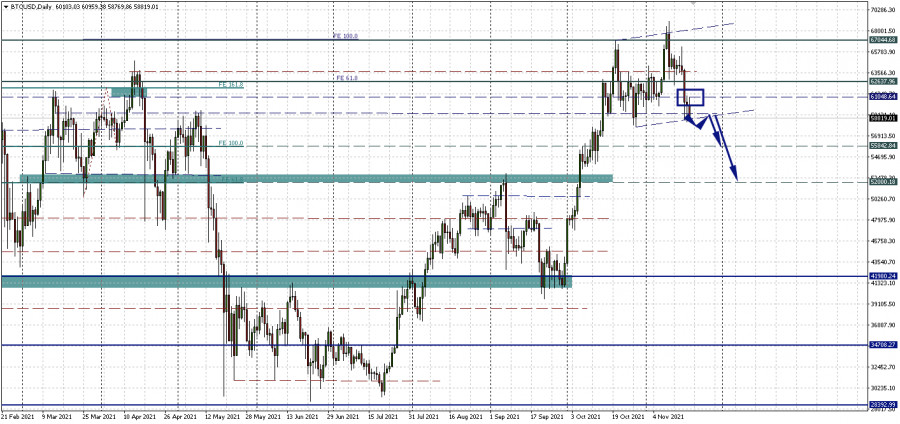
| Bitcoin: what does its correlation with the Nasdaq show? Posted: 18 Nov 2021 08:40 AM PST The technical picture on the Bitcoin chart is starting to cause concern. The support line of the hypothetical upward channel has not been broken yet. But remember that this channel is just an outline, not a technical constant. But the fact that the price is hitting the mirrored resistance level of 61,048.64 in the process of an alleged rebound in a trend is starting to cause concern. Well, 60,000 - 61,000 is a key support zone, and, as previously assumed, breaking through it, Bitcoin could fall to $55,000, or even $52,000 per coin. What does Bitcoin's correlation with the stock market tell us?According to a recent Bloomberg report, Bitcoin's correlation with the Nasdaq 100 during the pandemic has dropped to almost zero in recent days. The correlation peaked in September 2021. Back then, tech stocks and Bitcoin traded almost in parallel. The correlation between the two has always remained positive since February 2020. However, the situation has changed in recent months. The Nasdaq is up 11% since late September 2021. On the other hand, Bitcoin added 40%. This divergence occurs at a time when the main cryptocurrency is considered a tool for hedging inflation. The recent rally in Bitcoin prices, during which it approached the $70,000 mark, was associated with growing price pressures in the global economy. Is Bitcoin really a full-fledged protection against inflation?It is difficult to give an unambiguous answer to this question. While many market participants and experts claim Bitcoin is a hedge asset, its recent volatility is once again in doubt. Already, the depth of the correction from the all-time high is 10%, which is starting to cause concern. In an interview with Bloomberg, Carsten Menke, head of next generation research at Bank Julius Baer in Zurich, expressed his opinion on the matter: "The lack of consistent and negative correlation between bitcoin and stocks clearly suggests that it is not yet a safe haven." This is evidenced by the fact that during periods of turmoil in the financial markets, Bitcoin, like other riskier assets, tends to suffer. But do not assume that everything is lost. Not everyone believes that this fact speaks of the unsuitability of BTC as a hedge instrument. Esme Pau, an analyst at China Tonghai Securities in Hong Kong, takes the opposite view. Pau calls Bitcoin a "smart" way to hedge inflation. "I urge investors to focus on the long-term trend and do not think short-term changes in correlation should be considered representative," she stressed. So what will happen to Bitcoin?A local correction in Bitcoin does not mean a change in the bullish trend. Therefore, in the long term, it is likely to continue to grow. As noted earlier, the main cryptocurrency has about six months more for this. As for the near future, it is worth focusing on the technical picture. The only question is how much the correction will deepen.
|
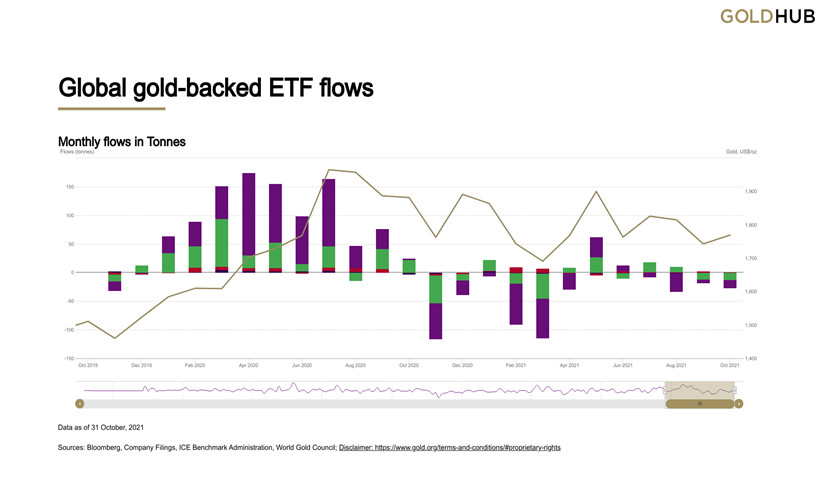
| Posted: 18 Nov 2021 08:18 AM PST The precious metals market is constantly under my scrutiny, and today I have good news for you! It is very likely that, after a year and a half hiatus and a period of decline for precious metals, the good days are finally here. Moreover, I have good reasons for such statements, which I will introduce you to today, focusing on the gold market as the main element of the precious metals market. First, let's talk about the fundamental background of what is happening. The price of gold is influenced by a number of factors, including but not limited to investment demand, demand from the jewelry industry, demand from the electronics sector, and price momentum. At the same time, in any of these sectors, the influence of US investors will be overwhelming. The only segment where Asian investors can compete with Americans is demand from the jewelry industry, but even there, the influence of American consumers will be quite tangible. That is why, despite some oversimplification, I pay increased attention to data from the United States as the key data influencing the price of gold and other precious metals. Back in late October and early November, the future of the precious metals market seemed rather hazy. Investors were selling their shares in exchange-traded funds (Figure 1), and demand for gold futures was at its lowest levels since 2016. However, the situation changed with overcoming the level of $1,830 per troy ounce.
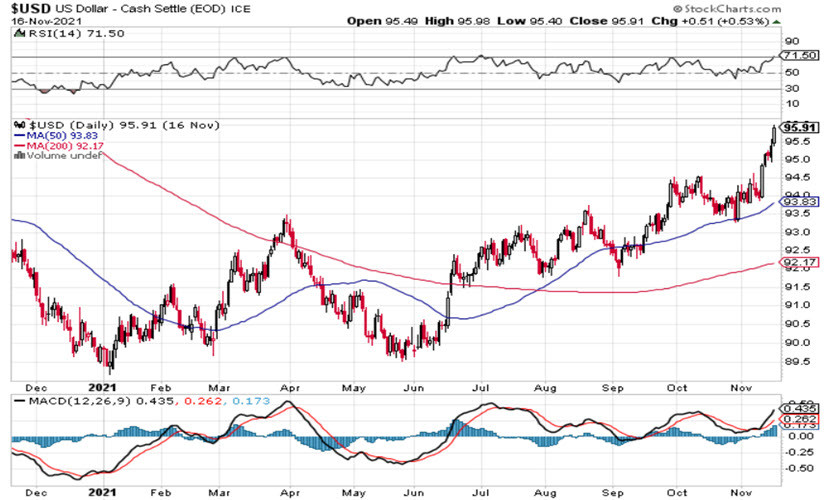
Figure 1: Investors buying and selling Gold ETFs The formal reason for the growth of gold and overcoming the mark of $1,830 was the data on inflation in the United States, which showed a multi-year record. At the same time, there was an increase in precious metals against the background of a simultaneous rise in the dollar, an increase in the yields of government treasury bonds, and a fall in the rate of the European currency. This came as a complete surprise to many investors, who believed that the rise in bond yields was negative for gold, as well as the rise in the dollar, but gold once again showed its temper, getting rid of both the dollar and American debts. Let's see why this happened. Despite the fact that gold is denominated in dollars, it wins the dollar over the long run and wins by a wide margin. In 1973, gold averaged about $90 an ounce. Now the price of gold is over $1,800. If gold depended only on the dollar, then its value now would not exceed 4% of the value of the 1973 dollar, which follows from the dynamics of the US dollar against a basket of foreign currencies (Fig. 2).
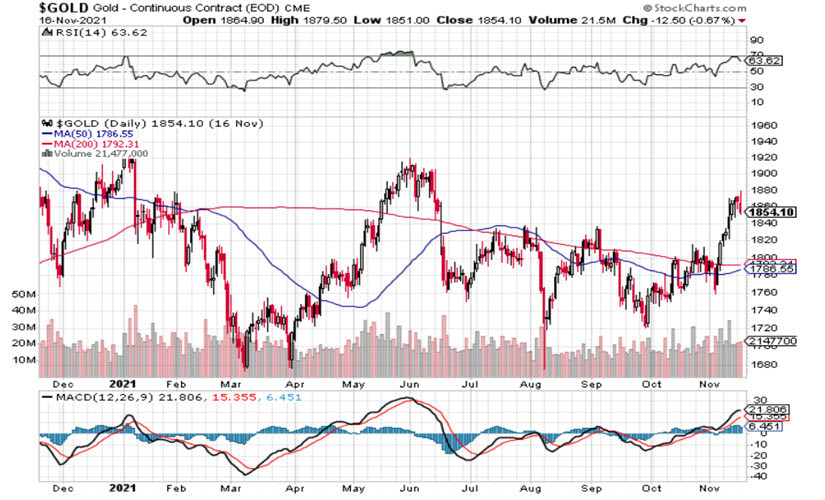
Figure 2: US Dollar Index Against a Basket of Foreign Currencies The value of the dollar index at the level of 95.91 is the value of the dollar, expressed as a percentage of a basket of foreign currencies. However, gold, as we know, has grown more than 20 times. So long-range peg of gold to the dollar is inherently flawed. Gold is an investment asset, and its value outpaces the dollar in the long run, despite the fact that for some periods of time, sometimes quite long, the dollar tries to take revenge on gold. The same can be said about other currencies - gold overtakes fiat money, and it is pointless to argue with this. The relationship between gold and Treasury bond yields can also only be considered for short periods of time. However, the link between gold and inflation is, in my opinion, much more obvious. In an environment of low-interest rates and high inflation, Americans increasingly prefer gold as an investment. No wonder, along with the news that investors were withdrawing from American ETFs by selling "paper gold," the news came that they were actively buying gold investment coins. As you probably already know, last week, after the inflation data was released, gold surged rapidly and overcame the key resistance at 1,830, which opens up prospects for it with a first target at the level of August 2020 and subsequent growth by at least another 10%, that can happen in the future from one to six months. This follows from the technical picture and its parameters (Fig. 3). For the sake of fairness, it should be noted that gold limits the level of 1,900 from above, however, it can be assumed that this level will soon fall, and here's why:
Fig. 3: Technical picture of gold In trading and investing, there is a concept of true and false breakouts. There is no exception to the rule, but in general, an increase in trade volumes and an increase in the so-called Open Interest against the background of overcoming technical resistance indicate a "true" breakout, and vice versa, a price increase against the background of a lack of Open Interest growth often indicates that a breakdown can turn out to be false. Let's compare the data kindly provided to us by the Commitment of Traders (COT) report with the technical picture, given the fact that OI is an indicator of supply and demand. Therefore, the higher the OI, the higher the demand, and vice versa. As follows from this report, in June 2021, the OI indicator of gold futures traded on the COMEX-CME exchange amounted to 752,000 contracts, but against the background of the rise in the price of gold after the price reached the level of $1,870, demand began to decline sharply, and in 6 weeks, fell to the level of 608,000 contracts. At the same time, at the peak of the price, long positions of the main group of MoneyManager buyers amounted to about 167,000 contracts. Now the situation looks completely different, the OI is growing sharply from the lows and over the past 4 weeks, it has grown from the level of 617,000 contracts to the level of 775,000, and MoneyManager has 190,000 contracts in long positions. In fact, if we talk about the supply and demand of the futures market, now it is at the maximum values of 2021, and its growth against the background of the dollar growth and changes in the Federal Reserve policy suggests that that American speculators and investors are seriously considering gold as an asset prone to growth. This suggests that we can count on the resumption of the upward trend in gold, and we should not consider the possibility of a trend reversal from the level of $1,900 per troy ounce without good reason. In conclusion, I would like to say a few words about other precious metals - platinum and silver. From a technical point of view, there are also prerequisites for the recovery of the upward trend, however, there is no reason to say that Open Interest has grown significantly in the futures market. This does not mean that these metals will not grow with gold, by no means, gold will raise the price for them like a locomotive. However, the lack of demand for silver and platinum, in my opinion, means that in general the markets are not yet convinced that gold can continue to rise. Therefore, in any case, no matter how events develop, we should follow the rules of money management and consider the possibility that the negative scenario of the event is much closer than we might think. The material has been provided by InstaForex Company - www.instaforex.com |
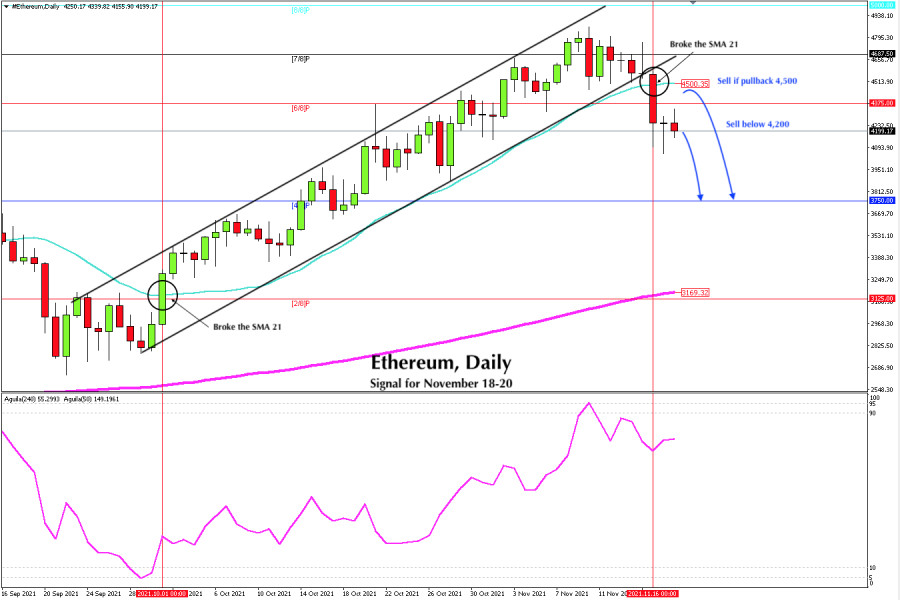
| Trading signal for ETH/USD on November 18 - 20, 2021: sell below $4,200 (6/8) Posted: 18 Nov 2021 07:40 AM PST Ethereum (ETH) broke sharply the uptrend channel formed since October 9. Right now, the crypto is trading below the 200 EMA (4,500) and a decline is likely to happen in the next few hours towards the level of 3,750. As Ethereum is below the 21 SMA located at 4,500, it indicates the possibility that it will continue its fall. Ethereum is expected to continue its correction movement in the next few hours towards 4/8 of murray at 3,750.
On October 10, Ether managed to break and consolidate above the 21 SMA. It was trading above this moving average until November 16, when it broke below and now expectations are negative. As long as ETH trades below the 21 SMA and below the 6/8 murray, there is a possibility that it will continue to fall and could reach the 200 EMA located at 3,169 in the medium term. The eagle indicator touched the 95-point zone on November 7 that is an extremely overbought mark. Ether is likely to continue trading below the high of 4,863 and could continue the correction in the next few days. Our trading plan for the next few hours is to sell between the two levels below the 21 SMA (4,500) and below 6/8 of murray, with targets at the psychological level of 4,000 and up to the level of 3,750 which represents a key support. Support and Resistance Levels for November 18 - 20, 2021 Resistance (3) 4,437 Resistance (2) 4,344 Resistance (1) 4,234 ---------------------------- Support (1) 4,062 Support (2) 3,962 Support (3) 3,869 *********************************************************** A trading tip for ETH for November 18 - 20, 2021 Sell below 4,200 or if pullback to 4,500 (SMA 21) with take profit at 4,062 and 3,750 (4/8) and stop loss above 4,320 and 4,610. The material has been provided by InstaForex Company - www.instaforex.com |
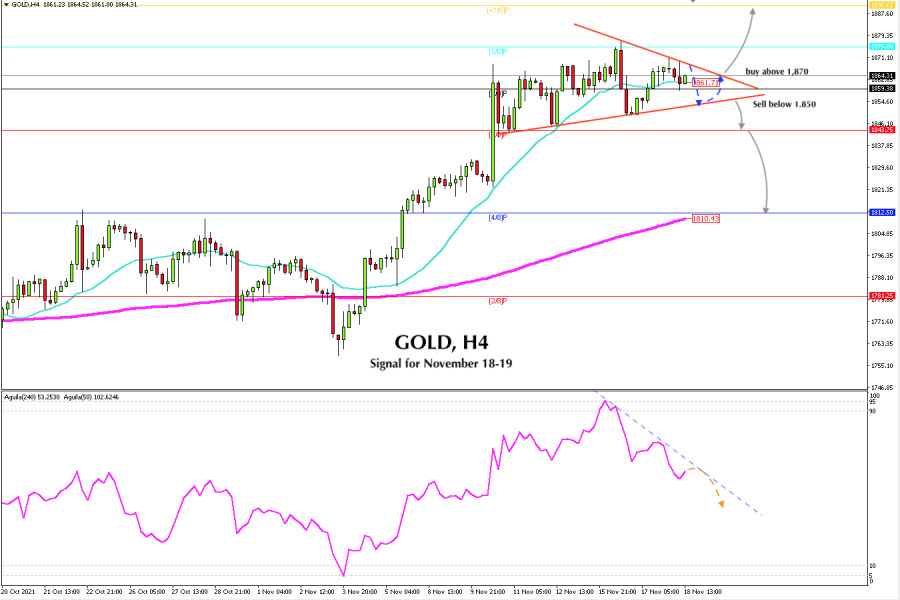
| Posted: 18 Nov 2021 06:56 AM PST At the beginning of the American session, gold is trading at 1,864, just below the symmetrical triangle and above SMA of 21 located at 1,861. A correction is expected in the next few hours towards the support of 6/8 of murray located at 1,843. Gold is trading within a symmetrical triangle. It is expected to trade within this technical pattern in the coming days. The range zone is getting tighter. Now its upper and lower borders are seen between 1,867 and 1,853.
As long as gold remains below SMA 21 (1,861), there is a possibility of a correction towards the zone of 7/8 murray. The eagle indicator is showing a bearish signal and could confirm our technical correction outlook for the next few hours. A consolidation and a break below the symmetrical triangle could be the start of a new bearish movement and we could expect a decline until 1,843. If bearish pressure persists, the yellow metal could reach 1,810,43 around the 200 EMA. Our trading plan for the next few hours is to sell below 1,870 and buy around 1,853. A sharp break above or below the symmetric triangle pattern could determine the gold trend for the next few days. For this, we should wait for a confirmation with the daily close below 1,850 or above 1,870. According to the 4-hour chart, the main trend is bullish. A correction to 6/8 murray can encourage a further bullish momentum. On the other hand, if the metal falls to the 200 EMA, it could be seen as an opportunity to buy in the short term. If in the next few hours we see that gold is breaking the 21-day moving average and consolidates below 1,860, it will be a clear signal for us to sell with targets at 1,843. So, the price could reach 1,812 in the next few days. Support and Resistance Levels for November 18 - 19, 2021 Resistance (3) 1,884 Resistance (2) 1,879 Resistance (1) 1,873 ---------------------------- Support (1) 1,855 Support (2) 1,845 Support (3) 1,836 *********************************************************** A trading tip for GOLD for November 18 - 19, 2021 Sell below 1,850 (symmetrical triangle) with take profit at 1,843 (7/8) and 1,810 (EMA 200) stop loss above 1,857. The material has been provided by InstaForex Company - www.instaforex.com |
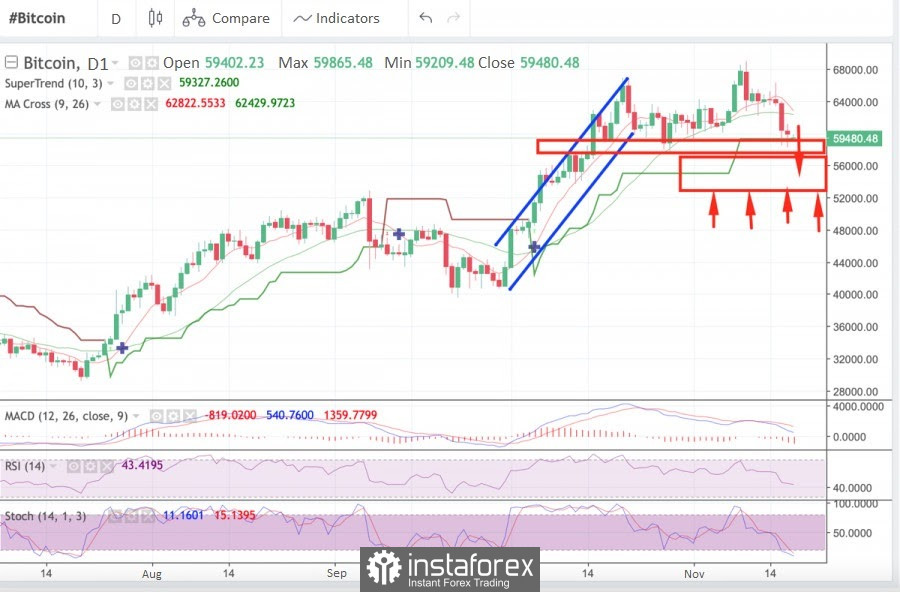
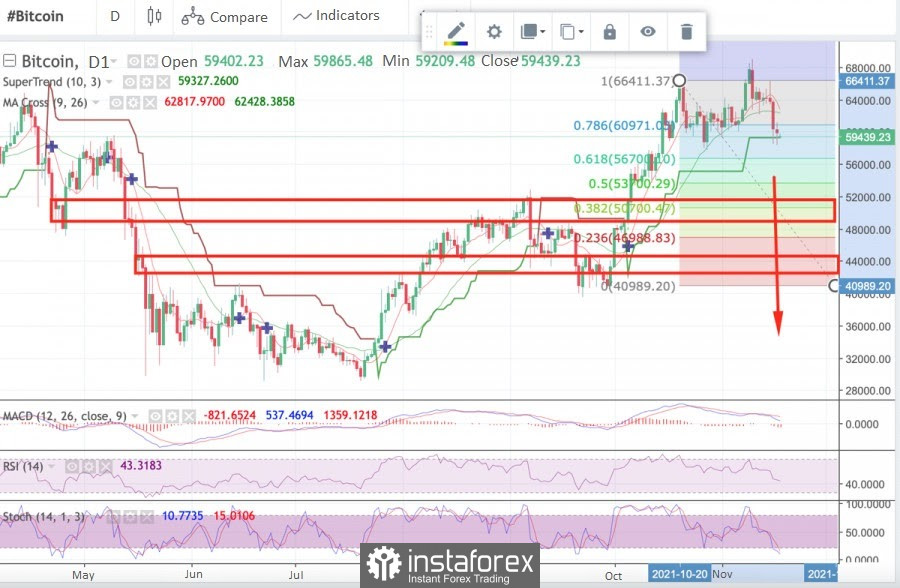
| Posted: 18 Nov 2021 06:46 AM PST Bitcoin has been in a correction for the last week, not so much because of negative news, but because of the panic reaction of speculative traders. The coin will continue to be within the upward trend, but there is a possibility of aggravation of the current correction. A further decline in the price does not cancel out the fundamental bullish mood of the market for the subsequent growth of BTC quotes, however, theoretically, the deepening of the correction may contribute to a significant postponement of a new stage of growth and even a full-fledged trend reversal. As of 11:00 UTC, Bitcoin is trading in the $60k region and is showing more and more signals for further price declines. The market has formed a powerful support zone and has already bought out the price three times when reaching $58.6k. However, right now, the quotes are starting to decline again, which indicates another line retest. The more often the price tests a certain zone, the more likely it is to break out on the next entry. And within the current local bearish movement, there is every reason to believe that BTC will continue to decline and enter the fluctuation range of $53k- $57.6k, which is a significant worsening of the correction, not without the help of bears. The main fundamental factor behind this decline is the excessive volatility of Bitcoin at the current growth stage. According to the historical context, November has always been a highly volatile month for BTC, and given the rise in inflation and the increased correlation with the US dollar, the cryptocurrency received an additional incentive for sharp price surges. In addition, the local euphoria in the market provoked an influx of short-term investors who want to play on the rise in prices. This category of investors acquired the coin at the $60k level, which makes it psychologically unstable in the opposite upward price movement. Local negativity due to tightening control over cryptocurrencies proved that the market is prone to inadequate reactions, which provoked a sell-off. It is worth noting the interests of large capital, which are playing down not the first bullish rally. The main strategy of large capital is to "shake up" the retail audience, which, when the price drops, begins to get rid of coins, and further absorb them. A similar pattern is observed with the current price drop when one of their largest BTC holders purchased 200 coins during a local sale. On the one hand, this is the manipulative behavior of the dominant category of investors, but, on the other hand, this is a significant improvement in the cryptocurrency market, thanks to which the further upward movement will be more systematic and calm. Bitcoin's technical picture also signals a breakdown of the support zone at $58.6k and a further decline to the $53k-$57.6k area. The MACD is approaching zero, which is a bearish sign and a lack of strength of the upward momentum. The Stochastic Oscillator left the bullish zone, breaking through the 40 mark, which indicates the prevalence of selling over buying. The relative strength index is declining less actively but is also approaching a decline over 40, which indicates a lack of strength in the long-term upward trend. In the event of a breakdown of $58.6k, buyers will try to redeem the offered volumes, which will slow down the price drop, and for some time we can expect fluctuations in the $56.2k-$56.5k region. Subsequently, the price will break through the local support corridor and start moving along the main range of $53k-$56k. A fall in the price into this area does not cancel the long-term upward impulse, but if the news background aggravates and the holders are not confident, a local reversal of the medium-term trend can be expected, which could accelerate the decline to $53k and significantly increase selling pressure. In this case, the likelihood of a full-fledged bearish breakdown of $53k rises significantly and casts doubt on the long-term upward trend.
With a decline below $53k, we should expect a drop in the range of $47.8k-$50k, which coincides with the Fibo level of 0.382. At the breakdown of this mark, a full-fledged bull market is canceled, and the price goes into the stage of consolidation of a protracted correction. Most likely, the Bitcoin price rebound will occur in the range of $53k-$57k, which fully corresponds to the bullish scenario, and collecting liquidity from this range will allow a much faster start of the recovery period and move on to a full-fledged bullish rally cycle.
|
| Trading signal for EUR/USD on November 18 - 19, 2021: buy above 1.1353 (SMA 21 - 5/8) Posted: 18 Nov 2021 06:16 AM PST Since November 17, the euro has been recovering since it registered a low of 1.1263. It could be seen as an encouraging sign for the bulls. A strong resistance stands at 5/8 murray around 1.1353. The 21 SMA acts as a dynamic resistance and could limit the recovery of EUR / USD. Since November 10, the euro has settled below this moving average and is now under downward pressure. The pinbar Japanese candlestick pattern formed on November 17 means that the euro could rally for the next few days. However, it should break and consolidate above 1.1335, then it could rise to 1.1474.
According to the daily chart, the overall trend is bearish. Trading through the SMA of 21 (1.1335) could support the recovery of the Euro and it may rise to the resistance of 1.1474. This move will only be a technical correction and then resume its downward movement. A sharp break above the SMA of 21 and 5/8 murray could accelerate the upward movement to the 200 EMA located at 1.1549. Conversely, as long as it trades below 1.1353 (21 SMA), the euro may continue to be under downward pressure and could lose momentum and fall to 4/8 murray around 1.1230. The US Dollar Index (#USDX) is trading around 95.70. This is an extremely overbought level. We expect that in the next few days, there will be a correction of the dollar which would enable EUR/USD to gain ground. Our forecast in the next few hours for the euro is consolidation above 1.1353. As long as EUR/USD is trading above this zone, we will have an opportunity to buy with the target at 1.1474. If 6/8 is broken, we could buy with targets at 1.1552 (200 EMA). The market sentiment report for today, November 18, shows that there is 72.63% of operators who are buying the EUR/USD pair. This data provided a bullish sign and we could expect a recovery to 1.1474. Then, the price may again resume its downward movement with the target at 1.1104. Support and Resistance Levels for November 18 - 19, 2021 Resistance (3) 1.1410 Resistance (2) 1.1370 Resistance (1) 1.1352 ---------------------------- Support (1) 1.1318 Support (2) 1.1302 Support (3) 1.1274 *********************************************************** A trading tip for EUR/USD for November 18 - 19, 2021 Buy above 1.1353 (SMA 21) with take profit at 1.1474 (6/8) and stop loss below 1.1318. The material has been provided by InstaForex Company - www.instaforex.com |
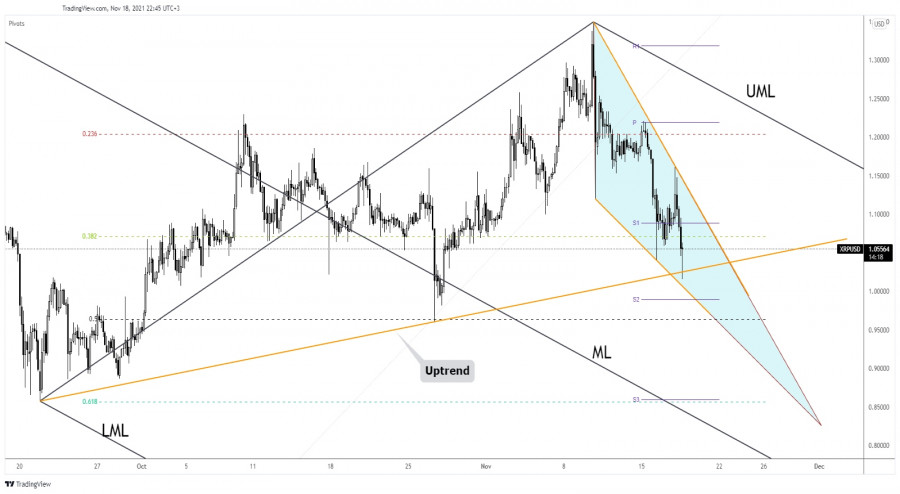
| XRPUSD vulnerable to more downside if price breaks below $1. Posted: 18 Nov 2021 05:56 AM PST XRPUSD is trading around $1.08. Price briefly broke out and above the key resistance trend lines at $1.13 and $1.24, but we are now again below them. Price is now challenging important Fibonacci support and channel levels.
Blue rectangle -major support Black lines -Fibonacci retracement XRPUSD is challenging the 61.8% Fibonacci retracement and the lower channel support at $1.03-$1.05. Breaking below this support area will put pressure on price and most probably will bring it closer to the major support area (blue rectangle). As long as price is above the blue rectangle area, bulls have hopes of another bull run coming. So far price is making higher highs and higher lows. Ideally price will not break below $1.03. The material has been provided by InstaForex Company - www.instaforex.com |


| You are subscribed to email updates from Forex analysis review. To stop receiving these emails, you may unsubscribe now. | Email delivery powered by Google |
| Google, 1600 Amphitheatre Parkway, Mountain View, CA 94043, United States | |


Comments