Forex analysis review
Forex analysis review |
- USD/JPY retesting buyers
- NZD/USD develops a reversal pattern
- EUR/USD. Fed's hawk wing strengthens; COVID problems in Europe
- November 19, 2021 : EUR/USD daily technical review and trading opportunities.
- November 19, 2021 : EUR/USD Intraday technical analysis and trading plan.
- November 19, 2021 : GBP/USD Intraday technical analysis and significant key-levels.
- Bitcoin: when and how crypto industry will begin to regulate
- EUR/USD: the sooner Fed starts to raise rates, the deeper the collapse
- BTC analysis for November 19,.2021 - Bullish intraday trend
- Blockchain is ready for implementation in banking and financial markets
- Ethereum respects the 38% Fibonacci retracement level.
- Gold trapped inside short-term trading range.
- EURUSD approaching end of the decline.
- Analysis of Gold for November 19,.2021 - Breakout might be in the play
- Weekly reversal candle in USDJPY.
- Trading signal for Ripple (XRP) on November 19 - 22, 2021: sell in case of pullback from 1,0804 (SMA 21)
- EUR/USD analysis for November 19, 2021 - Upside rotation in the play
- Video market update for November 19,2021
- Trading signal for CRUDE OIL (#CL) on November 19 - 22, 2021: buy above $75,00 (4/8)
- Gold upside pressure intensifies
- USD/CAD upside paused due to better-than-expected Canadian retail sales
- Trading signal for USD/JPY on November 19 - 22, 2021: buy above 113.52 (uptrend channel)
- US labour market recovers and economy picks up
- Forecast for EUR/USD on November 19 (COT report). Austria goes into quarantine
- Forecast for GBP/USD on November 19 (COT report). British retail sales turned out to be quite good, but did not save the
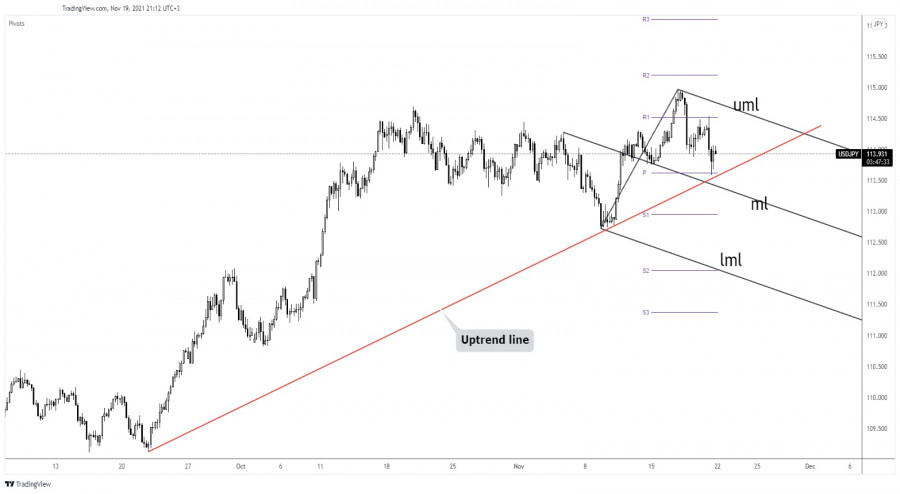
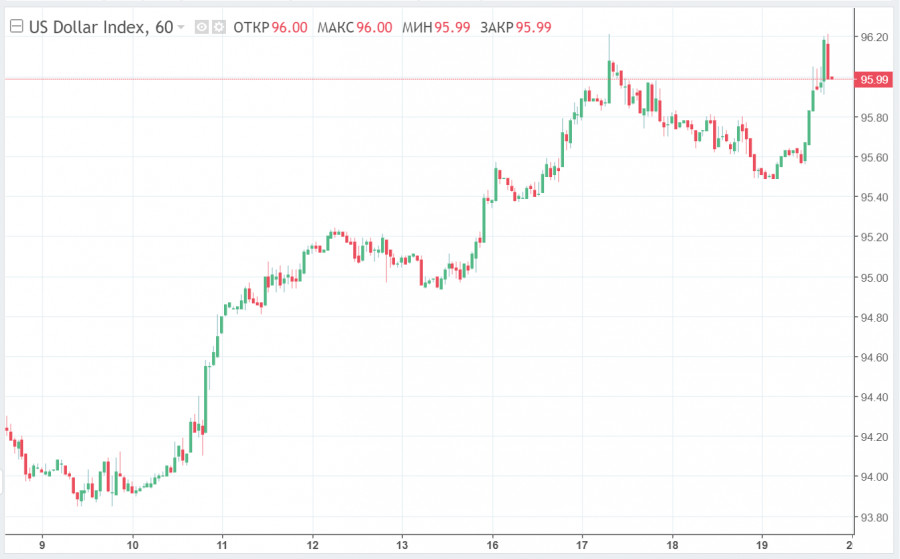
| Posted: 19 Nov 2021 12:02 PM PST The USD/JPY pair retreated in the short term. The yen was strongly bullish today as the yen futures rallied. The price dropped despite the Dollar Index increasing as high as 96.23 level far above 95.51 today's low. In the last hours, the DXY retreated from today's high, so that USD was punished by this retreat. Fundamentally, the Japanese Nation Core CPI registered a 0.1% growth matching expectations. On the other hand, Canada's retail sales data had a big impact on the Dollar Index. From the technical point of view, USD/JPY maintains a bullish bias as the price stands above an uptrend line. USD/JPY still in buyers' territory
After its failure to stabilize above 114.69 or reach 115.00 psychological level, USD/JPY signaled an overbought situation. As long as it stays above the uptrend line and above the weekly pivot 113.62, the pair could still resume its uptrend. A strong bullish pattern here could bring new long opportunities. Only a valid breakdown below the uptrend line could invalidate an upside continuation and could bring new short opportunities. USD/JPY forecastTesting and retesting the uptrend line, registering only false breakdown through this obstacle could signal that USD/JPY could start increasing again. In the short term, the pair moves somehow sideways, so we don't have a great trading opportunity. As long as the price stays above the uptrend line, we can't talk about a downside movement. Only a valid breakdown through this dynamic resistance may open the door for a larger drop. The material has been provided by InstaForex Company - www.instaforex.com |
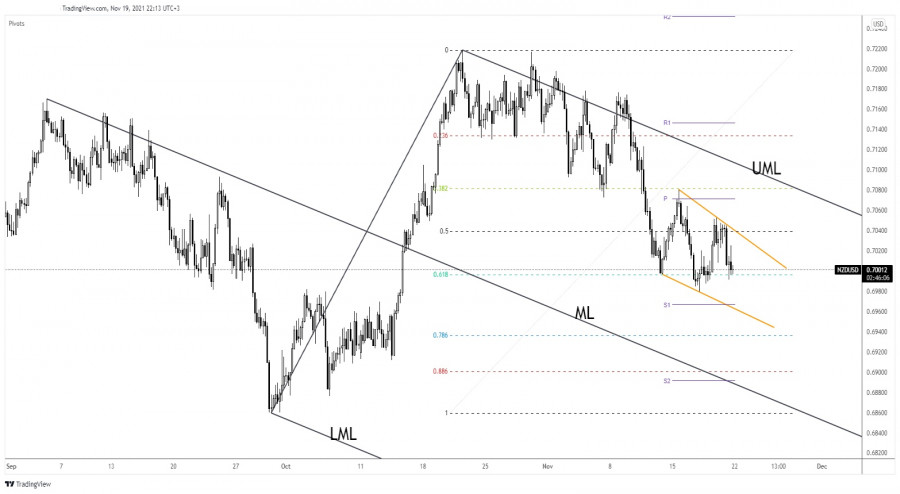
| NZD/USD develops a reversal pattern Posted: 19 Nov 2021 12:00 PM PST The NZD/USD pair dropped today as the Dollar Index rallied. Now, the pair is traded at 0.7001 right above 0.7 psychological level. The bias remains bearish even if the price seems undecided. After the US Unemployment Claims indicator was reported worse than expected in yesterday's session, NZD/USD tried to grow, but it failed to take out the immediate resistance levels. Today, New Zealand Credit Card Spending was reported at -5.6% versus -12.8% in the previous reporting period. NZD/USD is trading in the red and it could extend its sell-off as traders are expecting the US Federal Reserve to hike rates in its upcoming meeting after higher inflation reported by the United States. NZD/USD retesting the buyers
Technically, NZD/USD tested and retested the 50% retracement level, and now it is challenging the 61.8% retracement level. The price action could develop the Falling Wedge pattern, but this formation is far from being confirmed. Dropping and stabilizing below the 61.8% (0.6996) retracement level could signal a potential further drop. The pattern's downside line stands as a major target. The former low of 0.6979 is seen as a support level as well. NZD/USD predictionThe pressure remains high as long as the pair stays under the downtrend line. A larger downside movement could be activated by a new lower low, by a bearish closure below 0.6979. An upside reversal could be signaled by a valid breakout above the downtrend line. The material has been provided by InstaForex Company - www.instaforex.com |
| EUR/USD. Fed's hawk wing strengthens; COVID problems in Europe Posted: 19 Nov 2021 10:17 AM PST At the end of the trading week, the U.S. currency showed its character again. The U.S. dollar index tested the 96th figure (for the first time this year), while the EUR/USD pair updated the annual minimum, marking 1.1250. This is already a 17-month low: the last time the price was in this price area was at the end of June 2020. Buyers of the pair are again on the losing side, although they tried to continue the corrective growth in the first half of Friday – the high of the day was fixed at 1.1373. However, long positions in the current times of "dollar hegemony" are extremely risky: before traders could look back, the pair collapsed by more than 100 points – literally in a few hours. And although the bears immediately rebounded from the 1.1250 mark, the downside prospects for EUR/USD are quite obvious. The conquest of the 12th figure is only a matter of time, against the background of hawkish signals from a number of representatives of the Fed and opposite signals from representatives of the ECB. Therefore, the bulls of the pair can only count on short-term corrective pullbacks, which are caused solely by the weakening of the greenback. The euro did not and does not have its own arguments for a counteroffensive.
It is noteworthy that the EUR/USD pair collapsed on Friday against the background of an almost empty economic calendar. Secondary macroeconomic reports could not provoke such volatility, especially since the pair simultaneously turned 180 degrees. In my opinion, Friday's price dynamics is due to several fundamental reasons. Firstly, the "Friday factor." The corrective growth was of a "forced nature": every point won was given to EUR/USD buyers with great difficulty. In the afternoon of Friday, the upside impulse finally stalled, after which traders began to close longs en masse, without risking leaving them for the weekend. A kind of "domino effect" did its job: sellers seized the initiative and pulled the price to new lows with renewed vigor. The fading of the upside impulse coincided with Christine Lagarde's speech. The head of the ECB took part in the European Banking Congress on Friday, where she once again voiced "dovish" rhetoric. By and large, she did not say anything new, repeating the theses that were voiced within the walls of the European Parliament on Monday. The essence of her speech boiled down to the fact that the hasty tightening of monetary policy parameters "will only increase the negative impact on the eurozone economy." Lagarde reiterated the mantra that the rise in inflation is temporary. Therefore, in her opinion, "there is no point in tightening the policy, given the fact that inflationary expectations should weaken." In other words, the head of the ECB once again expressed confidence that the European regulator has no reason to rush to raise the rate. Similar rhetoric was voiced by the chief economist of the European Central Bank, Philip Lane. In general, the decline observed in EUR/USD is due not only to the strengthening of the dollar but also to the weakening of the euro. Pay attention to the main cross-pairs involving the single currency: they all reflect the rapid devaluation of the euro. This is partly due to the next wave of the coronavirus crisis in Europe. As it became known, Austria is introducing a full lockdown on Monday - at least 20 days. Residents of the country will again have to work "remotely" (where possible), and all shops (except food) will be closed. Schools will be able to attend only those children who, for various reasons, cannot study remotely and need full-time lessons. Austria is the first country in the EU to reintroduce a full lockdown due to the COVID outbreak. Experts now fear that Germany will also follow Austria in reintroducing lockdown. On Friday, the German authorities have introduced quarantine restrictions for unvaccinated people in areas with a high hospitalization rate - 12 of the 16 states of the state. At the same time, the German Minister of Health continues to sound the alarm stressing that the country needs more serious quarantine restrictions to stop the outbreak. This is a rather alarming signal, given the fact that the daily growth rate of patients with coronavirus has reached a new record in Germany. Over the past day, 65,000 new cases were registered: this is 15,000 more cases than was detected the previous day. In general, anti-records have been recorded in the country for the 11th day in a row. Therefore, the risk of introducing a full lockdown, following the example of Austria, is quite high. This fundamental background puts pressure on the euro, and not only in tandem with the dollar. The U.S. currency, in turn, received support from the Fed representatives. Federal Reserve Governor Christopher Waller said that the regulator should speed up the tapering process. He was worried about rising inflation, and also noted that the American labor market is "at a very fast pace" approaching levels of maximum employment. Earlier similar statements were given by other representatives of the Federal Reserve, including James Bullard, John Williams, Raphael Bostick, and Charles Evans. The Fed's hawk wing is strengthening, providing significant support to the dollar.
Thus, the downside trend for the EUR/USD pair has not yet exhausted itself. Almost all fundamental factors suggest that the pair's bears will again try to gain a foothold within the 12th figure, despite the current corrective pullback. The first target of the downside movement is the level of 1.1250 - this is the new price low for the year. Any corrective spikes can be used to open short positions. The material has been provided by InstaForex Company - www.instaforex.com |
| November 19, 2021 : EUR/USD daily technical review and trading opportunities. Posted: 19 Nov 2021 09:30 AM PST
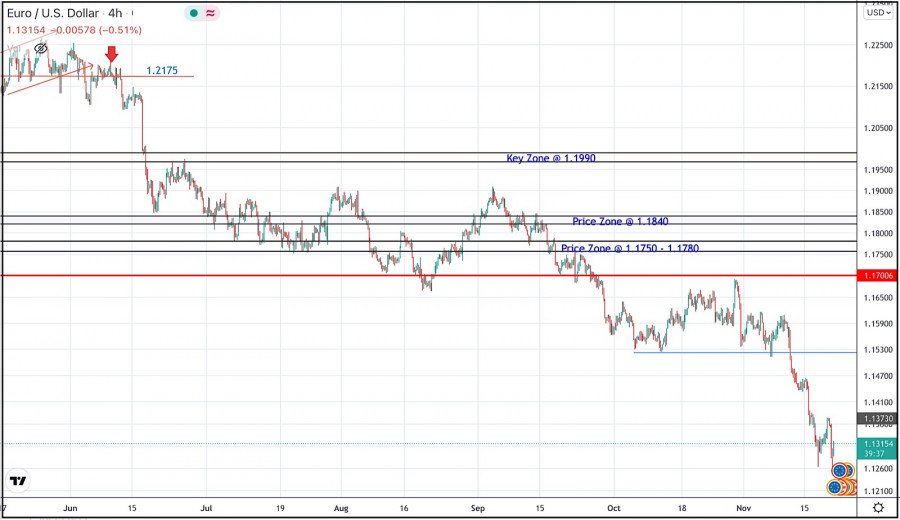
Recently, Persistence below the depicted price zone of 1.1990 indicated further downside movement towards 1.1840 and 1.1780 where a sideway consolidation range was established. During last week, the EURUSD pair has been trapped within a narrow consolidation range between the price levels of 1.1780 and 1.1840. A bullish breakout was executed above 1.1840 shortly after. Temporary Upside pullback was expected towards 1.1990. However, re-closure below the price level of 1.1840 has initiated another downside movement towards 1.1780 which failed to hold prices for a short period of time before significant upside movement was presented into market. Intraday traders were advised to wait for candlestick closure above 1.1780 - 1.1840 for another ascending swing to be initiated. However, immediate downside selling pressure brought the pair down below 1.1700. More downside movement took place towards the price level of 1.1600 where temporary bullish rejection has been maintained for some time. Shortly after, Market price slided below 1.1700 and 1.1600. This has enhanced further decline towards 1.1500. Currently, the price zone around 1.1500 stands as a prominent supply-zone to be watched for SELLING pressure and a possible SELL Entry upon any upcoming ascending movement. Moreover, it is not advised to add new SELL Entries as the pair already looks oversold. The material has been provided by InstaForex Company - www.instaforex.com |
| November 19, 2021 : EUR/USD Intraday technical analysis and trading plan. Posted: 19 Nov 2021 09:25 AM PST
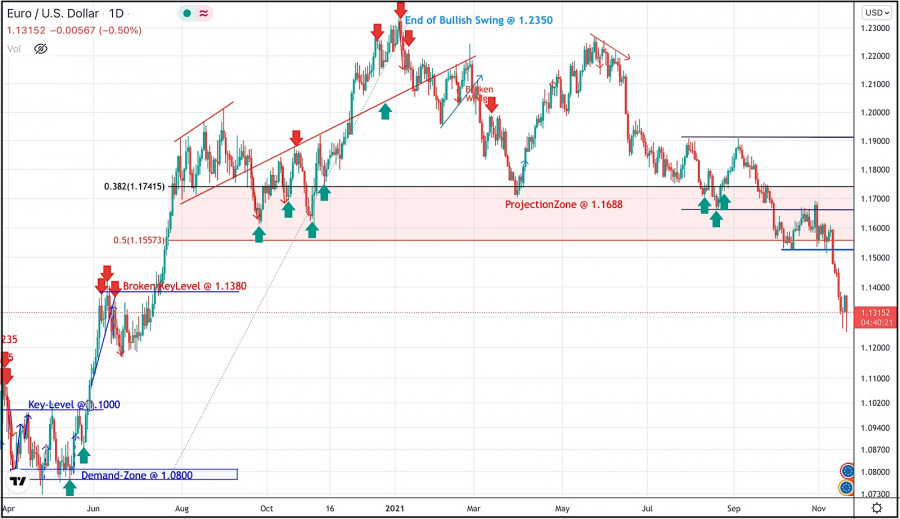
The bullish swing that originated around 1.1650 in August, failed to push higher than the price level of 1.1900. That's why, another bearish pullback towards 1.1650 was executed. Bullish signs were expected around the price levels of 1.1650-1.1700 for sometime as it corresponded to a recent previous bottom. However, extensive bearish decline has pushed the EURUSD pair towards 1.1600 and lower levels was reached. Shortly after, significant bullish recovery has originated upon testing the price level of 1.1570. The recent bullish pullback towards 1.1650-1.1680 was expected to offer bearish rejection and a valid SELL Entry. Significant bearish decline brought the EURUSD pair again towards 1.1550 levels which stood as an Intraday Support zone. Hence, sideway movement was demonstrated until bearish decline occurred towards 1.1325. Please note that any Bullish movement above 1.1500 should be considered as an early exit signal to offset any SELL trades. The price levels around 1.1520 remain a reference zone that needs to be re-visited when the current bearish momentum ceases to exist. The material has been provided by InstaForex Company - www.instaforex.com |
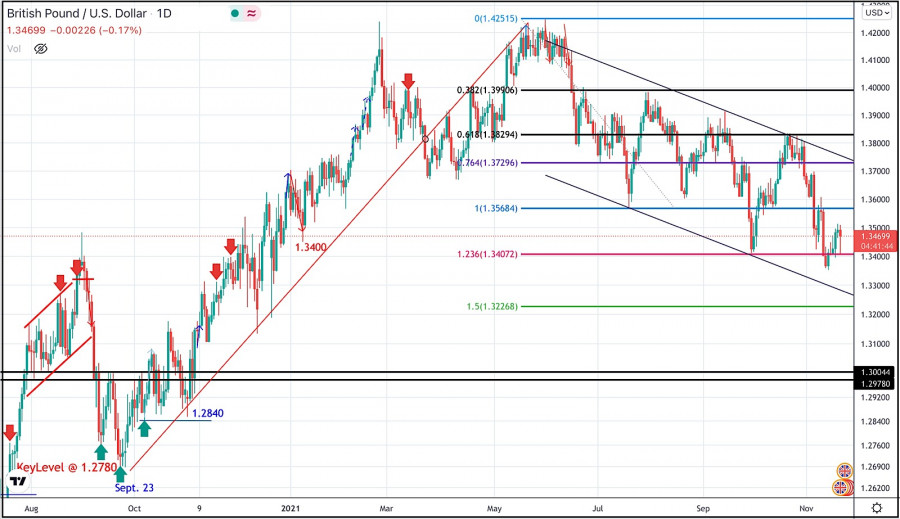
| November 19, 2021 : GBP/USD Intraday technical analysis and significant key-levels. Posted: 19 Nov 2021 09:24 AM PST
The GBPUSD pair has been moving sideways with some bearish tendency while bearish breakout below 1.3600 was needed to enhance further bearish decline. On the other hand, the nearest SUPPLY level was located around 1.4000 where bearish rejection and a valid SELL Entry was anticipated. Bearish breakout below 1.3680 enabled further bearish decline towards 1.3400 which corresponded to 123% Fibonacci Level of the most recent bearish movement. This was a good entry level for a corrective bullish pullback towards 1.3650 and 1.3720 which was temporarily bypassed. Shortly after, the pair was testing the resistance zone around 1.3830 where bearish pressure originiated into the market. Currently, the short-term outlook is bearish as long as the pair maintains its movement below 1.3730 and 1.3570. Another bearish visit was expected towards 1.3400 where significant bullish rejection was expressed as it corresponds to significant Fibonacci Expansion Level. Any bearish decline below it will probably enable more bearish extension towards 1.3250. On the other hand, the price level of 1.3570 stands as an intraday resistance level to be watched either for bearish reversal or a continuation pattern upon any upcoming visit. The material has been provided by InstaForex Company - www.instaforex.com |
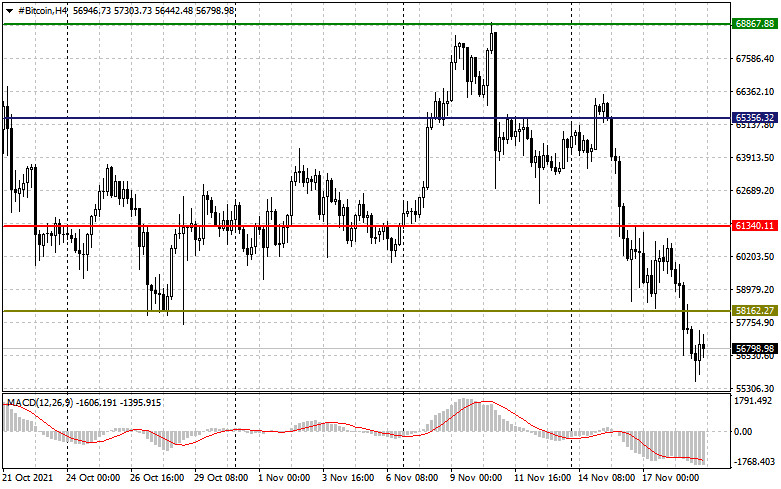
| Bitcoin: when and how crypto industry will begin to regulate Posted: 19 Nov 2021 08:01 AM PST Bitcoin failed to hold above the $60,000 area. The main cryptocurrency bounced off the resistance of 61,048.64 and, as expected, technically descended to the support of 55,842.84. Against this background, events can develop as follows. The first scenario is an attempt to return to the level of 61,048.64. And from there, perhaps, to growth. The second scenario is a fall to the next support of $52,000 per coin. In the meantime, we are waiting for things to calm down, I propose to shift our attention to long-term prospects, in particular, to issues of regulation of the crypto industry. Regulation of the crypto market: to be or not to beThe question of taking control of the rapidly developing crypto industry has been raised a long time ago. Market participants fear that the authorities will shut off the air to the market and stop innovations. Now it is still unclear what measures to apply, and this was clearly shown by the situation with the infrastructure law. On this occasion, an interesting article came across Bloomberg. Industry participants are proposing to take on this issue and engage in self-regulation. What is a cryptocurrency self-regulatory organization?Major exchanges, including Coinbase and Gemini, and well-known investors such as Andreessen Horowitz, have pushed the idea of a Self-Regulatory Organization (SRO). They argue that the organization is better at overseeing a new and complex industry than traditional agencies that are now trying to apply old rules to a new market. Proponents of this idea believe that the SRO could be more flexible in making decisions about the rules regarding new products since its members have both the experience and the resources. "The job of a regulator is not easy when you're confronting something new. The question is, how do you get to an environment where the regulatory infrastructure can be more nimble?" said Greg Xethalis, chief compliance officer at crypto investment firm Multicoin Capital. Market experience of self-regulationSelf-regulation on Wall Street has a long history. SROs, which are funded and run by their own members, set rules, conduct audits, and impose fines. They have powers delegated by Congress and regulatory bodies such as the Securities and Exchange Commission (SEC). Several years after Congress formed the SEC as part of President Franklin D. Roosevelt's New Deal, the agency delegated some oversight of brokers and brokerage firms to the National Association of Securities Dealers (NASD). This organization has now become the Financial Industry Regulatory Authority (FINRA). Its functions include oversight and licensing, it now controls commodity brokers, and the major stock exchanges themselves are self-regulatory organizations. What functions will cryptocurrency SRO take on?A self-regulatory organization, according to Bloomberg, can take responsibility for suppressing at least some of the violations by outsourcing serious fraud to agencies such as the SEC. For example, an SRO can decide whether a newly issued token should be classified as a security, commodity, or something else. Or deal with mundane tasks such as setting product disclosure rules or standards governing customer data management. Its behavior will be monitored by the SEC and other agencies, who will have the final say if they disagree with the SRO's decisions. What are the prospects for such a regulation scenario?Most supporters of an SRO agree that such an organization would likely need an act of Congress allowing the SEC, CFTC, or other regulators to register and potentially delegate authority to it. Such a bill could take years to pass. However, senators, including Wyoming Republican Cynthia Lummis, have said they plan to create comprehensive cryptocurrency legislation that could give SRO supporters the opportunity to bring their plan to life.
|
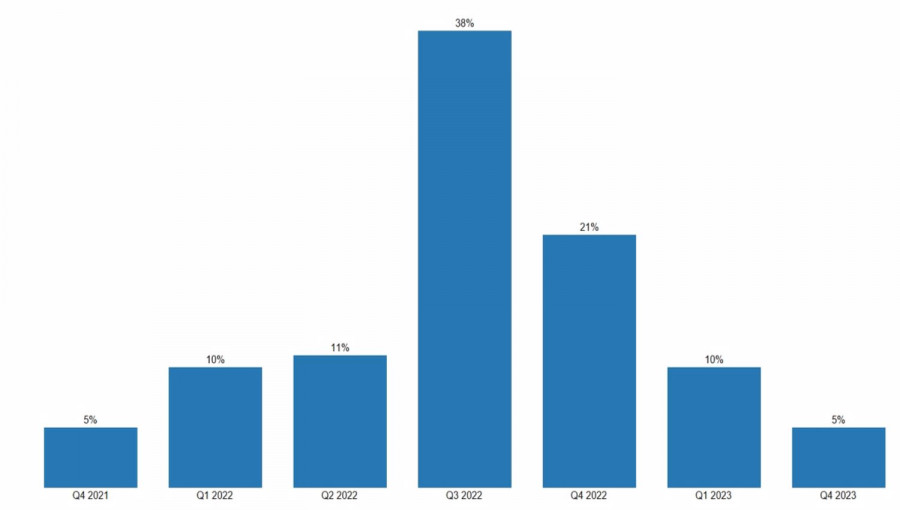
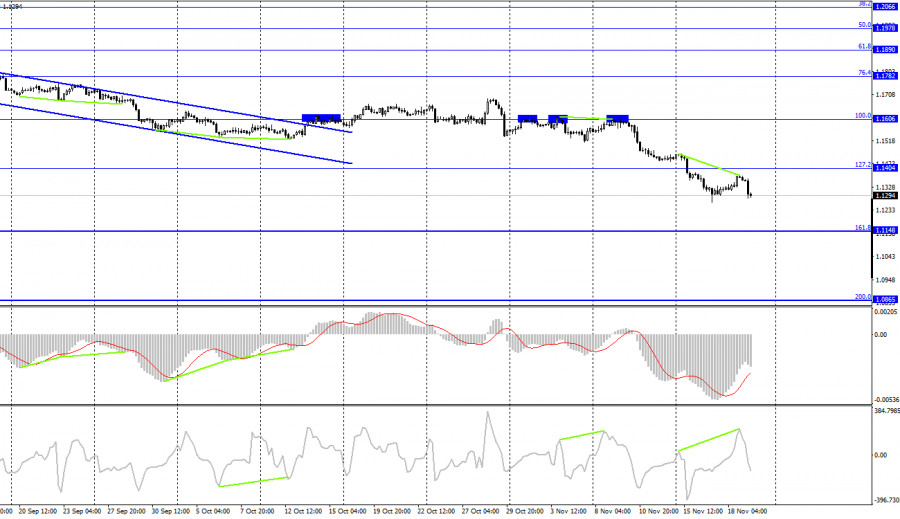
| EUR/USD: the sooner Fed starts to raise rates, the deeper the collapse Posted: 19 Nov 2021 07:57 AM PST While Christine Lagarde argues before the European Parliament that the tightening of the ECB's monetary policy will do more harm to the eurozone economy than good, the Fed's "doves" cautiously suggest that an increase in the federal funds rate in 2022 may be necessary. This opinion was reached by the president of the Federal Reserve Bank of Chicago, Charles Evans, saying that the increase in borrowing costs could become a reality if everything does not go according to the Fed's plan. While the plan is bursting at the seams. The acceleration of U.S. consumer prices to 6.2% YoY and retail sales to 1.7% MoM convince of two things. The U.S. economy looks very strong and is likely to accelerate by 3.8%-4% in the fourth quarter. Inflation does not even think to dance to the tune of the Fed. The growth in wages, rental costs, and the expansion of the list of goods and services that are experiencing increased price pressure indicate that there is no need to expect a slowdown in CPI and PCE until the second half of 2022. And then, the labor market will recover, pushing the Fed to raise the rate. And although Reuters experts predict that the first act of monetary restriction will take place only in the fourth quarter of next year, most of them believe that it would be better if it happened in September. Atlanta Federal Reserve President Raphael Bostic sets an even earlier date - mid-2022. Bank of America agrees with him and does not rule out that a double blow from wages and inflation could push the central bank to an earlier start of the process of tightening monetary policy. No matter how the Fed starts raising rates in the spring. Forecasts for the timing of the Fed rate hike
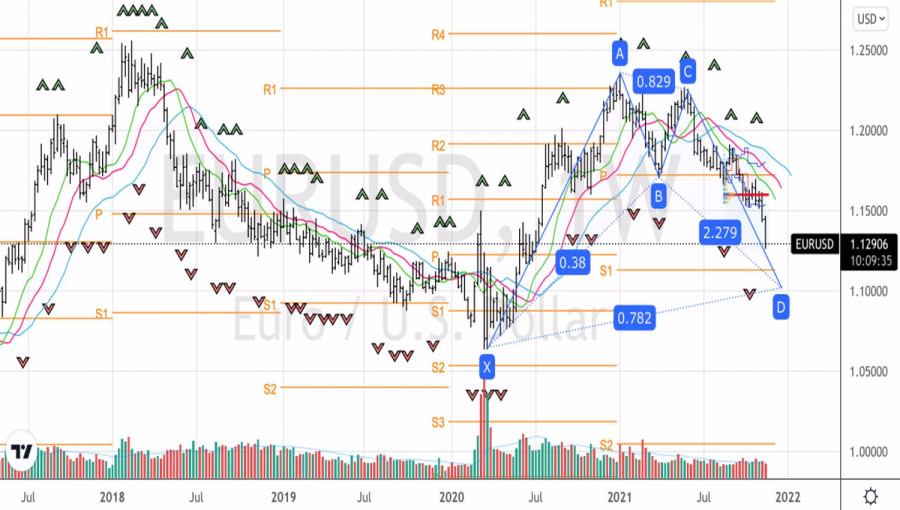
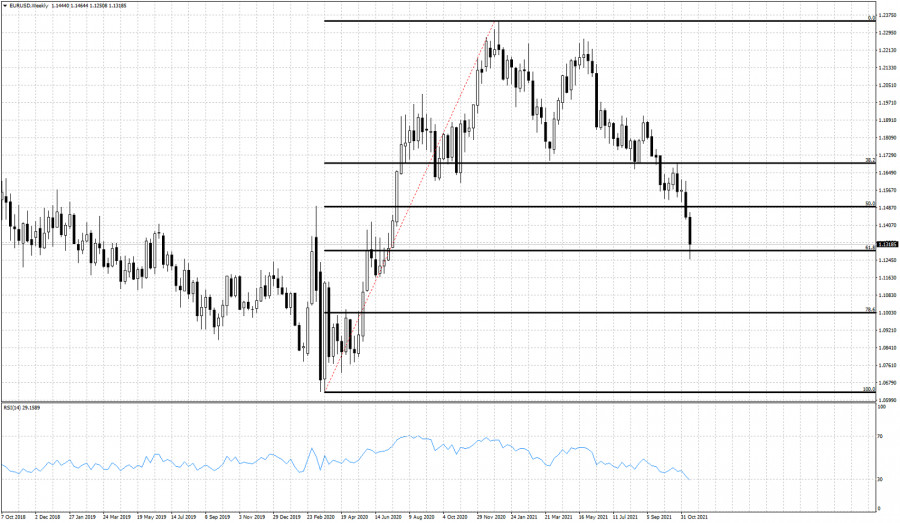
When one bank raises rates, and the second keeps them at the same level, it is clear where the money flows. From Europe to North America. Expectations of the Fed's monetary restriction lead to an increase in the yield of U.S. Treasury bonds, increase their attractiveness, and fuel demand from non-residents, including for the U.S. currency. Moreover, the shares look very presentable. It's not for nothing that the S&P 500 managed to mark 66th record close in 2021 – the best result since the early 1960s. There is nothing to answer the "bulls" on EURUSD and from the point of view of the economy. Unlike the United States, whose GDP is likely to accelerate in the fourth quarter, the eurozone is experiencing difficulties due to the energy crisis, the resurfacing of the Brexit issue, and the next wave of COVID-19. The key events of the week by November 26 will be the releases of data on European business activity and U.S. inflation. Bloomberg experts expect a slowdown in purchasing managers' indices in the manufacturing and services sectors of the currency bloc and an acceleration in the personal consumption expenditures index, the Fed's preferred inflation indicator. If this happens, the main currency pair will continue to seek its fortunes on the downside. Technically, a Gartley pattern has formed on the EURUSD weekly chart. Its target of 78.6% corresponds to the 1.1 mark. This indicates that the potential of the downward movement of the main currency pair is far from being exhausted and allows you to adhere to the previous strategy of selling on growth. EURUSD, Daily chart
|
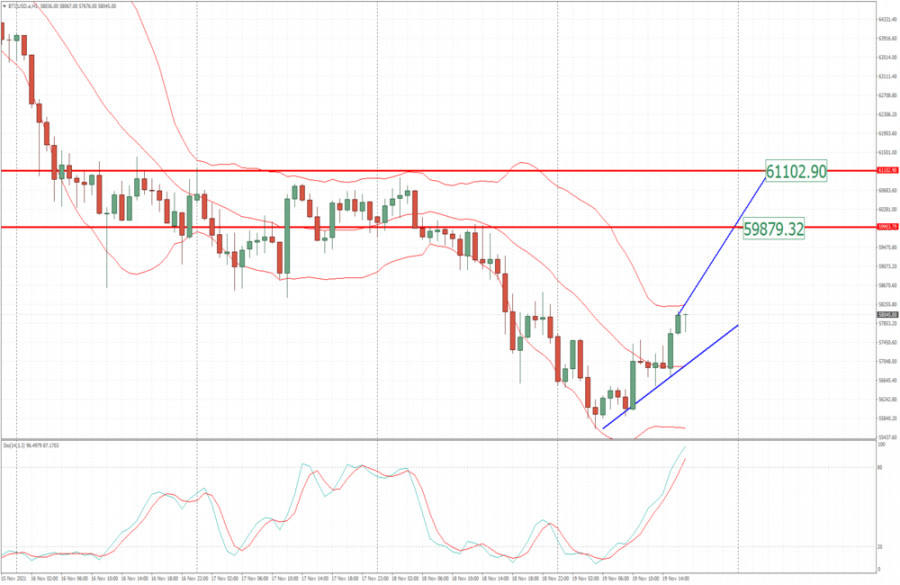
| BTC analysis for November 19,.2021 - Bullish intraday trend Posted: 19 Nov 2021 07:56 AM PST Technical analysis:
BTC has been trading upside today and I found upside trend with potential for another rally. Trading recommendation: Due to intraday bullish trend, watch for buying opportunities on the pullbacks with teh upside objectives at 59,880 61,100 Stochastic is showing strength and no signs for the reversal. Key support is set at the price of $55,680 The material has been provided by InstaForex Company - www.instaforex.com |
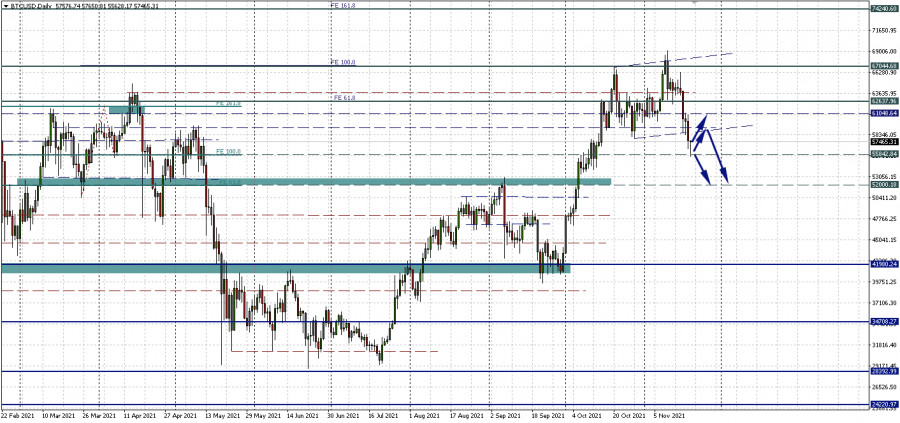
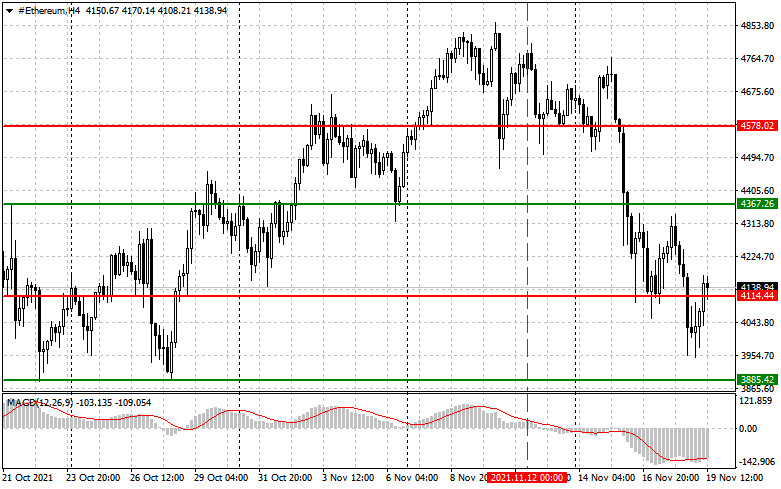
| Blockchain is ready for implementation in banking and financial markets Posted: 19 Nov 2021 07:54 AM PST While Bitcoin and Ether have corrected slightly after their sell-off on Thursday, blockchain technology is already mature enough to meet the critical needs of "at least certain segments of the banking and financial markets," according to a policy memo from the Reserve Bank of Canada. The memo points out that blockchain offers various models of work, ranging from proof of stake protocol, real-time two-way settlements to real-time service, high security, and automation. The bank believes that the securities markets, including mortgage-backed securities, have a high potential for integration into the blockchain. The bank said that despite the formation of the blockchain for over a decade, the technology until recently did not develop to a level that would be suitable for the banking and financial markets in terms of "scale, speed, flexibility, and autonomy." However, the technology itself has evolved enough since the launch of Ethereum in 2015 to meet the critical needs of at least certain segments of the banking and financial markets. Among the downsides, there was a weak regulation and regulatory framework that is very fluid given the speed of development of blockchain technology and the fact that it does not quite fit into existing legal and regulatory definitions. In any case, 2021 is a revolutionary year for this industry, since the events that we have observed and will continue to observe - everything speaks of the high potential and development of this technology in the future. To say that the cryptocurrency market and the blockchain are a pyramid - now only a madman is capable. Fed doesn't need CBDCIn his recent interview, Federal Reserve Board Governor Christopher Waller touched upon the topic of stablecoin, the regulation of which everyone expects in the near future. In his opinion, stablecoin should be governed by the same rules as banks, but there is a problem. Waller disagrees with some of the guidelines for stablecoin regulation that have been developed by the President's Working Group on Financial Markets (PWG). He explained that while banks should be able to issue stablecoins, not all stablecoin issuers need to be banks. Therefore, Waller disagrees that stablecoins should be fully subject to banking regulation. Waller also commented on central bank digital currencies (CBDCs) that the Federal Reserve is looking into. In the near future, the regulator will release a report on the digital dollar. According to the politician, he remains skeptical about the need for a CBDC, arguing that the Fed should not create a digital dollar in order to reduce the cost of payments. He also noted that there are already "real and fast innovations" in the payment sector, which will be implemented in the near future. As for the technical picture of Bitcoin
Obvious problems with the level of $58,160, which buyers of risky assets managed to protect on October 17, remain. Its breakdown posed a direct threat to the bullish rally seen since July this year, following the Bitcoin crash in May. The breakdown of $58,160 opened a direct road to the 100-day moving average, passing around $53,000. There is a level of $54,444 a little above this average, and the moving average will most likely tighten there before the range is updated. Therefore, it is clearly not worth rushing to buy the world's first cryptocurrency. First, find the bottom, and then we will think about where it is better to enter the market. It will be possible to speak about leveling the situation in favor of buyers more safely only after the rate confidently returns and gains a foothold above $61,300. As for the technical picture of Ether
The bulls are actively fighting to regain control of the support of $4,114, which they missed yesterday. If this does not work, the situation may worsen, which will lead to another wave of decline to the $3,885 area and open a direct path to $3,600. I advise you to enter the market from these levels in the case there are large players in the market, but for now, everything says that no one is going to go anywhere, most likely rebounds from these levels will be instantaneous. We can talk about the stabilization of the situation with the rate after Ether has confidently consolidated above the resistance of $4,360, which will allow it to quickly return to $4,580. The material has been provided by InstaForex Company - www.instaforex.com |
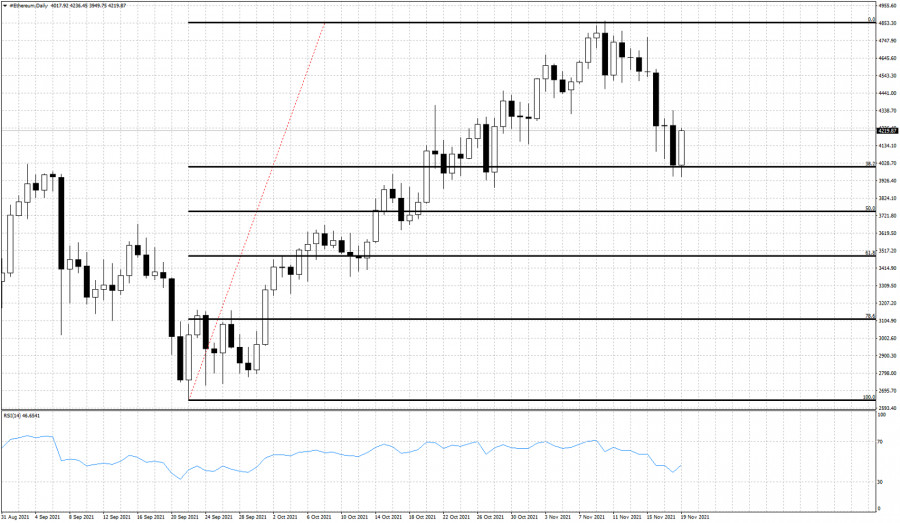
| Ethereum respects the 38% Fibonacci retracement level. Posted: 19 Nov 2021 07:51 AM PST Ethereum broke out of the bullish channel and so far has made a 38% retracement of the entire upward move that started around September 22nd. At current levels I prefer to be neutral Ethereum as I believe we are not done with the correction yet.
Price as we said above has managed to test the 38% retracement twice and both times support has held. This increases the importance of this support area and in case price breaks below, the chances of moving lower towards the 50% retracement will be high. I expect Ethereum to form a lower high over the weekend and resume the pull back next week. The material has been provided by InstaForex Company - www.instaforex.com |
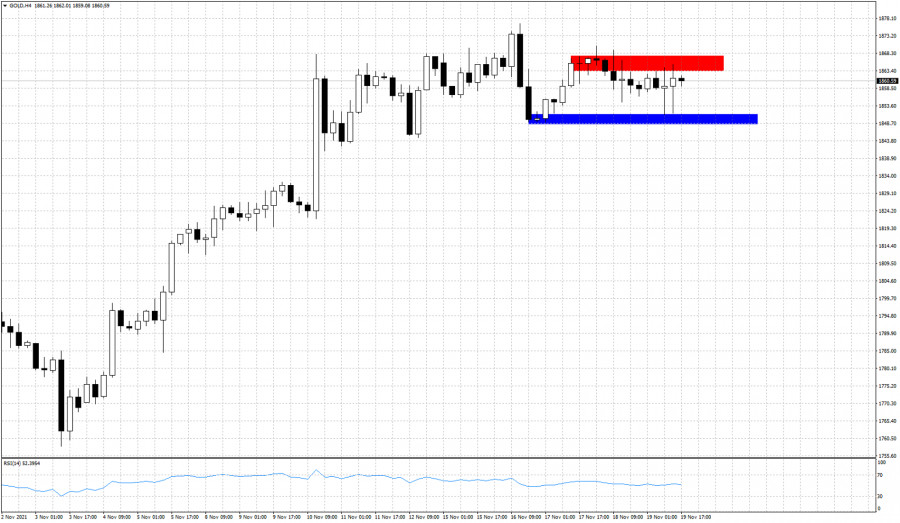
| Gold trapped inside short-term trading range. Posted: 19 Nov 2021 07:48 AM PST Gold price was very volatile the last couple of days with price touching $1,850 three times and testing resistance at $1,863-68 five times. Most probable outcome would be for price to move lower towards $1,800, but traders need to be patient and not front run the market.
Blue rectangle - support Gold price tested the $1,850 support twice yesterday. This is promising for bulls. Breaking above $1,865-70 would be a bullish sign and would push price towards $1,900. However I expect the new higher high if it comes, to be accompanied by a lower high in the RSI and a bearish divergence warning. I believe it is time Gold makes a corrective pull back. Breaking below $1,850 would be the signal that confirms the start of the pull back. My first target is at $1,830 and next at $1,810. The material has been provided by InstaForex Company - www.instaforex.com |
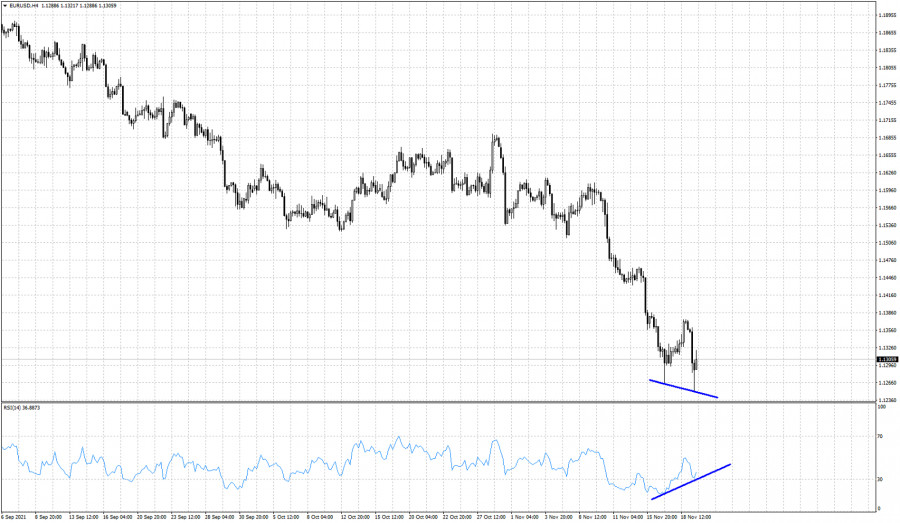
| EURUSD approaching end of the decline. Posted: 19 Nov 2021 07:43 AM PST EURUSD made a new lower low today at 1.1250. Price is now at 1.1316. Trend remains bearish as price continues making lower lows and lower highs. Today the RSI has provided a bullish divergence as it did not make a lower low.
The bullish divergence is warning that the downtrend is weakening. This is not a reversal signal. Resistance is at yesterday's high at 1.1375. Breaking above this level would be an important sign of strength and the first sign of a reversal. At current levels I prefer to be neutral EURUSD and not bearish anymore. Price has the potential to bounce strongly if not make a major low and major reversal.
EURUSD has so far retraced 61.8% of the entire upward movement. At 61.8% retracement levels we usually see trend reversals. This is key Fibonacci support. This is another reason why I prefer to be cautious. We were bearish near 1.22 and we believe now it is time be cautious and that bears should take at least partial profits. The material has been provided by InstaForex Company - www.instaforex.com |
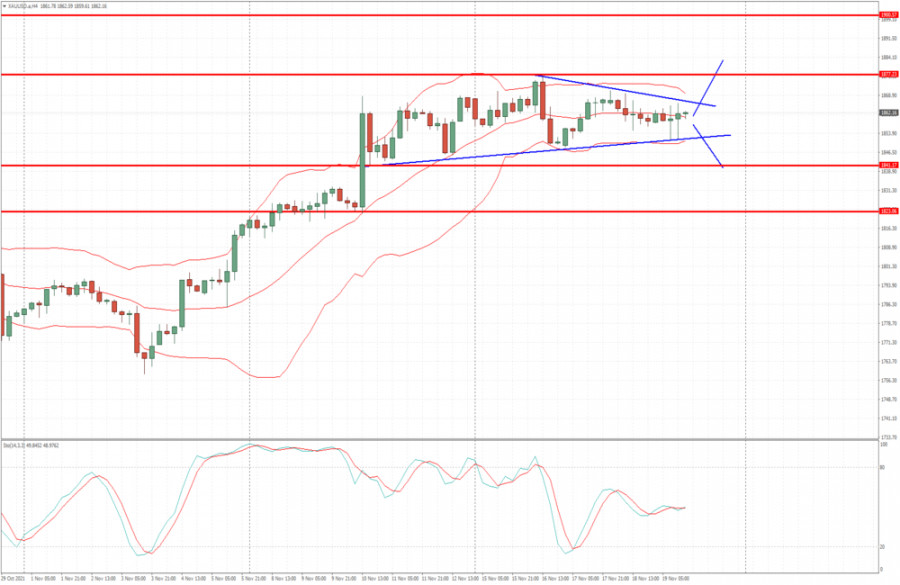
| Analysis of Gold for November 19,.2021 - Breakout might be in the play Posted: 19 Nov 2021 07:43 AM PST Technical analysis:
Gold is still in the strong sideways regime and I expect this regime to be active until the FOMC meeting minutes next week. Trading recommendation: Due to strong sideways condition in last few days and low volume on the market, I see potential for the breakout in next period. Upside breakout of resistance at the price of $1,877 can lead us towards $1,900 Downside breakout of support at $1,841 can lead us towards $1,823 Watch for the breakout to confirm further direction.... The material has been provided by InstaForex Company - www.instaforex.com |
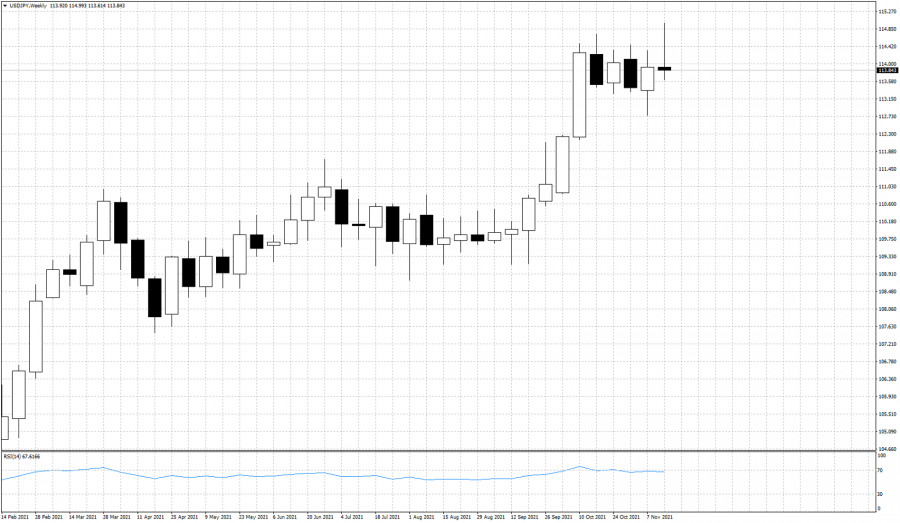
| Weekly reversal candle in USDJPY. Posted: 19 Nov 2021 07:37 AM PST USDJPY reached as high as 114.99 this week making a new weekly high. However bulls were unable to hold price near that new high. The week is about to end with prices lower than last week and near the lower end. This has formed a bearish hammer in the weekly chart.
|
| Posted: 19 Nov 2021 07:36 AM PST
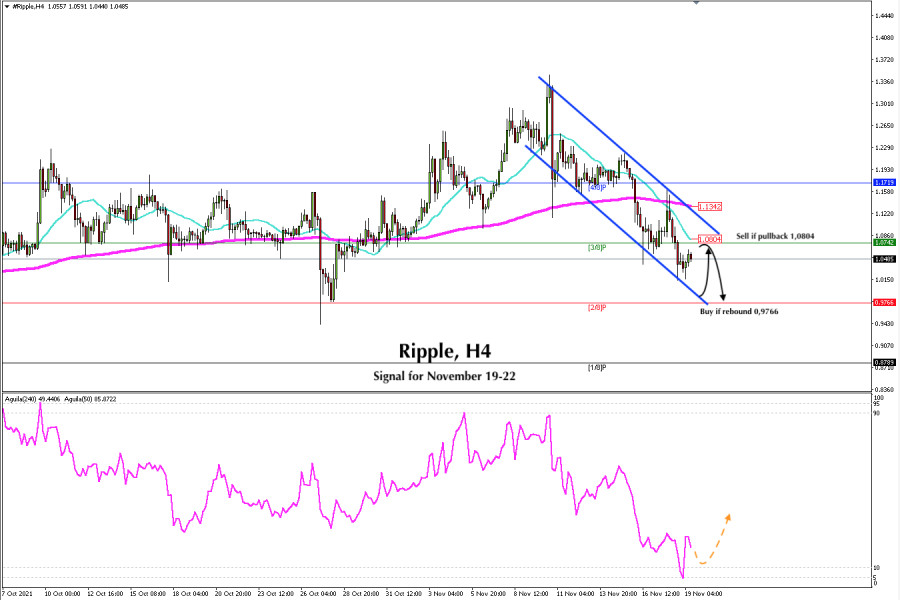
Since November 10, the price of Ripple (XRP) has been trading within a downtrend channel. In the European session, the bottom of this downtrend channel has been tested. The bounce is expected to continue towards the 21 SMA located at 1,0804. A pullback around 3/8 from Murray and the 21 SMA will be a good opportunity to sell in the next few hours. XRP price has settled just below the 21 SMA and below the 200 EMA located at 1,1342 showing a bearish bias. Bearish pressure is likely to continue for the next few days towards the 2/8 murray support around 0,9766. On November 18, the eagle indicator reached the extremely oversold zone of around 5 points. This means that XRP could recover some of the losses in the next few hours. We should wait for a good point to sell at the resistance of 1,084 or the 200 EMA at 1,1342. A selloff in BTC pushing it to the psychological 50,000 level will likely cause XRP to drop due to the direct correlation. In that case, market participants can expect Ripple to fall to the psychological level of $ 1,00 On the other hand, a close on 4-hour charts above 1,1342 will be the start of a bullish move and we could expect a return towards the resistance level of 1,3360. Support and Resistance Levels for November 19 - 22, 2021 Resistance (3) 1,1719 Resistance (2) 1,1318 Resistance (1) 1,0816 ---------------------------- Support (1) 0,9823 Support (2) 0,9253 Support (3) 8,8789 *********************************************************** A trading tip for RIPPLE for November 19 - 22, 2021 Sell in case of pullback at 1,0804 (SMA 21) with take profit at 0,9766 (2/8), stop loss above 1,10. The material has been provided by InstaForex Company - www.instaforex.com |
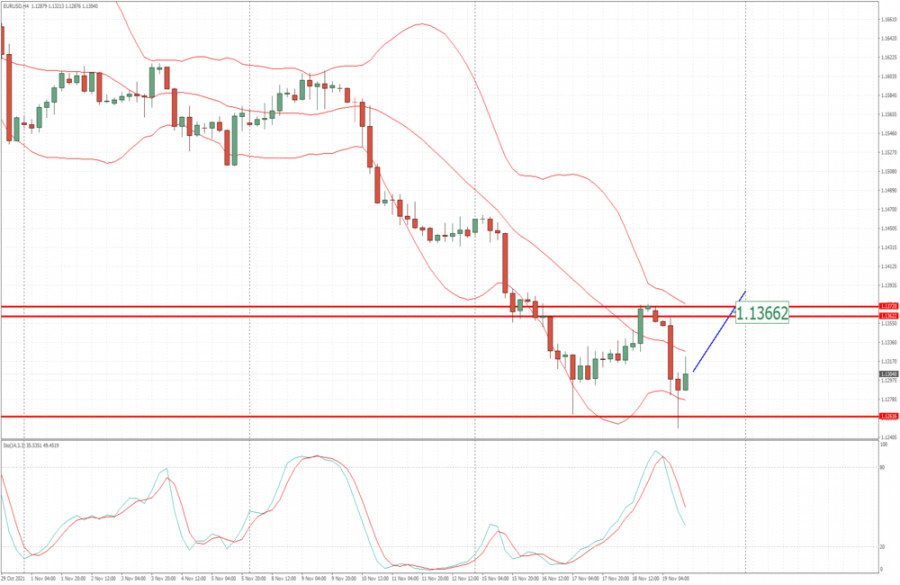
| EUR/USD analysis for November 19, 2021 - Upside rotation in the play Posted: 19 Nov 2021 07:30 AM PST Technical analysis:
EUR/USD has been trading downside today but there is big rejection from the support at the price of 1,1263 and I see potential for the upside movement. Trading recommendation: Due to strong rejection in the background and potential for the upside movement. My advice is to watch for buying opportunities Upside objective is set at 1,1365 There is strong buying tail in the background based on the 4H time-frame, which is sign for potential aggressive buyers. Support level is set at the price of 1,1250 The material has been provided by InstaForex Company - www.instaforex.com |
| Video market update for November 19,2021 Posted: 19 Nov 2021 06:59 AM PST Watch for the reversion to the mean trades... The material has been provided by InstaForex Company - www.instaforex.com |
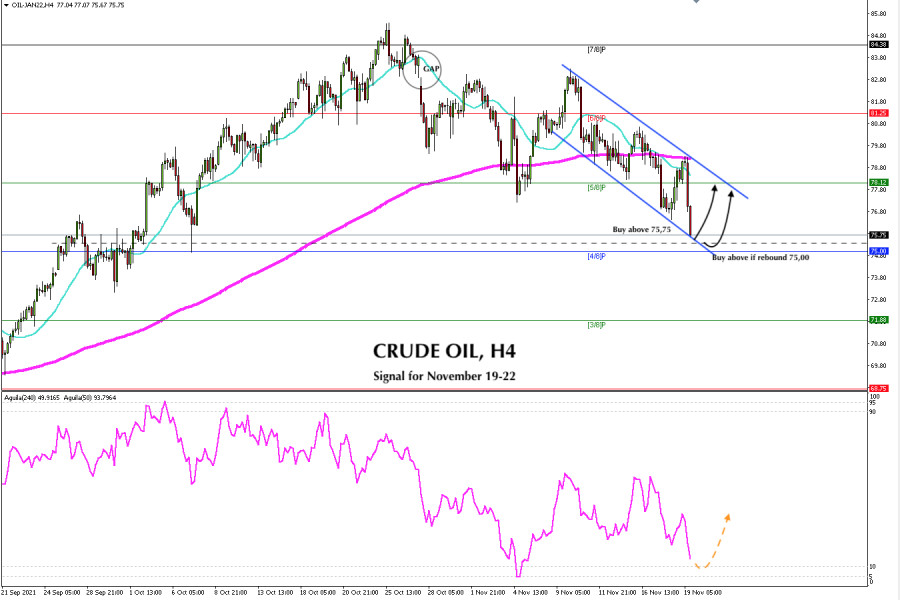
| Trading signal for CRUDE OIL (#CL) on November 19 - 22, 2021: buy above $75,00 (4/8) Posted: 19 Nov 2021 06:58 AM PST In our analysis of November 17, we explained through the daily chart the possibility that crude could fall to the level of 75,00. The Crude (#CL) had formed a symmetrical triangle pattern and we have seen the fulfillment of this signal. You can review through this link and get some tips for your strategy.
On October 27, crude oil has left a bearish GAP. As long as this gap is not closed, there is the possibility that crude oil could return towards the level of 83,80 and up to 84,38 in the medium term. According to the 4-hour chart, crude is falling very strongly and is ready to reach the bottom of the downtrend channel. This bearish channel has been formed on Nov 10 and is likely to find good support around 4/8 murray at 75,00. The eagle indicator is approaching the extremely oversold level at around 10 points. It is likely that in the next few hours or days there is a good technical bounce above the pivot point of 4/8 murray (75,00). Since October 25, WTI has entered a downward correction period. The price is likely to continue oscillating in the next few days and may bounce above 75,00 towards the 21 SMA located at 78.53. A sharp breakout and consolidation above 80,00 (EMA 200) could be the start of a bullish move that could reach the 7/8 Murray level at 84,38. Our trading plan is to buy above 75,75 or 75,00 with targets at 78,12 and up to 80,00 where there is the top of the EMA 200. Conversely, a break below 75,00 (4/8) will be the signal to sell with targets at 71,88 (3/8). Support and Resistance Levels for November 19 - 22, 2021 Resistance (3) 78,12 Resistance (2) 77,79 Resistance (1) 76,89 ---------------------------- Support (1) 75,49 Support (2) 75,00 Support (3) 74,54 *********************************************************** A trading tip for CRUDE OIL for November 19 - 22, 2021 Buy above 75,75 or in case of rebound at 75,00 (4/8) with take profit at 77,79 and 78,12 (5/8), stop loss below 75,30 and 74,50. The material has been provided by InstaForex Company - www.instaforex.com |
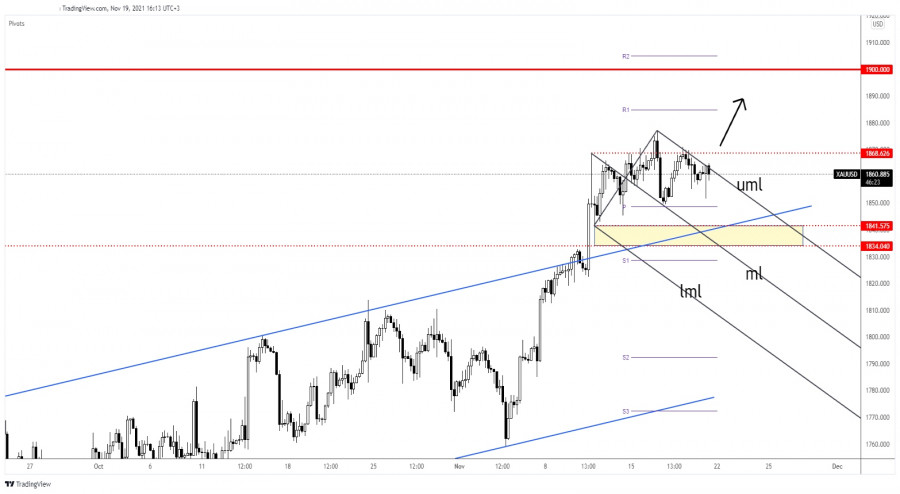
| Gold upside pressure intensifies Posted: 19 Nov 2021 06:38 AM PST The price of gold is trading at 1,863.73 level far above 1,851.62 today's low. As you already know from my previous analyses, the bias remains bullish despite temporary declines. The yellow metal dropped a little today only because the Dollar Index has rallied. Today, the volatility was very high, so anything could happen in the short term. The Dollar Index increased as much as 96.23 level where it has found resistance. DXY failed to reach the 96.26 previous high. The price of gold is still under pressure after the Canadian retail sales data come in better than expected earlier. We'll have to wait for a strong bullish signal before deciding to go long. XAU/USD Attractive For Buyers!
As you can see on the h4 chart, XAU/USD continues to pressure the descending pitchfork's upper median line (uml) which stands as a dynamic resistance. The previous H4 candle signaled that the upside pressure is high. Gold failed to reach the weekly pivot point of 1,848.72 signaling strong buyers. A valid breakout through the descending pitchfork's upper median line (uml) could activate potential further growth. XAU/USD Prediction!The bias is bullish, so jumping and closing above 1,868.62 static resistance is seen as a buying opportunity. Gold could still grow as long as it stays above the pivot point and above the channel's upside line. 1,900 psychological level is seen as an important upside target. The material has been provided by InstaForex Company - www.instaforex.com |
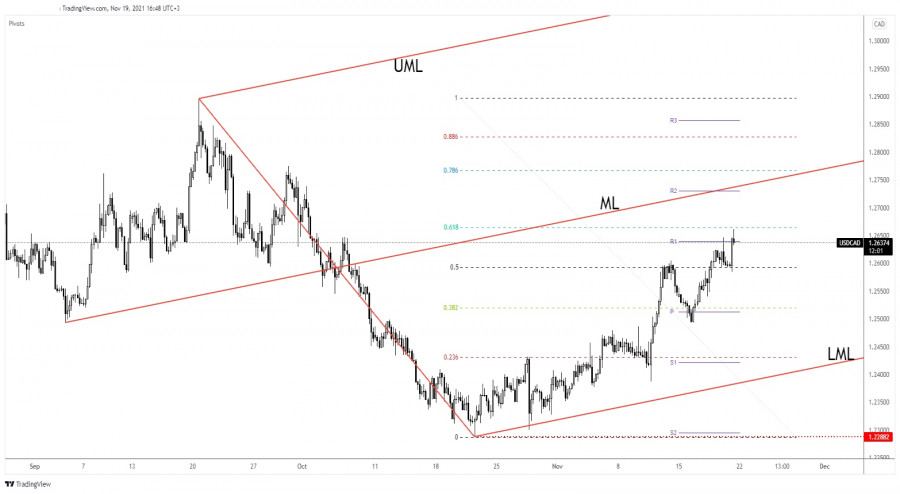
| USD/CAD upside paused due to better-than-expected Canadian retail sales Posted: 19 Nov 2021 06:34 AM PST The USD/CAD pair increased as much as 1.2662 as the Dollar Index boosted the USD. Now, the pair dropped a little and it's traded at 1.2639 level. Still, the bias remains bullish, USD/CAD could approach and reach fresh new highs anytime. In the short term, the Loonie could try to appreciate a little after the Canadian retail sales data come in better than expected. The Retail Sales indicator reported only a 0.6% drop in September versus 1.6% expected and after a 2.1% drop in August, while the Core Retail Sales dropped only by 0.2% versus 1.0% estimated. USD/CAD Attracted By The Median Line!
If you remember, I've told you in my previous analysis that the USD/CAD pair could extend its growth if it stays above the 50% retracement level. Today, it has registered a major bullish engulfing invalidating its drop below the 50% level. Now, it has managed to close above the weekly R1 (1.2639) level which was seen as a static resistance. Stabilizing above this obstacle may confirm further growth. Still, in the short term, we cannot exclude a temporary decline before climbing towards new highs. USD/CAD Outlook!At the time of writing, USD/CAD is traded in the red only because the DXY crashes. Also, after its failure to take out the 61.8% retracement level, the pair could come down to retest the 50% retracement level. It could still grow as long as it stays above the 50% (1.2592) retracement level. Developing a minor consolidation here could bring new long opportunities. Stabilizing above 1.26 psychological level could signal an upside continuation. The median line (ML) could still attract the price, this is seen as an upside target. USD/CAD confirmed the ascending pitchfork after retesting the lower median line (LML). A new higher high, jumping and closing above the 61.8% retracement level could signal more gains. The material has been provided by InstaForex Company - www.instaforex.com |
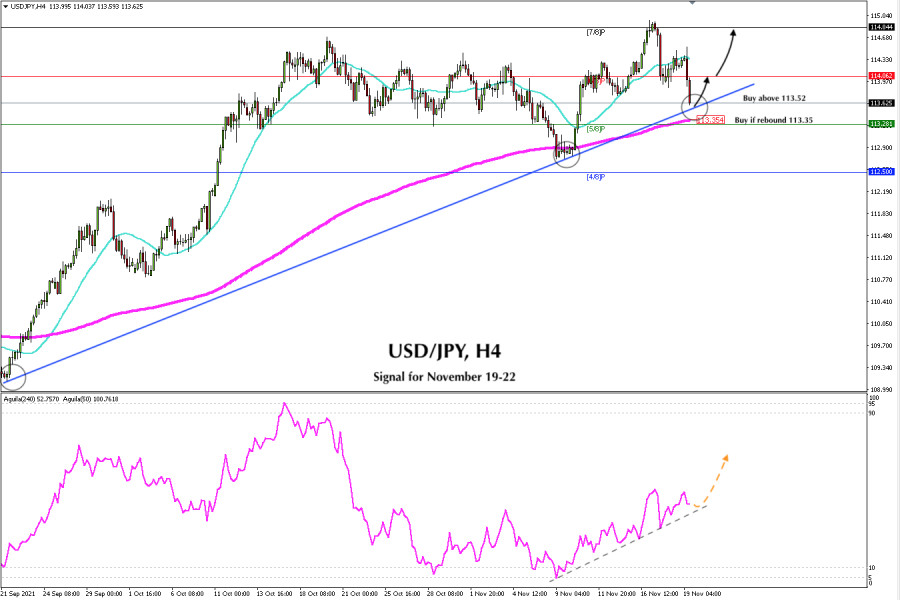
| Trading signal for USD/JPY on November 19 - 22, 2021: buy above 113.52 (uptrend channel) Posted: 19 Nov 2021 06:11 AM PST On November 17, USD / JPY hit a high of 1.1496 around 7/8 murray. This level represents a technical reversal zone seen in recent hours falling below the 21 SMA. In our analysis on November 17, referring to the daily chart, we explained the reasons why the Japanese yen should fall towards the support at 113.86. You can review this article through this link and get some tips that will be useful for your strategy.
The Japanese yen could put its strength at risk seen in the last hours. Japan's government will inject massive supply of the yen into the market as a fiscal stimulus package against COVID-19 crisis. This package is intended to revitalize the Japanese economy and in turn could further weaken the Japanese currency. So, we could see an upward movement in the short term towards the level of 117.00 or even to the psychological level of 120.00 The uptrend formed on September 29 remains intact for the Japanese yen. This morning of the American session, USD/JPY is testing the bottom of the trend channel. In the next few hours, a technical rebound is expected towards the SMA of 21 located at 114.30. The short-term outlook continues to be bullish as long as the pair remains above the 200 EMA located at 113.35. Any pullback will be considered a technical correction and it could be a good opportunity to continue buying the yen in the coming days. Our trading plan is to buy if the pair rebounds off 113.50 with targets at 114.06 and up to 114.84. A consolidation above the EMA 200 located at 113.35 will be a signal to buy the yen again with targets at 115.62. Support and Resistance Levels for November 19 - 22, 2021 Resistance (3) 114.32 Resistance (2) 114.06 Resistance (1) 113.89 ---------------------------- Support (1) 113.57 Support (2) 113.28 Support (3) 112.97 *********************************************************** A trading tip for USD/JPY for November 19 - 22, 2021 Buy above 113.52 (uptrend channel) with take profit at 114.06 (6/8) and 114.84 (7/8), stop loss below 113.15. The material has been provided by InstaForex Company - www.instaforex.com |
| US labour market recovers and economy picks up Posted: 19 Nov 2021 05:41 AM PST
The number of Americans claiming unemployment benefits for the first time fell by 1,000 to 268,000. This means that the country's unemployment benefit payment rate has reached its lowest level since March 2020. A strong labour market, which was typical of the American economy in the pre-crisis period, is once again a feature of it. As can be seen, the US economy has started to recover after a brief lull in the run-up to winter. Notably, the summer period in the United States fell on the spread in the country of a new strain of the COVID-19, which is slowing the recovery process. Despite the positive news, the demand for labour force in the US is still very high. "Demand for labor is very strong and workers are in short supply, so layoffs are very low right now," said Gus Faucher, chief economist at PNC Financial in Pittsburgh, Pennsylvania. Millions of unemployed Americans do not want to go to work, preferring to stay at home even after generous federal government benefits expire. The opening of schools for full-time training and increasing wages by companies have so far failed to solve the problem. On Thursday, it was announced that manufacturing activity in the mid-Atlantic region had accelerated this month. For example, representatives of factories in eastern Pennsylvania, southern New Jersey and Delaware reported a significant increase in orders. Despite this positive news, the shortage of workers and the necessary raw materials has left companies with a lot of unfinished work. Even an increase in working hours has not helped to solve the problem. For this reason, manufacturing companies are predicting a rise in capital expenditure next year. It should be noted that the production of many goods in the US is facing great difficulties. There is currently a very high demand for various products on the market, but it is almost impossible to meet consumer demands in a timely manner. Oren Klachkin, a leading economist at Oxford Economics in New York, said supply chain difficulties would not be resolved next year. Hopefully, the second half of 2022 will be more positive in this regard. Notably, the recovery of the US labour market is keeping pace with rising US consumer inflation. The US inflation rate is now at its highest level since the last time it was seen 30 years ago. Analysts therefore expect the Federal Reserve to begin raising interest rates earlier than many other regulators. The recovery in the US labour market is a positive sign for the dollar, which traded higher on Friday, particularly against the euro. The dollar was up 0.53% to 95.99 against a basket of six other currencies.
|
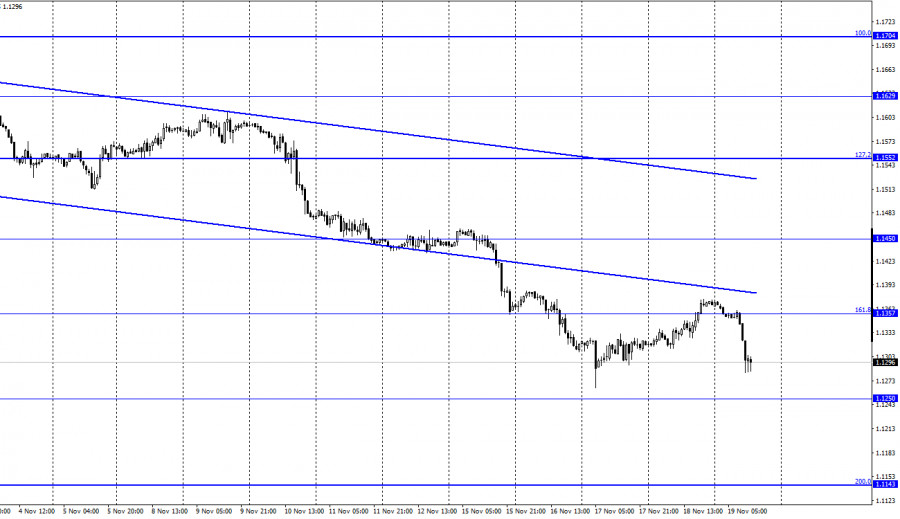
| Forecast for EUR/USD on November 19 (COT report). Austria goes into quarantine Posted: 19 Nov 2021 05:31 AM PST EUR/USD – 1H.
The EUR/USD pair performed a reversal in favor of the US currency yesterday and resumed the process of falling in the direction of 1.1250. The rebound of quotes from this level will allow us to count on a reversal already in favor of the EU currency and some growth back to the corrective level of 161.8% (1.1357). Fixing the pair's rate below the level of 1.1250 will increase the chances of continuing to fall towards the next Fibo level of 200.0% (1.1143). You should immediately pay attention to the fact that the euro and the pound have fallen synchronously today, which makes you think about the information background much deeper. After all, today in the first half of the day nothing was interesting either in the European Union or in America. The euro could not fall just like that, and the dollar cannot grow just like that. However, the following situation is possible. A new lockdown will be introduced in Austria from next Monday, already the fourth in a row, as the number of cases of coronavirus in the country continues to grow. Since not all Austrians wanted to be vaccinated, at this time the percentage of the fully vaccinated population is 65. Chancellor Alexander Schallenberg said that from February 1, vaccination will be mandatory for everyone. Thus, from the very beginning of the week, the dollar may rise due to the growing demand for protective assets. In addition, the acute situation with coronavirus is observed in the European Union, so additional pressure is being exerted on the euro currency. To top it all off, ECB President Christine Lagarde has been saying all week that rates will not be raised next year. Thus, there are three factors at once that do not just hinder the growth of the euro currency but support its fall. With such an informational background, the euro may continue to fall in the coming weeks. A lot will now depend on the new wave of the pandemic in the European Union. With the arrival of the cold season, the number of diseases increases, and new strains of the virus continues to be detected in the world. EUR/USD – 4H
On the 4-hour chart, the pair's quotes were secured under the corrective level of 127.2% (1.1404), which allows us to count on the continuation of the fall in the direction of the next corrective level of 161.8% (1.1148). The bearish divergence of the CCI indicator allowed today to resume the process of falling. No new emerging divergences are observed in any indicator today. News calendar for the USA and the European Union: EU - ECB President Christine Lagarde will deliver a speech (08:30 UTC). EU - ECB President Christine Lagarde will deliver a speech (18:00 UTC). On November 19, the EU calendar contains two more speeches by Christine Lagarde, and the US calendar is empty. However, traders now do not even need a new Lagarde speech to clearly understand how to trade a pair. The information background will be weak today. COT (Commitments of Traders) report:
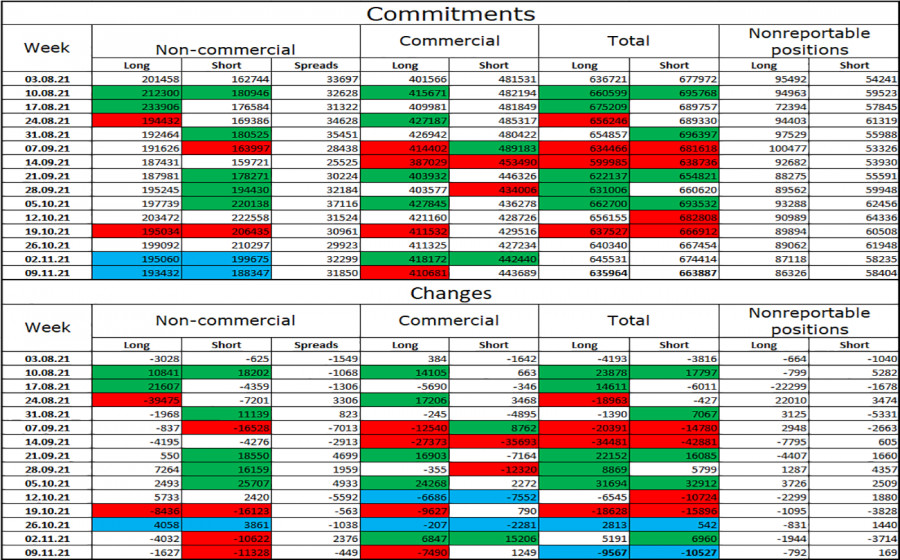
The latest COT report showed that during the reporting week, the mood of the "Non-commercial" category of traders became more "bullish". Speculators closed 1,627 long contracts on the euro currency and 11,328 short contracts. Thus, the total number of long contracts in the hands of speculators decreased to 193 thousand, and the total number of short contracts - to 188 thousand. These numbers practically coincide for the second week in a row, which gives reason to assume that there is no clear mood among speculators. However, in general, in recent months there has been a tendency to strengthen the "bearish" mood. Perhaps it's just that now the mood of traders is at a point where neither bulls nor bears have an advantage. However, the European currency continues to fall at the same time, therefore, the tendency to strengthen the "bearish" mood is correct. EUR/USD forecast and recommendations to traders: I recommended selling the pair at the close under the level of 1.1357 on the hourly chart from 1.1250. Now, these deals can be kept open. Or open new ones in case of a rebound from the level of 1.1357. Purchases – when rebounding from the 1.1250 level on the hourly chart with a target of 1.1357. Terms: "Non-commercial" - major market players: banks, hedge funds, investment funds, private, large investors. "Commercial" - commercial enterprises, firms, banks, corporations, companies that buy foreign currency not to make speculative profits, but to ensure current activities or export-import operations. "Non-reportable positions" are small traders who do not have a significant impact on the price. The material has been provided by InstaForex Company - www.instaforex.com |
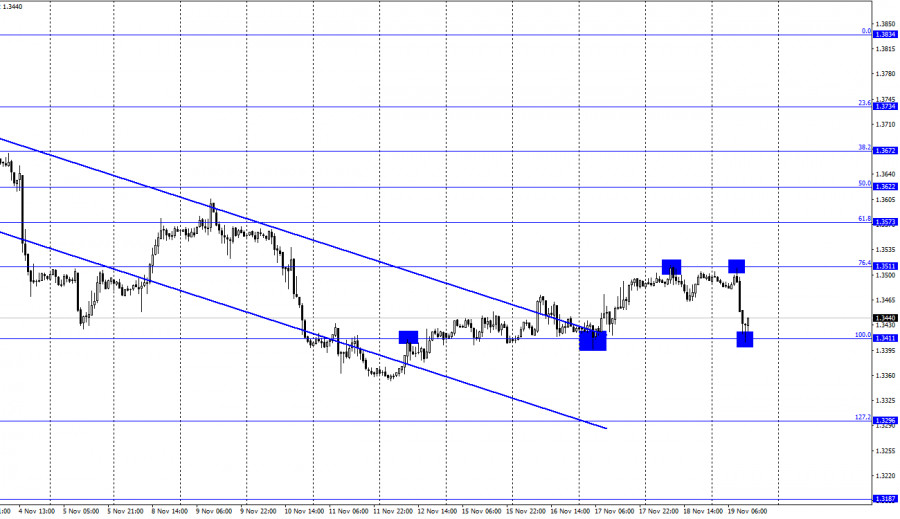
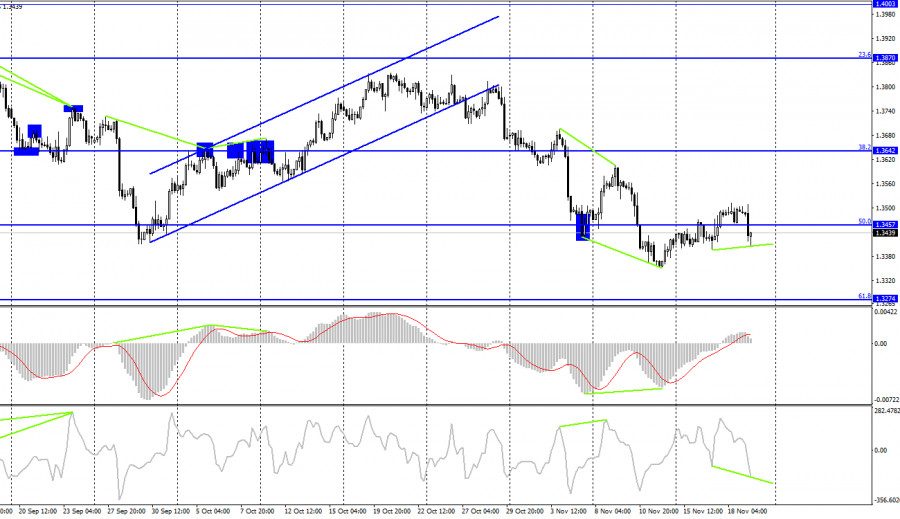
| Posted: 19 Nov 2021 05:17 AM PST GBP/USD – 1H.
According to the hourly chart, the GBP/USD pair on Thursday performed a rebound from the Fibo level of 76.4% (1.3511), a reversal in favor of the US currency, and a fall to the corrective level of 100.0% (1.3411). The rebound of quotes from the level of 100.0% worked in favor of the UK currency, and the process of growth towards the level of 1.3511 has already begun. However, closing below the level of 1.3411 will increase the probability of a further fall in the direction of the next corrective level of 127.2% (1.3296). As I said in the review of the euro/dollar pair, at this time, there is a high probability of the growth of the US currency. It is not the euro and the pound that is falling, but the dollar is growing. Why this may be – because the situation with the pandemic continues to worsen in the European Union, and the UK quietly and imperceptibly, but continues to remain in second place in the world in terms of the number of new diseases. Over the past week, about 260 thousand people have been infected in Britain. Let me remind you that Britain is one of the few countries in the world where almost the entire adult population is vaccinated. However, as we can see, vaccines do not save from infection, but only facilitate the course of the disease and reduce the risk of complications. In addition, the virus does not stand still but develops itself. Every few months, a new strain appears, which is usually more contagious than the previous one. Thus, the demand for the dollar can grow now as a protective asset. The retail trade report for October was released in the UK today. Although this indicator turned out to be slightly better than traders' expectations, the pound did not feel any joy about this. On the contrary, just in the morning, its new fall began. At the same time, negotiations between the European Union and Britain on the issue of the Northern Ireland border are continuing, but so far there is no new information about this. If the parties fail to reach an agreement, it may also put pressure on the British position. GBP/USD – 4H.
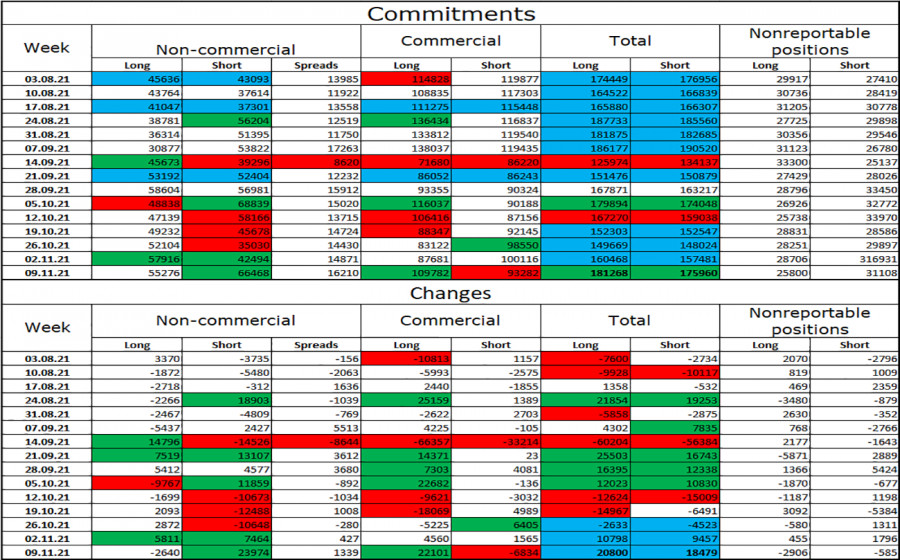
On the 4-hour chart, the quotes of the British performed a reversal in favor of the US currency and closed under the corrective level of 50.0% (1.3457). Thus, the process of falling can now be continued in the direction of the next Fibo level of 61.8% (1.3274). However, the emerging bullish divergence allows us to count on the resumption of growth in the direction of the Fibo level of 38.2% (1.3642). If it is canceled, then the chances of continuing the fall will increase. News calendar for the USA and the UK: UK - change in retail trade volume, taking into account fuel costs (07:00 UTC). On Friday, all the reports that were scheduled for that day have already been released in the UK, and nothing interesting appears in the calendar in the US. The information background will be practically absent today. COT (Commitments of Traders) report:
The latest COT report from November 9 on the pound showed that the mood of the major players has become much more "bearish". In the reporting week, speculators closed 2,640 long contracts and opened 23,974 short contracts. Thus, the number of long contracts in the hands of major players in just one week has become more than the number of short contracts by 11 thousand. But a week ago, the advantage was reversed by 17 thousand. However, in recent weeks, speculators do not have any clear mood and then increase purchases, then increase sales, and the total number of long and short contracts for all categories of traders remains approximately the same (181K - 175K). Thus, after several weeks of an active buildup of shorts, a period of increasing longs may come. GBP/USD forecast and recommendations to traders: I recommended selling the Brit if there is a rebound from the 76.4% level (1.3511) on the hourly chart with a target of 1.3411. This deal has already worked. New sales – at the close under 1.3411 with a target of 1.3296. I recommend buying the British when rebounding from the 1.3411 level on the hourly chart with a target of 1.3511. Terms: "Non-commercial" - major market players: banks, hedge funds, investment funds, private, large investors. "Commercial" - commercial enterprises, firms, banks, corporations, companies that buy foreign currency not to make speculative profits, but to ensure current activities or export-import operations. "Non-reportable positions" are small traders who do not have a significant impact on the price. The material has been provided by InstaForex Company - www.instaforex.com |


| You are subscribed to email updates from Forex analysis review. To stop receiving these emails, you may unsubscribe now. | Email delivery powered by Google |
| Google, 1600 Amphitheatre Parkway, Mountain View, CA 94043, United States | |


Comments